 Advances in Bioscience and Biotechnology, 2013, 4, 872-895 ABB http://dx.doi.org/10.4236/abb.2013.49116 Published Online September 2013 (http://www.scirp.org/journal/abb/) Some substrates of P-glycoprotein targeting β-amyloid clearance by quantitative structure-activity relationship (QSAR)/membrane-interaction (MI)-QSAR analysis Tongyang Zhu, Jie Chen, Jie Yang* State Key Laboratory of Pharmaceutical Biotechnology, Life College, Nanjing University, Nanjing, China Email: *luckyjyj@sina.com.cn Received 28 April 2013; revised 29 May 2013; accepted 15 June 2013 Copyright © 2013 Tongyang Zhu et al. This is an open access article distributed under the Creative Commons Attribution License, which permits unrestricted use, distribution, and reproduction in any medium, provided the original work is properly cited. ABSTRACT The pathogenesis of Alzheimer’s disease (AD) puta- tively involves a compromised blood-brain barrier (BBB). In particular, the importance of bra in -t o- blo od transport of brain-derived metabolites across the BBB has gained increasing attention as a potential mecha- nism in the pathogenesis of neurodegenerative disor- ders such as AD, which is characterized by the aber- rant polymerization and accumulation of specific mis- folded proteins, particularly β-amyloid (Aβ), a neu- ropathological hallmark of AD. P-glycoprotein (P-gp), a major component of the BBB, plays a role in the etiology of AD through Aβ clearance from the brain. Our QSAR models on a series of purine-type and propafenone-type substrates of P-gp showed that the interaction between P-gp and its modulators dep end ed on Molar Refractivity, LogP, and Shape Attribute of drugs it transports. Meanwhile, another model on BBB partitioning of some compounds revealed that BBB partitioning relied upon the polar surface area, LogP, Balaban Index, the strength of a molecule com- bined with the membrane-water complex, and the changeability of the structure of a solute-membrane- water complex. The predictive model on BBB parti- tioning contributes to the discovery of some molecules through BBB as potential AD therapeutic drugs. Moreover, the interaction model of P-gp and modu- lators for treatment of multidrug resistance (MDR) indicates the discovery of some molecules to increase Aβ clearance from the brain and reduce Aβ brain accumulation by regulating BBB P-gp in the early stages of AD. The mechanism provides a new insight into the therapeutic strategy for AD. Keywords: P-Glycoproteins; Quantitative Structure-Activity Relationship; ATP-Binding Cassette Transporters; Multidrug Resistance; Blood-Brain Barrier 1. INTRODUCTION Therapy for central nervous system (CNS) diseases re- quires drugs that can cross the blood-brain barrier (BBB) [1]. BBB not only maintains the homeostasis of the CNS, but also refuses many potentially important diagnostic and therapeutic agents from entering into the brain [2]. The pathological hallmarks of Alzheimer’s disease (AD) are progressive brain atrophy and the accumulation of cortical senile plaques, formed by the aggregation of amy- loid beta peptide (Aβ) [3], and neurofibrillary tangles (NFT), namely the self-assembly of hyperphosphorylated forms of the microtubule associated protein tau into fi- bers termed “paired helical filaments (PHFs)” [4,5]. The pathogenesis of AD’s senile plaque and NFT lesions putatively involves a compromised BBB [6], which pro- tects the brain against endogenous and exogenous com- pounds and plays an important part in the maintenance of the microenvironment of the brain [7]. The ability of drug permeating across BBB becomes critical in the de- velopment of new medicines, especially in the design of new drugs active in brain tissue. In particular, the impor- tance of brain-to-blood transport of brain-derived me- tabolites across the BBB has gained increasing attention as a potential mechanism in the pathogenesis of neu- rodegenerative disorders such as Parkinson’s disease (PD) [8] and AD characterized by the aberrant polymerization and accumulation of specific misfolded proteins, par- ticularly Aβ. P-glycoprotein (P-gp or MDR1/ABCB1) is a 170-kDa transmembrane (TM) protein widely expres sed from the epithelial cells of the intestine, liver, kidney, placenta, uterus, and testis to endothelial cells of the B BB [9]. It belongs to the ABC (ATP-binding cassette) trans- porter family and serves to pump exogenous substances *Corresponding a uthor. OPEN ACCESS  T. Y. Zhu et al. / Advances in Bioscience and Biotechnology 4 (2013) 872-895 873 out of the cells. The domain topology of P-gp con sists of two homologous halves each consisting a TM domain preceding a cytosolic nucleotide binding domain. Each TM domain is composed of six TM α-helix segments in- volved in efflux as well as in drug binding [10]. The ABC transport protein P-gp, a major component of the BBB, mediates the efflux of Aβ from the brain as well as is a major factor in mediating resistance to brain entry by numerous exogenous chemicals, including therapeutic phar- maceuticals [11]. P-gp plays a role in the etiology of AD through the clearance of Aβ fro m the br ain. S ome drugs, such as rifampicin, dexamethasone, caffeine, verapamil, hyperforin, β-estradiol and pentylenetetrazole, were able to improve the efflux of Aβ from the cells via P-gp up- regulation [12]. Meanwhile, some compounds have been shown to reverse the P-gp mediated multidru g resistance (MDR), including verapamil, adriamycin, cyclosporin, and dexverapamil [13]. Hartz et al. have shown that up- regulating P-gp in the early stages of AD has the poten- tial to increase Aβ clearance from the brain and reduce Aβ brain accumulation by a transgenic mouse model of AD (hAPP-overexpressing mice) [14]. Abuznait et al. have also elucidated the impact of P-gp up-regulation on the clearance of Aβ [12], which indicated that targeting Aβ clearance via P-gp up-regulation was effective in sl ow- ing or halting the progression of AD and there was the possibility of P-gp as a potent ial therapeutic target for AD. P-gp at the BBB functions as an active efflux pump by extruding a substrate from the brain, which is important for maintaining loco-regional homeostasis in the brain and protection against toxic compounds [8]. P-gp is also discovered in various resistant tumor cells and expressed widely in many normal tissues and plays a very impor- tant role in drug ADME-Tox (absorption, distribution, metabolism, excretion, and toxicity). MDR is a matter of growing concern in chemotherapy. Cells which express the MDR phenotype can over-express efflux transporters after exposure to a single agent. As a result, these cells become resistant to the selective agent and cross-resistant to a broad spectrum of structurally and functionally dis- similar drugs. The drug efflux pump P-gp has been show n to promote MDR in tumo rs as well as to influ en ce AD M E properties of drug candidates [15]. P-gp is expressed at the BBB, the blood-cerebrospinal fluid barrier, and the intestinal barrier, thus modulating the absorption and ex- cretion of xenobiotics across these barriers. P-gp and its ligands (substrates and inhibitors) are therefore exten- sively studied both with respect to reversing MDR in tumors and for modifying ADME-Tox properties of drug candidates, such as CNS active agents [15]. P-gp pos- sesses broad substrate specificity and the substrates in- clude members of many clinically important therapeutic drug classes, including anti-HIV protease inhibitors, cal- cium channel blockers used in the treatment of angina, hypertension, antibiotics and cancer chemotherapeutics [16]. In this active efflux process, energy originating from ATP hydrolysis is directly consumed. Because of such a wide distribution of P-gp, if a drug such as quini- dine or verapamil inhibits the function of P-gp, it will also inhibit the excretion of digoxin by P-gp’s leading to increased plasma levels and toxicity due to digoxin. It is believed to be an important protective mechanism aga inst environmental toxins. Since the function of P-gp always results in the lack of intracellular levels of the drug ne- cessary for effective therapy, the overexpression of P-gp in certain malignant cells is always associated with MDR phenotype [17]. Although a low resolution structure of P-gp is obtained, its physiological function and mecha- nisms of MDR modulation are still not very clear [18]. It is well known that a large number of structurally and functionally diverse compounds act as substrates or mod u- lators of P-gp, including calcium and sodium channel blockers, calmodulin antagonists and structural analogues, protein kinase C inhibitors, steroidal and structurally re- lated compounds, indole alkaloids, cyclic peptides and macrolide compounds, flayanoids and miscellaneous com- pounds [19], which mostly share common structural fea- tures, such as aromatic ring structures and high lipo- philicity. Some of them possess MDR reversing activity while only a small number of them have entered clinical study. Classification of candidate drugs as substrates or inhibitors of the carrier protein is crucial in drug devel- opment [20]. On the other hand, the prerequisite to cure neurologi- cal disorders is that the drug distribution in CNS can reach effectively therapeutic concentrations [2]. Usually, the high BBB penetration is needed for drugs that acti- vate in brain. The molecule negotiating the BBB must g o through cellular membranes comprised of a lipid bilayer. Until now, it is widely accepted that interaction of com- pounds with P-gp is a complex process and at this time the details of its mechanism of action are still the sub ject of hot debate. Although the experimental analysis of drug permeability is essential, the procedure of experiment is time consuming and complicated, a theoretical model of drug permeability is effective to give predictions. Mem- brane-interaction (MI)-QSAR (quantitative structure-ac- tivity relationship) method is a structur e-based d esi gn me- thodology combined with classic intramolecular QSAR analysis to model chemically and structurally diverse compounds interacting with cellular membranes. Our modified MI-QSAR method that combines QSAR with solute-membrane-water complex simulating the BBB en- vironment is more close to the body condition than MI- QSAR and possesses higher ability to predict organic compounds across BBB [21]. There are several critical assumptions considered that can influence validity and correctness of any QSAR study as follows: the same Copyright © 2013 SciRes. OPEN ACCESS  T. Y. Zhu et al. / Advances in Bioscience and Biotechnology 4 (2013) 872-895 874 mechanism of action of all studied analogs; a comparable manner of their binding to the receptor; correlation of binding to the interaction energies; correlation of meas- ured biological activities to the binding affinities [22]. All the accuracy answer and research based on the above questions above may guarantee that proper and reliable relationships are obtained. However, different mechanisms and different binding sites may be involved in the case of MDR modulators. Several screening assays can help in the identification of substrates and inhibitors although they have both advantages and drawbacks, such as cyto- toxity assays [23], inhibition of efflux assays [16], P-gp- ATPase activation assays, and drug transport assays [24]. The goal of a QSAR study is to find a means of pre- dicting the activity of a new compound. If possible, a desirable goal is the understanding of the biology and chemistry that give rise to that activity and the conse- quential possibility of reengineering the compound to re- move or enhance that activity. One successful example is the transformation of nalidixic acid with the help of QSAR into an important family of drug: the quinolone carboxylates, such as norfloxacin, fleroxacin, ciproflox- acin, and levofloxacin [25]. Since the method was estab- lished in the 1960s, QSAR equations have been used to describe the biological activities of thousan ds o f different drugs and drug candidates [26]. The method definitely provides a more accurate way to synthesize or filtrate the new chemical compounds. At last, the final destination is to degrade the cost of research and manufacture. To date, so many methods have been used in QSAR study and some of them have got successful results. There are gen- eral methods used in the literatures these years, such as multiple linear regression (MLR) method, partial least square regression (PLSR) [18], MI-QSAR analysis [21], 3D QSAR [27], and artificial neural network (ANN) [28]. In order to get more accurate results and QSAR models, we have used two different analyses: MLR and PLSR. Moreover, we focus on constructing theoretical models of the interaction between organic compounds and P-gp as well as the predictive models of BBB partitioning of organic compounds on the basis of QSAR analysis and MI-QSAR analysis. 2. MATERIALS AND METHODS 2.1. P-Glycoprotein Ligands Building of some compounds. 36 purine derivatives were selected and used in QSAR analysis (Table 1) [29]. These compounds were divided into two sets: the train- ing set and the test set. The study of the MDR-reversing properties of these derivatives was carried out in vitro on P388/VCR-20 cells, a murine leukemia cell line whose resistance was induced by vincristine (VCR), and KB-A1 cells, a human epidermoid carcinoma cell line whose resistance was induced by adriamycin (ADR). The com- pounds were tested at four concentrations (0.5 - 5 μM) in association with VCR (P388/VCR-20 cells) or ADR (KB - A1 cells). In this test, MDR ratio in P388/VDR-20 and KB-A1 in vitro was used as biological activity for the whole dataset, namely 50 ratio 50 IC CD MDR ICCD mod . Here “CD” is the abbreviation for cytotoxic drug (such as VCR and ADR) in cytotoxity assays, and “mod” means modulators. It is defined as ratio between the IC50 values (concentration that inhibits the growth of MDR cells by 50%) of the cytotoxic agent in absence and presence of relatively nontoxic concentration of the modifier [23]. Most often the IC50 for several concentration of a cyto- toxic drug is evaluated in the presence and absence of a nontoxic concentration of a P-gp modifier. In this assay modulators that interacted with P-gp and thus reduced the efflux of the cytotoxic compounds would increase the apparent toxicity of the cytotoxic compound [16]. The IC50 data were based on a general assessment of cytotox- icity and thus might account for more then one acting mechanism in the resistant cells used [16]. Furthermore, it is well known that the MDR ratio for any given com- pound can vary greatly depending on the cell type used for the assay as well as the intrinsic cytotoxicity of the compounds used. The data is also dependent on the con- centration of the P-gp substrates or modulators used in the studies [30]. Similarly, another 21 propafenone analogs were se- lected from the literature of Diethart Schmid et al. and used in QSAR analysis (Table 2) [31]. In this test Ka of P-gp ATPase in the adriamycin-resistant subline CCRF ADR5000 was used as biological activity for the whole dataset [31]. The assays were performed based on the colorimetric determination of inorganic phosphate released by the hydrolysis of ATP. Table 2 shows all the struc- tures and the experimental biological activity value. Finally, all two-dimensional (2D) structures of these compounds mentioned above were constructed using the chemical drawing software ChemDraw 8.0 and prepared for the next calculation. Calculation of some descriptors. Molecular descrip- tors are “numbers that characterize a specific aspect of the molecular structure” [32]. There are some molecular descriptors used in QSAR studies as follows: physico- chemical properties (i.e. hydrophobicity, aqueous solu- bility, molecular electronegativity, and molecular refrac- tivity), quantum chemical parameters (e.g. atomic charges, energies of HOMO (highest occupied molecular orbital) and LUMO (lowest unoccupied molecular orbital)) [33], topological indexes (such as molecular connectivity in- dexes) [34], and other 3D descriptors. Molecular de- scriptors were mostly calculated by the commercial soft- Copyright © 2013 SciRes. OPEN ACCESS 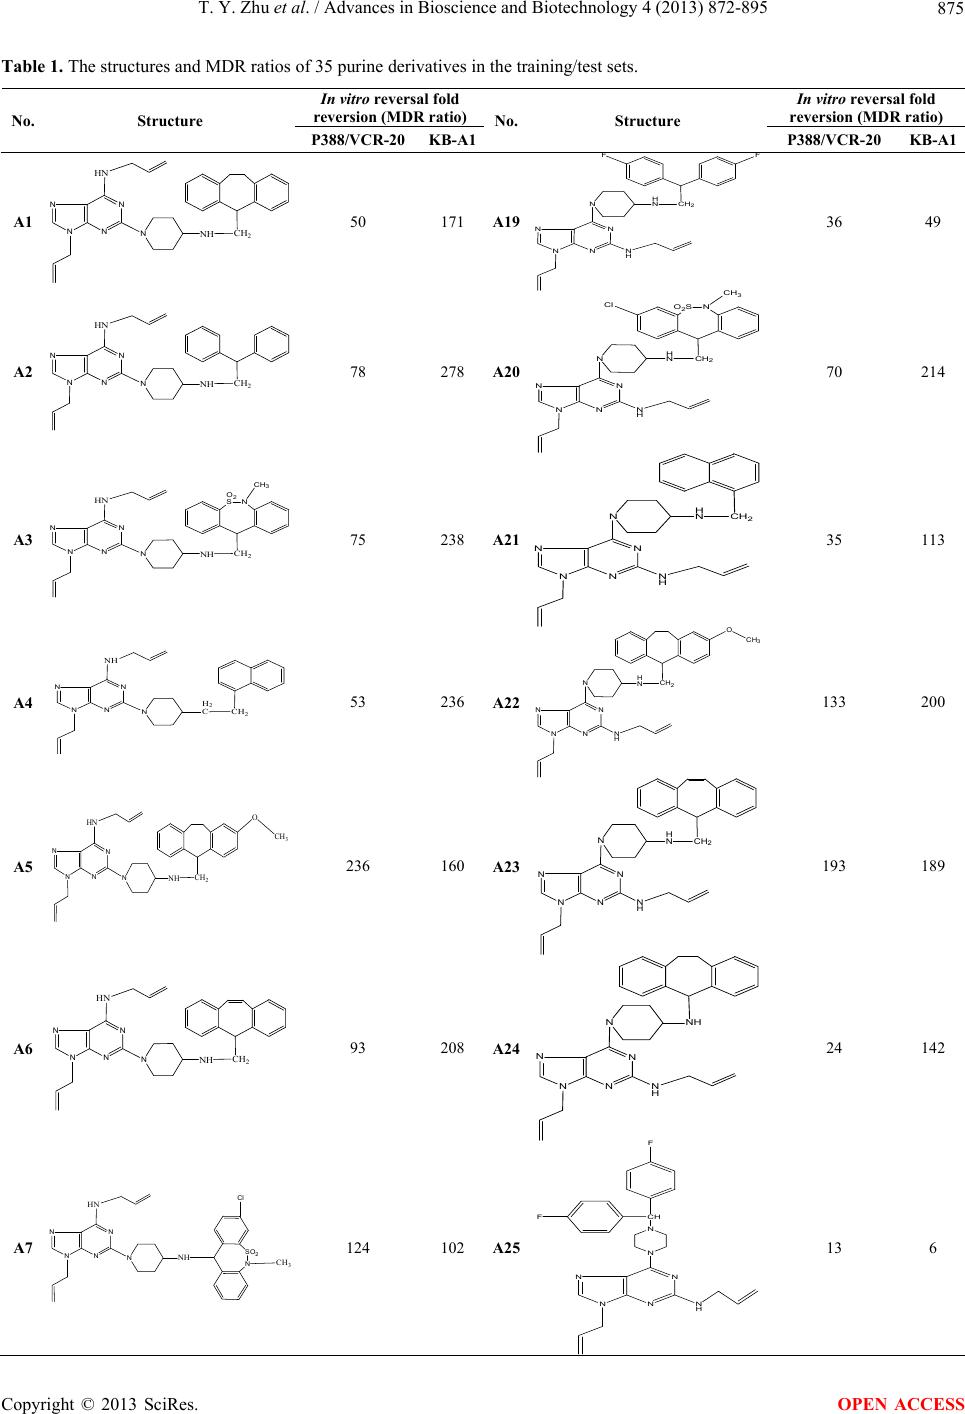 T. Y. Zhu et al. / Advances in Bioscience and Biotechnology 4 (2013) 872-895 Copyright © 2013 SciRes. 875 Table 1. The structures and MDR ratios of 35 purine derivatives in the training/test sets. In vitro reversal fold reversion (MDR ratio) In vitro reversal fold reversion (MDR ratio) No. Structure P388/VCR-20KB-A1 No. Structure P388/VCR-20 KB-A1 A1 N N N N HN N NH CH 2 50 171 A19 N N N N N H NH NCH 2 F F 36 49 A2 N N N N HN N NH CH 2 78 278 A20 N N N N N H NH NCH 2 O 2 SN CH 3 Cl 70 214 A3 N N N N HN N NH CH 2 O 2 SN CH 3 75 238 A21 N N N N N H NH NCH 2 35 113 A4 N N N N NH N H 2 CCH 2 53 236 A22 N N N N N H NH NCH2 O CH3 133 200 A5 N N N N HN N NH CH 2 O CH 3 236 160 A23 N N N N N H NH NCH2 193 189 A6 N N N N HN N NH CH2 93 208 A24 N N N N N H NNH 24 142 A7 N N N N HN N NH SO 2 N CH 3 Cl 124 102 A25 N N N N N H N N CH F F 13 6 OPEN ACCESS 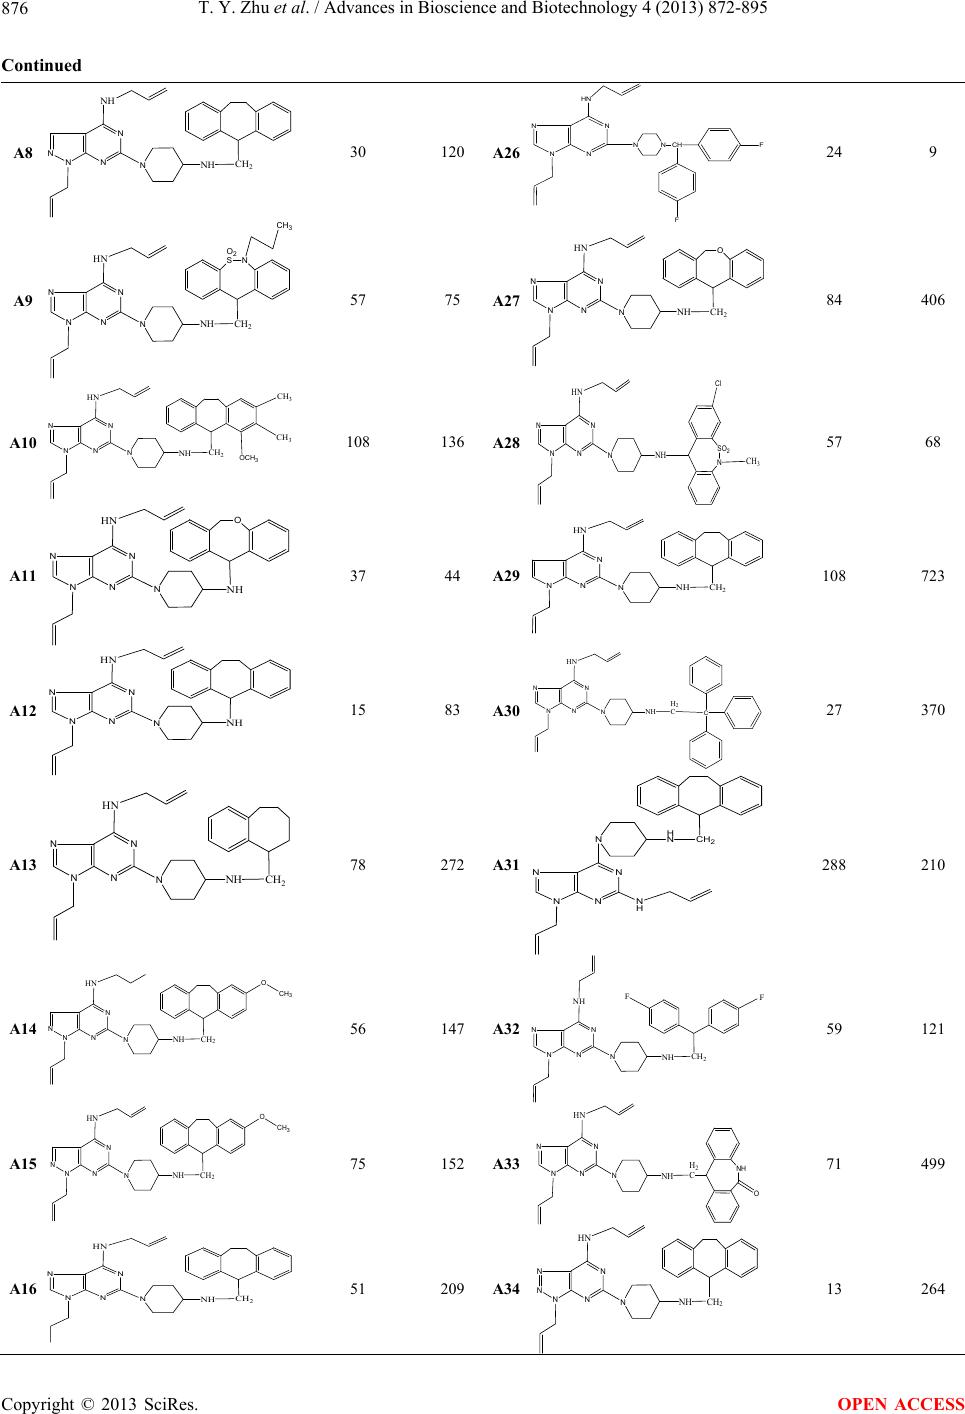 T. Y. Zhu et al. / Advances in Bioscience and Biotechnology 4 (2013) 872-895 876 Continued A8 N N N N NH N NH CH 2 30 120 A26 N N N N HN NNCH F 24 9 A9 N N N N HN N NH CH 2 O 2 SN CH 3 57 75 A27 N N N N HN N NH CH 2 O 84 406 A10 N N N N HN N NH CH 2 OCH 3 CH 3 CH 3 108 136 A28 N N N N HN N NH SO 2 N CH 3 Cl 57 68 A11 N N N N HN N NH O 37 44 A29 N N N HN N NH CH 2 108 723 A12 N N N N HN N NH 15 83 A30 N N N N HN N NH H 2 C C 27 370 A13 N N N N HN N NH CH 2 78 272 A31 N N N N N H NH NCH 2 288 210 A14 N N N N HN N NH CH 2 O CH 3 56 147 A32 N N N N NH N NH CH 2 FF 59 121 A15 N N N N HN N NH CH 2 O CH 3 75 152 A33 N N N N HN N NH H 2 C NH O 71 499 A16 N N N N HN N NH CH 2 51 209 A34 N N N N N HN N NH CH 2 13 264 Copyright © 2013 SciRes. OPEN ACCESS 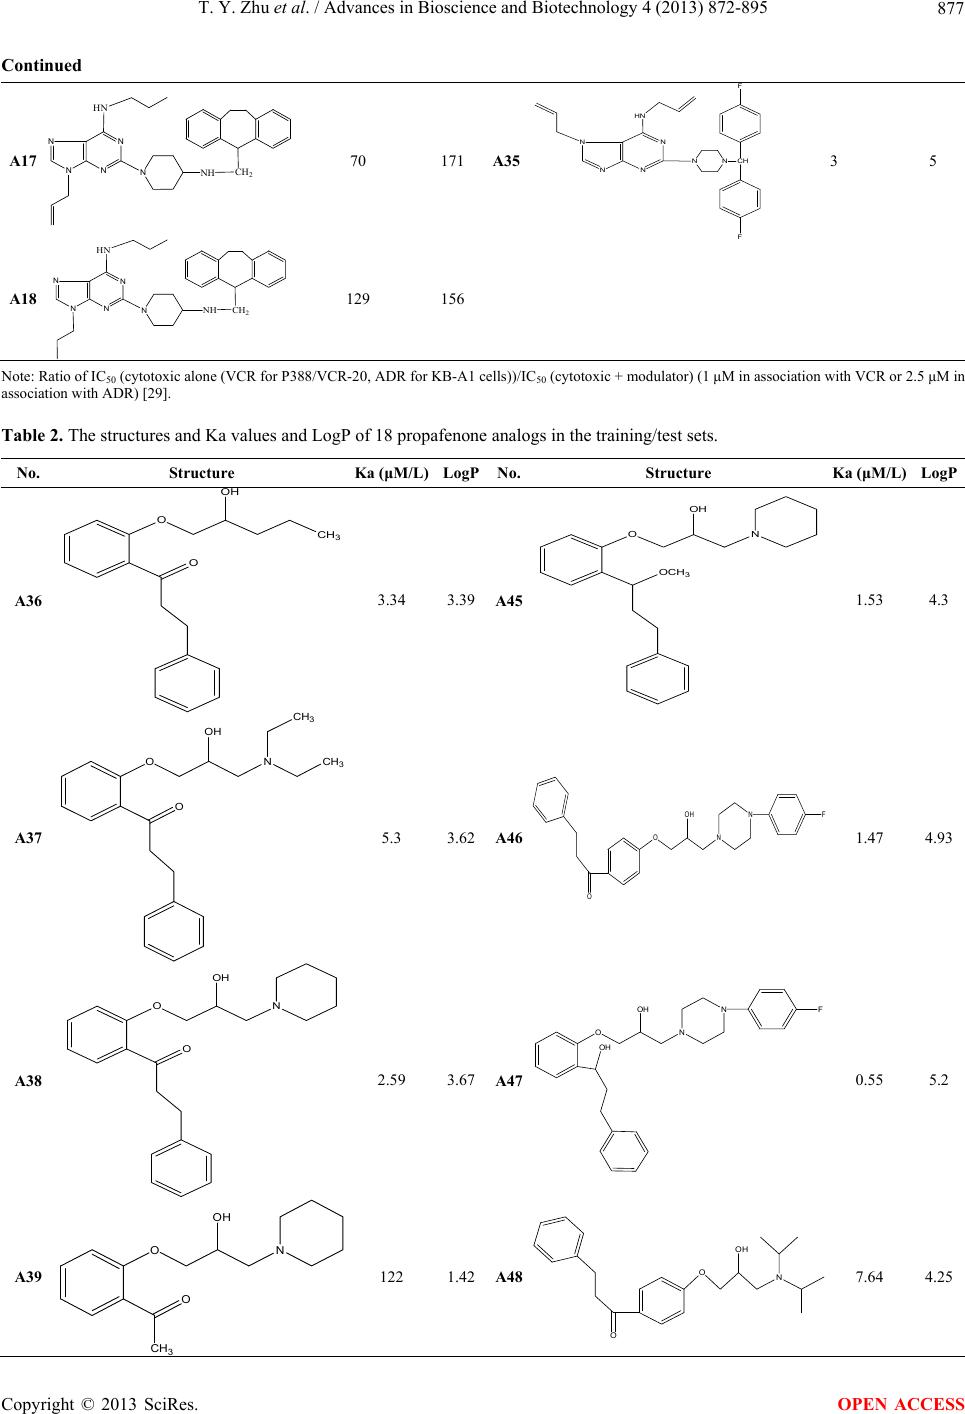 T. Y. Zhu et al. / Advances in Bioscience and Biotechnology 4 (2013) 872-895 877 Continued A17 N N N N HN N NH CH 2 70 171 A35 N N N N HN NN CH F F 3 5 A18 N N N N HN N NH CH 2 129 156 Note: Ratio of IC50 (cytotoxic alone (VCR for P388/VCR-20, ADR for KB-A1 cells))/IC50 (cytotoxic + modulator) (1 μM in associatio n with VCR or 2 .5 μM in association with ADR) [29]. Table 2. The structures and Ka values and LogP of 18 propafenone analogs in the training/test sets. No. Structure Ka (μM/L)LogPNo.Structure Ka (μM/L) LogP A36 O OH O CH 3 3.34 3.39A45 O N OH OCH 3 1.53 4.3 A37 O OH O N CH 3 CH 3 5.3 3.62A46 O OH N N F 1.47 4.93 A38 O OH O N 2.59 3.67A47 OH O OH N N F 0.55 5.2 A39 O N OH O CH 3 122 1.42A48 O ON OH 7.64 4.25 Copyright © 2013 SciRes. OPEN ACCESS  T. Y. Zhu et al. / Advances in Bioscience and Biotechnology 4 (2013) 872-895 Copyright © 2013 SciRes. 878 Continued A40 O N OH O N F 0.36 4.93A49 OH ON OH 12.2 4.52 A41 O N OH O CH N F 6.13 2.67A50 OCH 3 ON OH 2.26 4.88 A42 O N OH O CH O 120 0.94A51 O N OH O CH 3 OH 10.5 2.38 A43 O N OH O O 18.5 2.54A52 O N OH OH 12.8 3.94 A44 O N OH O OH 1.01 3.98A53 O O OH N N F 4.15 4.93 ware packages Chemoffice Chem3D Ultra 8.0, involv ing molecular mechanism parameters (Stretch-Bend Energy (Estretch), Bending Ener gy (Ebend), Torsion Energy (Etorsion), Total Energy (Etotal), van der Waals Energy (EVDW), etc), quantum chemistry parameters (i.e. Electronic Energy (Eelectronic), HOMO Energy (EHOMO) and LUMO Energy (ELUMO)), hydrophobic parameters (such as ClogP), ste- reo parameters (eg. Es, Balaban Index (BI), Connolly Accessible Area (CAA), Molecular Weight (MW), Shape Attribute (ShA), Total Connectivity (Tcon), and Wiener OPEN ACCESS 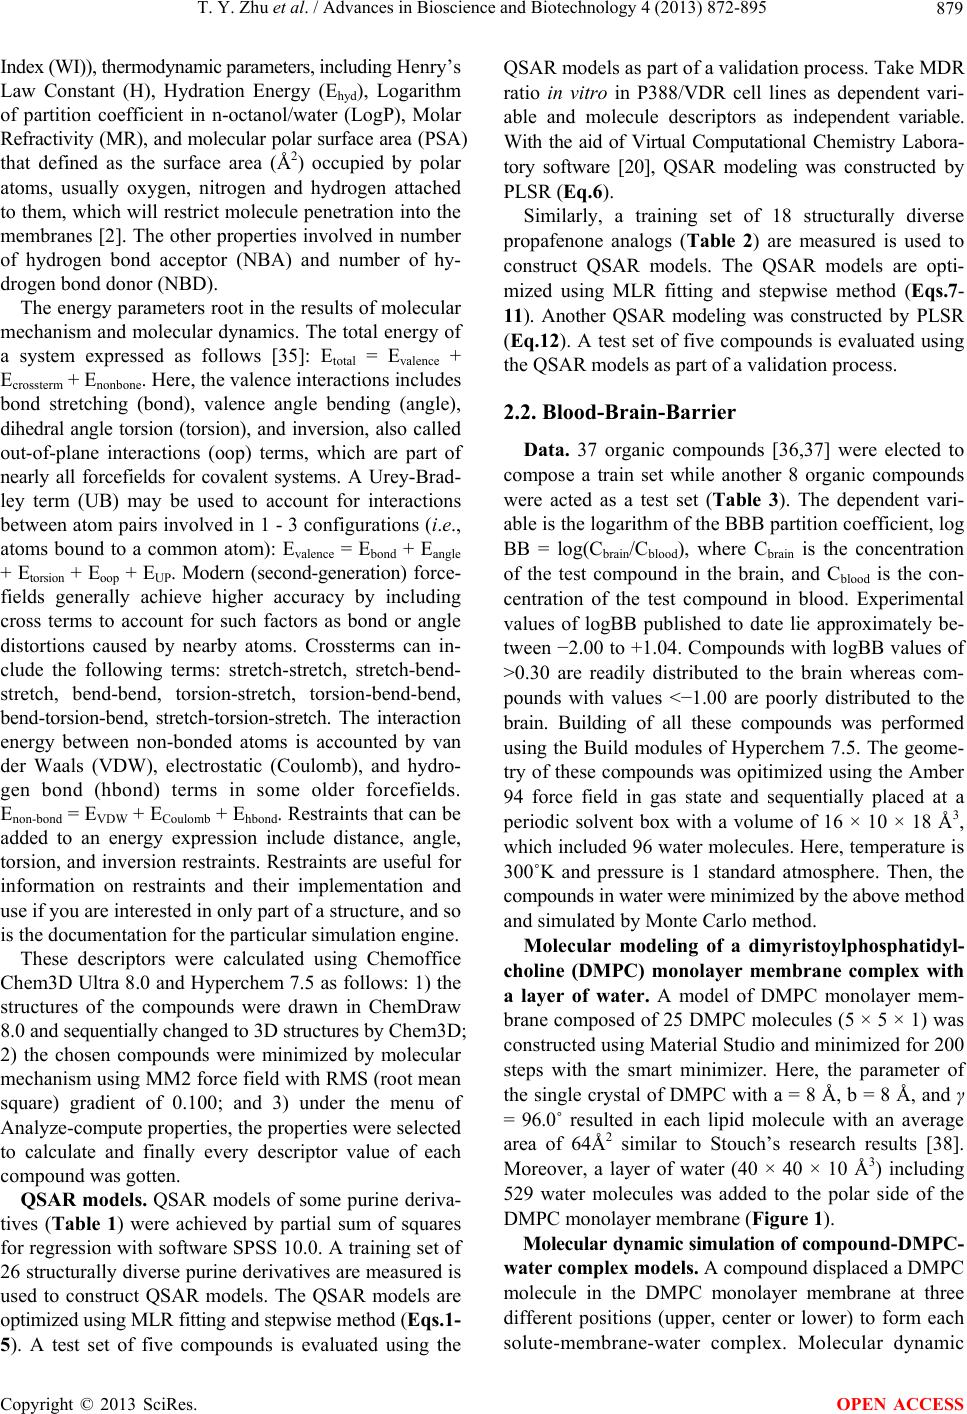 T. Y. Zhu et al. / Advances in Bioscience and Biotechnology 4 (2013) 872-895 879 Index (WI)), thermodynamic parameters, including Henry’s Law Constant (H), Hydration Energy (Ehyd), Logarithm of partition coefficient in n-octanol/water (LogP), Molar Refractivity (MR), and molecular polar surface area (P SA) that defined as the surface area (Å2) occupied by polar atoms, usually oxygen, nitrogen and hydrogen attached to them, which will restrict molecule penetration into the membranes [2]. The other properties involved in number of hydrogen bond acceptor (NBA) and number of hy- drogen bond donor (NBD). The energy parameters root in the results of molecular mechanism and molecular dynamics. The total energy of a system expressed as follows [35]: Etotal = Evalence + Ecrossterm + Enonbone. Here, the valence interactions includes bond stretching (bond), valence angle bending (angle), dihedral angle torsion (torsion), and inversion, also called out-of-plane interactions (oop) terms, which are part of nearly all forcefields for covalent systems. A Urey-Brad- ley term (UB) may be used to account for interactions between atom pairs involved in 1 - 3 configurations (i.e., atoms bound to a common atom): Evalence = Ebond + Eangle + Etorsion + Eoo p + EUP. Modern (second-generation) force- fields generally achieve higher accuracy by including cross terms to account for such factors as bond or angle distortions caused by nearby atoms. Crossterms can in- clude the following terms: stretch-stretch, stretch-bend- stretch, bend-bend, torsion-stretch, torsion-bend-bend, bend-torsion-bend, stretch-torsion-stretch. The interaction energy between non-bonded atoms is accounted by van der Waals (VDW), electrostatic (Coulomb), and hydro- gen bond (hbond) terms in some older forcefields. Enon-bond = EVDW + ECoulomb + Ehbond. Restraints that can be added to an energy expression include distance, angle, torsion, and inversion restraints. Restraints are useful for information on restraints and their implementation and use if you are interested in only part of a structure, and so is the documentation for the particular simulation engine. These descriptors were calculated using Chemoffice Chem3D Ultra 8.0 and Hyperchem 7.5 as follows: 1) the structures of the compounds were drawn in ChemDraw 8.0 and sequentially changed to 3D structures by Che m3D; 2) the chosen compounds were minimized by molecular mechanism using MM2 force field with RMS (root mean square) gradient of 0.100; and 3) under the menu of Analyze-compute properties, the properties were selected to calculate and finally every descriptor value of each compound was gotten. QSAR models. QSAR models of some purine deriva- tives (Table 1) were achieved by partial sum of squares for regression with software SPSS 10.0. A training set of 26 structurally diverse purine derivatives are measured is used to construct QSAR models. The QSAR models are optimized using MLR fitt i ng and stepwi se method (Eqs.1- 5). A test set of five compounds is evaluated using the QSAR models as part of a validation process. Take MDR ratio in vitro in P388/VDR cell lines as dependent vari- able and molecule descriptors as independent variable. With the aid of Virtual Computational Chemistry Labora- tory software [20], QSAR modeling was constructed by PLSR (Eq.6). Similarly, a training set of 18 structurally diverse propafenone analogs (Table 2) are measured is used to construct QSAR models. The QSAR models are opti- mized using MLR fitting and stepwise method (Eqs.7- 11). Another QSAR modeling was constructed by PLSR (Eq.12). A test set of five compounds is evaluated using the QSAR models as part of a validation process. 2.2. Blood-Brain-Barrier Data. 37 organic compounds [36,37] were elected to compose a train set while another 8 organic compounds were acted as a test set (Table 3). The dependent vari- able is the logarithm of the BBB partition coefficient, log BB = log(Cbrain/Cblood), where Cbrain is the concentration of the test compound in the brain, and Cblood is the con- centration of the test compound in blood. Experimental values of logBB published to date lie approximately be- tween −2.00 to +1.04. Compound s with logBB values of >0.30 are readily distributed to the brain whereas com- pounds with values <−1.00 are poorly distributed to the brain. Building of all these compounds was performed using the Build modules of Hyperchem 7.5. The geome- try of these compounds was opitimized using the Amber 94 force field in gas state and sequentially placed at a periodic solvent box with a volume of 16 × 10 × 18 Å3, which included 96 water molecules. Here, temperature is 300˚K and pressure is 1 standard atmosphere. Then, the compounds in water were minimized by the above method and simulated by Monte Carlo method. Molecular modeling of a dimyristoylphosphatidyl- choline (DMPC) monolayer membrane complex with a layer of water. A model of DMPC monolayer mem- brane compo sed of 25 DMPC molecules (5 × 5 × 1) was constructed using Material Studio and minimized for 200 steps with the smart minimizer. Here, the parameter of the single crystal of DMPC with a = 8 Å, b = 8 Å, and γ = 96.0˚ resulted in each lipid molecule with an average area of 64Å2 similar to Stouch’s research results [38]. Moreover, a layer of water (40 × 40 × 10 Å3) including 529 water molecules was added to the polar side of the DMPC monolayer membrane (Figure 1). Molecular dynamic s imulation of compo u nd -D M PC - water complex models. A compound displaced a DMPC molecule in the DMPC monolayer membrane at three different positions (upper, center or lower) to form each solute-membrane-water complex. Molecular dynamic Copyright © 2013 SciRes. OPEN ACCESS  T. Y. Zhu et al. / Advances in Bioscience and Biotechnology 4 (2013) 872-895 Copyright © 2013 SciRes. 880 Table 3. The structures and LogBB values of some compounds in the training/test sets. No Structure LogBBNoStructure LogBB Training set B1 NH2 NH2NS N −0.04 B20 N H C H3C 0.85 B2 N O CH H NNO HN NC 3 H −2.00 B21 N N 0.03 B3 H3C N H3C OS NH N HN O −1.30 B22 H HH H HH 0.37 B4 N H N N H N C H 3 O H3CN CH3 OS−1.06 B23 CH3 CH3 HO −0.15 B5 H N Cl N HN l 0.11 B24 H C H3COH −0.17 B6 NN H3C N CH3 H3C 0.49 B25 CH3 CH H3C 0.97 B7 CH3 N CH3 N N N HN H2N −1.17 B26 CH3 CH H3C H3C 1.04 OPEN ACCESS 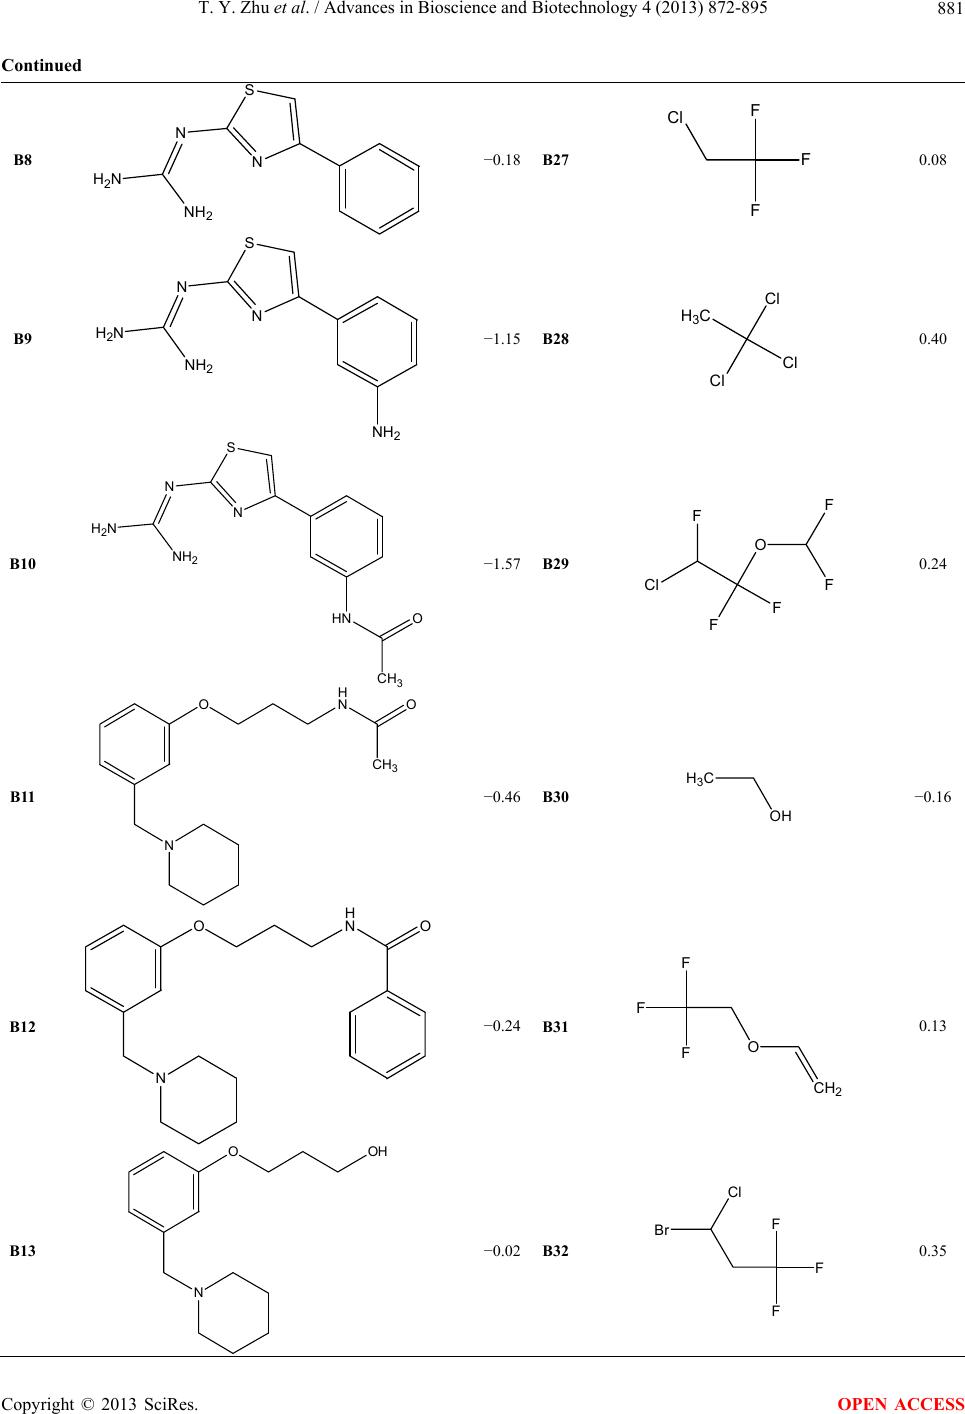 T. Y. Zhu et al. / Advances in Bioscience and Biotechnology 4 (2013) 872-895 881 Continued B8 NH2 H2N N S N −0.18 B27 F F F Cl 0.08 B9 H2N NH2 N S N NH2 −1.15 B28 H3CCl Cl Cl 0.40 B10 H2N NH2 N S N HN CH O −1.57 B29 Cl F O F F FF 0.24 B11 N OH N CH3 O −0.46 B30 H3C OH −0.16 B12 N OH NO −0.24 B31 F F FO CH2 0.13 B13 N OOH −0.02 B32 F F F Br Cl 0.35 Copyright © 2013 SciRes. OPEN ACCESS 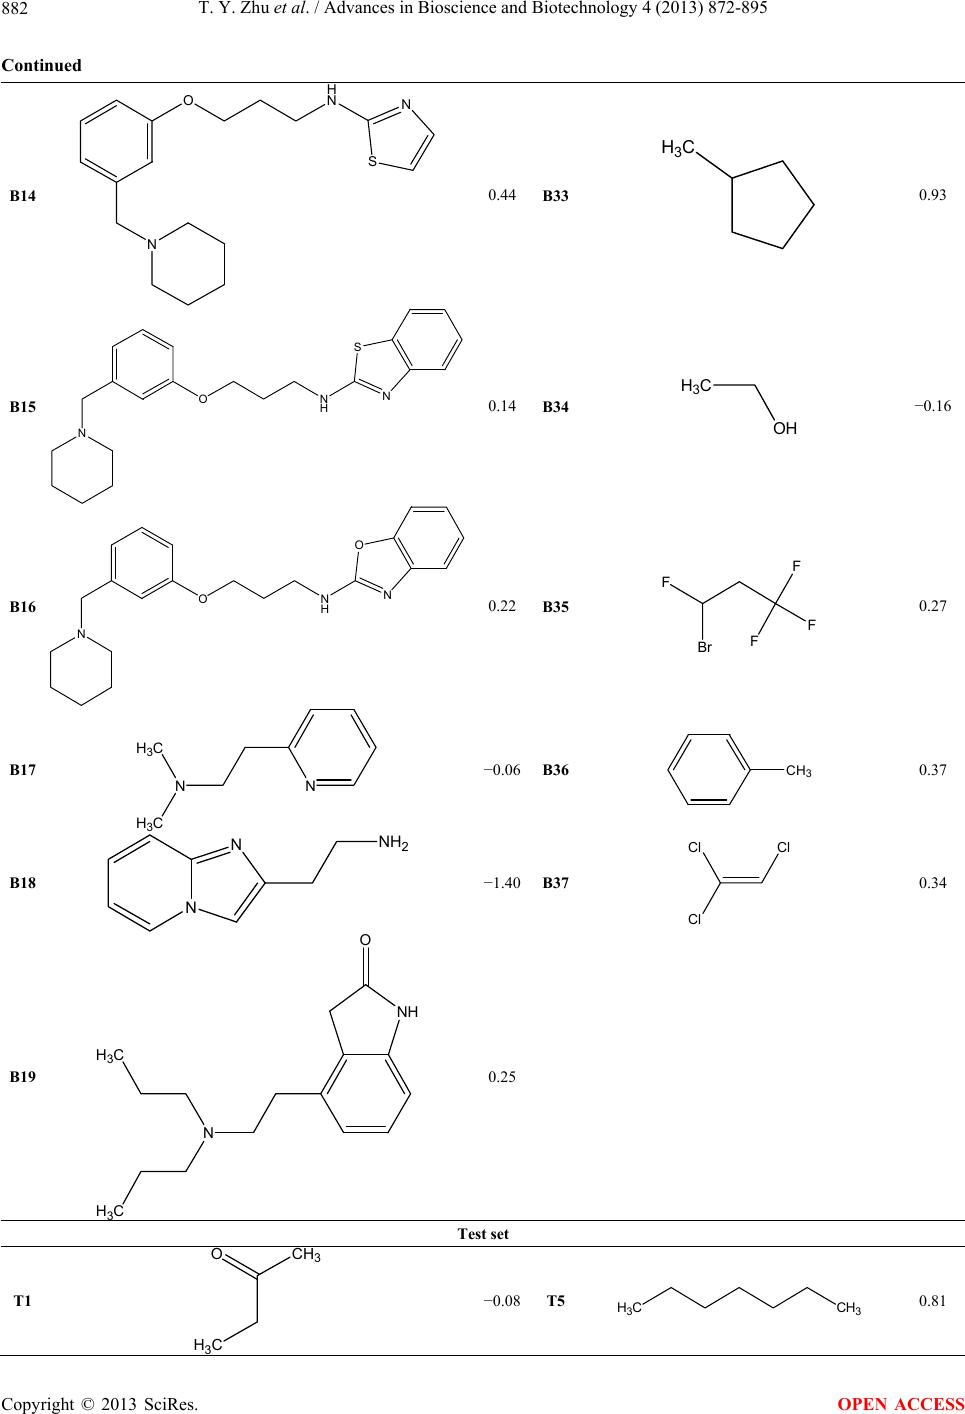 T. Y. Zhu et al. / Advances in Bioscience and Biotechnology 4 (2013) 872-895 882 Continued B14 N OH NN S 0.44 B33 H3C 0.93 B15 N ON HN S 0.14 B34 H3C H −0.16 B16 N ON HN O 0.22 B35 F B F FF 0.27 B17 NN H3C H3C −0.06 B36 CH3 0.37 B18 N NNH2 −1.40 B37 ClCl l 0.34 B19 H3C N H C NH O 0.25 Test set T1 CH3 H C O −0.08 T5 H CCH 0.81 Copyright © 2013 SciRes. OPEN ACCESS 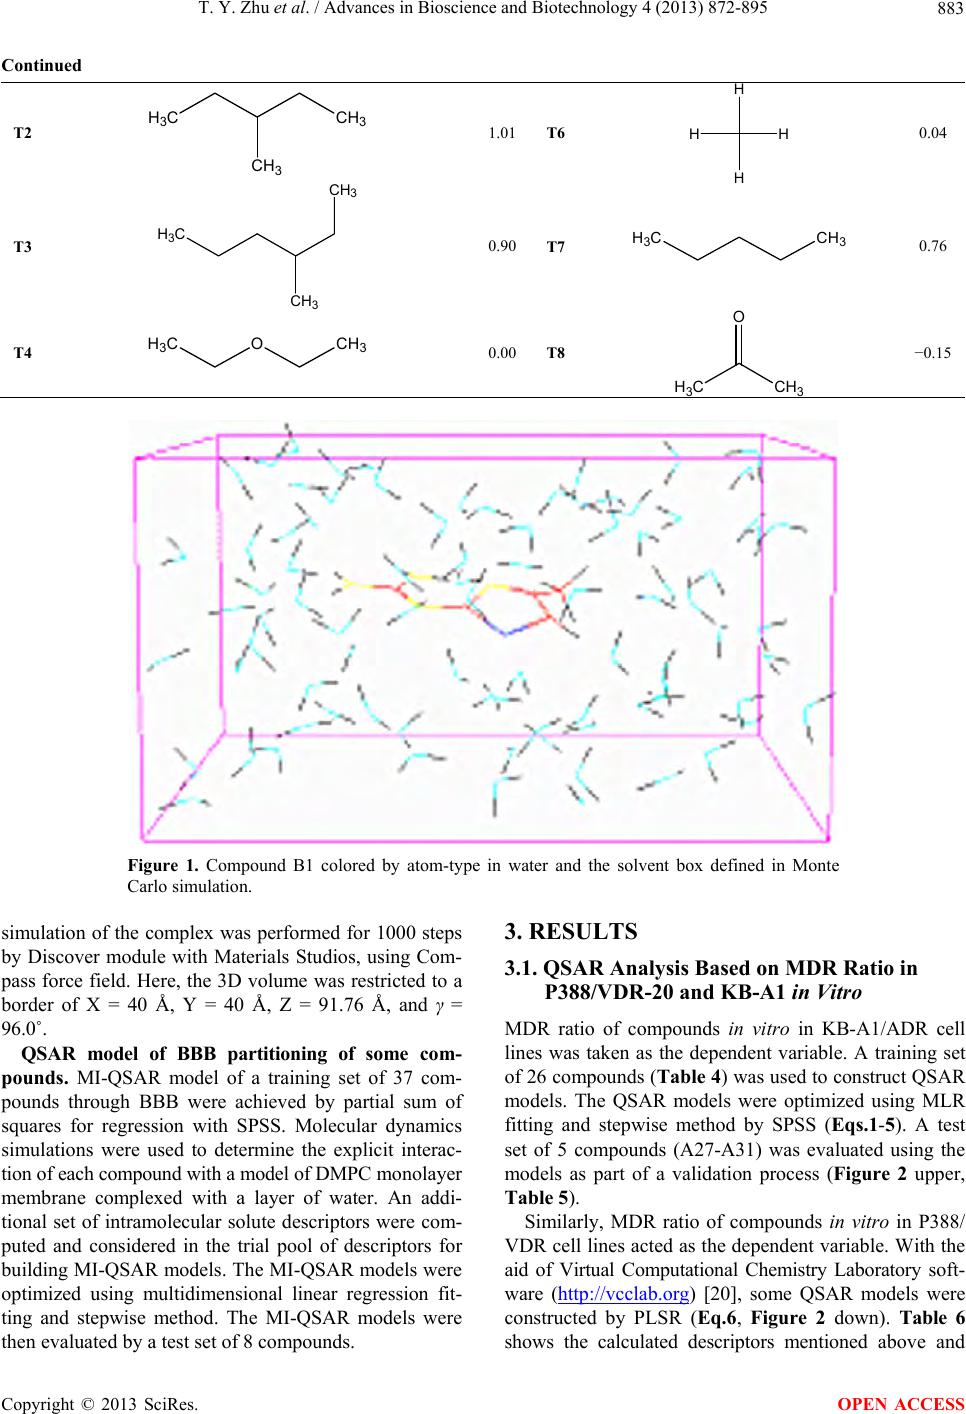 T. Y. Zhu et al. / Advances in Bioscience and Biotechnology 4 (2013) 872-895 Copyright © 2013 SciRes. 883 H Continued T2 H3CC 3 CH3 1.01 T6 H H HH 0.04 T3 CH3 H3C CH3 0.90 T7 CH3 H3C 0.76 T4 CH3 OH3C 0.00 T8 H CCH O −0.15 Figure 1. Compound B1 colored by atom-type in water and the solvent box defined in Monte Carlo simulation. 3. RESULTS simulation of the complex was performed for 1000 steps by Discover module with Materials Studios, using Com- pass force field. Here, the 3D volume was restricted to a border of X = 40 Å, Y = 40 Å, Z = 91.76 Å, and γ = 96.0˚. 3.1. QSAR Analysis Based on MDR Ratio in P388/VDR-20 and KB-A1 in Vitro MDR ratio of compounds in vitro in KB-A1/ADR cell lines was taken as the dependent variable. A training set of 26 co mpounds (Ta ble 4) was used to construct QSAR models. The QSAR models were optimized using MLR fitting and stepwise method by SPSS (Eqs.1-5). A test set of 5 compounds (A27-A31) was evaluated using the models as part of a validation process (Figure 2 upper, Table 5). QSAR model of BBB partitioning of some com- pounds. MI-QSAR model of a training set of 37 com- pounds through BBB were achieved by partial sum of squares for regression with SPSS. Molecular dynamics simulations were used to determine the explicit interac- tion of each compound with a model of DMPC monolayer membrane complexed with a layer of water. An addi- tional set of intramolecular solute descriptors were com- puted and considered in the trial pool of descriptors for building MI-QSAR models. The MI-QSAR models were optimized using multidimensional linear regression fit- ting and stepwise method. The MI-QSAR models were then evaluated by a test set of 8 compounds. Similarly, MDR ratio of compounds in vitro in P388/ VDR cell lines acted as the dependent variable. With the aid of Virtual Computational Chemistry Laboratory soft- ware (http://vcclab.org) [20], some QSAR models were constructed by PLSR (Eq.6, Figure 2 down). Table 6 shows the calculated descriptors mentioned above and OPEN ACCESS 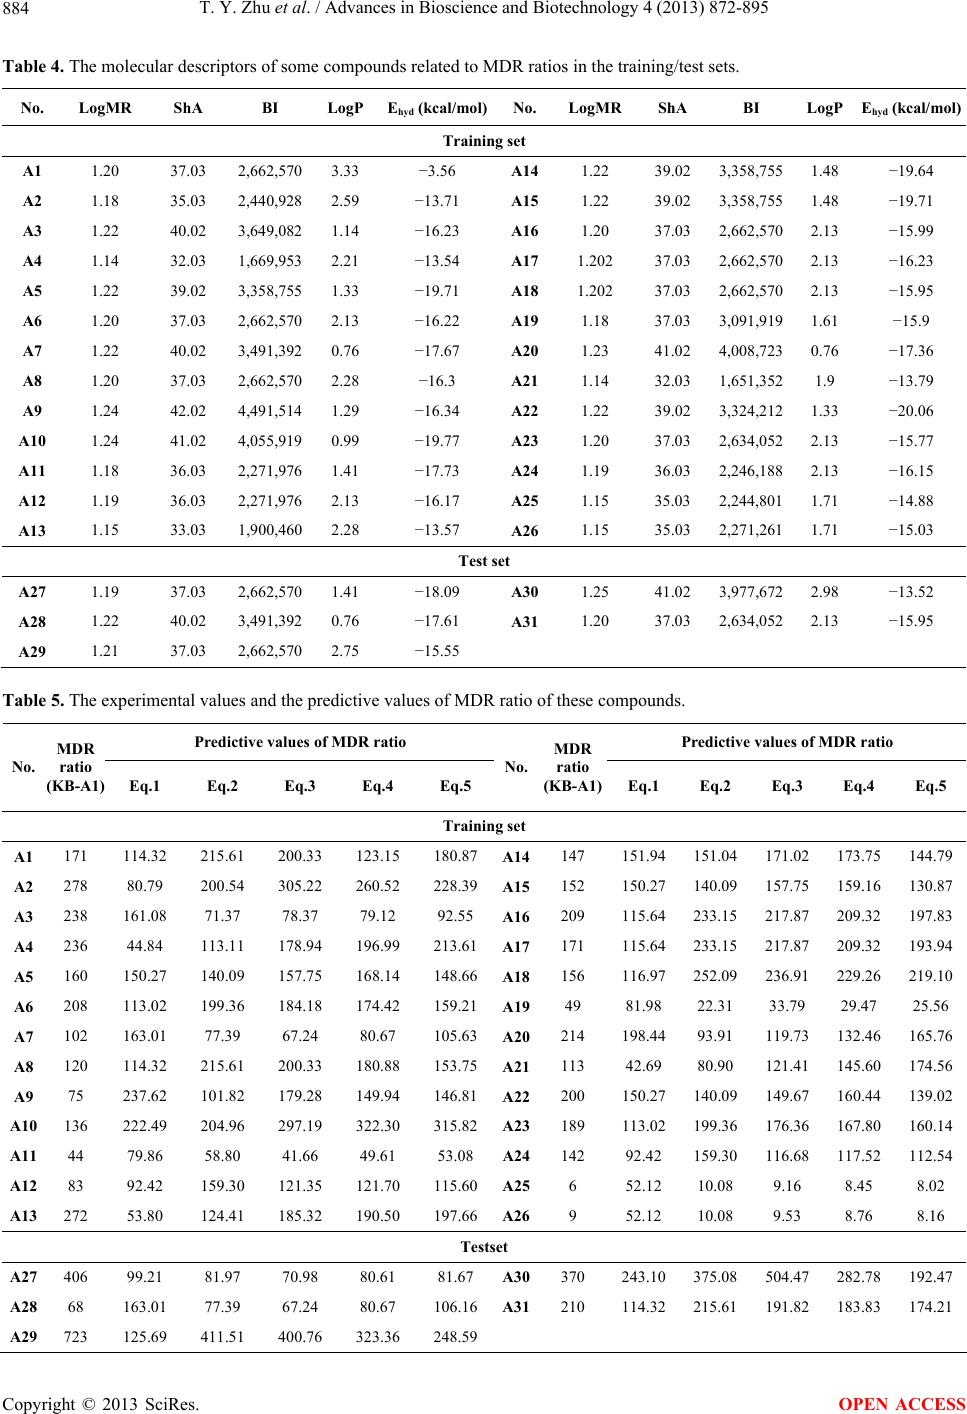 T. Y. Zhu et al. / Advances in Bioscience and Biotechnology 4 (2013) 872-895 884 Table 4. The molecular descriptors of some compounds related to MDR ratios in the training/test sets. No. LogMR ShA BI LogP Ehyd (kcal/mol)No. LogMRShA BI LogP Ehyd (kcal/mol) Training set A1 1.20 37.03 2,662,570 3.33 −3.56 A14 1.22 39.02 3,358,755 1.48 −19.64 A2 1.18 35.03 2,440,928 2.59 −13.71 A15 1.22 39.02 3,358,755 1.48 −19.71 A3 1.22 40.02 3,649,082 1.14 −16.23 A16 1.20 37.03 2,662,570 2.13 −15.99 A4 1.14 32.03 1,669,953 2.21 −13.54 A17 1.202 37.03 2,662,570 2.13 −16.23 A5 1.22 39.02 3,358,755 1.33 −19.71 A18 1.202 37.03 2,662,570 2.13 −15.95 A6 1.20 37.03 2,662,570 2.13 −16.22 A19 1.18 37.03 3,091,919 1.61 −15.9 A7 1.22 40.02 3,491,392 0.76 −17.67 A20 1.23 41.02 4,008,723 0.76 −17.36 A8 1.20 37.03 2,662,570 2.28 −16.3 A21 1.14 32.03 1,651,352 1.9 −13.79 A9 1.24 42.02 4,491,514 1.29 −16.34 A22 1.22 39.02 3,324,212 1.33 −20.06 A10 1.24 41.02 4,055,919 0.99 −19.77 A23 1.20 37.03 2,634,052 2.13 −15.77 A11 1.18 36.03 2,271,976 1.41 −17.73 A24 1.19 36.03 2,246,188 2.13 −16.15 A12 1.19 36.03 2,271,976 2.13 −16.17 A25 1.15 35.03 2,244,801 1.71 −14.88 A13 1.15 33.03 1,900,460 2.28 −13.57 A26 1.15 35.03 2,271,261 1.71 −15.03 Test set A27 1.19 37.03 2,662,570 1.41 −18.09 A30 1.25 41.02 3,977,672 2.98 −13.52 A28 1.22 40.02 3,491,392 0.76 −17.61 A31 1.20 37.03 2,634,052 2.13 −15.95 A29 1.21 37.03 2,662,570 2.75 −15.55 Table 5. The experimental values and the predictive values of MDR ratio of these compounds. Predictive values of MDR ratio Predictive values of MDR ratio No. MDR ratio (KB-A1) Eq.1 Eq.2 Eq.3 Eq.4 Eq.5 No. MDR ratio (KB-A1) Eq.1 Eq.2 Eq.3 Eq.4 Eq.5 Training set A1 171 114.32 215.61 200.33 123.15 180.87 A14 147 151.94151.04 171.02 173.75144.79 A2 278 80.79 200.54 305.22 260.52 228.39 A15 152 150.27140.09 157.75 159.16130.87 A3 238 161.08 71.37 78.37 79.12 92.55 A16 209 115.64233.15 217.87 209.32197.83 A4 236 44.84 113.11 178.94 196.99 213.61 A17 171 115.64233.15 217.87 209.32193.94 A5 160 150.27 140.09 157.75 168.14 148.66 A18 156 116.97252.09 236.91 229.26219.10 A6 208 113.02 199.36 184.18 174.42 159.21 A19 49 81.98 22.31 33.79 29.47 25.56 A7 102 163.01 77.39 67.24 80.67 105.63 A20 214 198.4493.91 119.73 132.46165.76 A8 120 114.32 215.61 200.33 180.88 153.75 A21 113 42.69 80.90 121.41 145.60174.56 A9 75 237.62 101.82 179.28 149.94 146.81 A22 200 150.27140.09 149.67 160.44139.02 A10 136 222.49 204.96 297.19 322.30 315.82 A23 189 113.02199.36 176.36 167.80160.14 A11 44 79.86 58.80 41.66 49.61 53.08 A24 142 92.42 159.30 116.68 117.52112.54 A12 83 92.42 159.30 121.35 121.70 115.60 A25 6 52.12 10.08 9.16 8.45 8.02 A13 272 53.80 124.41 185.32 190.50 197.66 A26 9 52.12 10.08 9.53 8.76 8.16 Testset A27 406 99.21 81.97 70.98 80.61 81.67 A30 370 243.10375.08 504.47 282.78192.47 A28 68 163.01 77.39 67.24 80.67 106.16 A31 210 114.32215.61 191.82 183.83174.21 A29 723 125.69 411.51 400.76 323.36 248.59 Copyright © 2013 SciRes. OPEN ACCESS 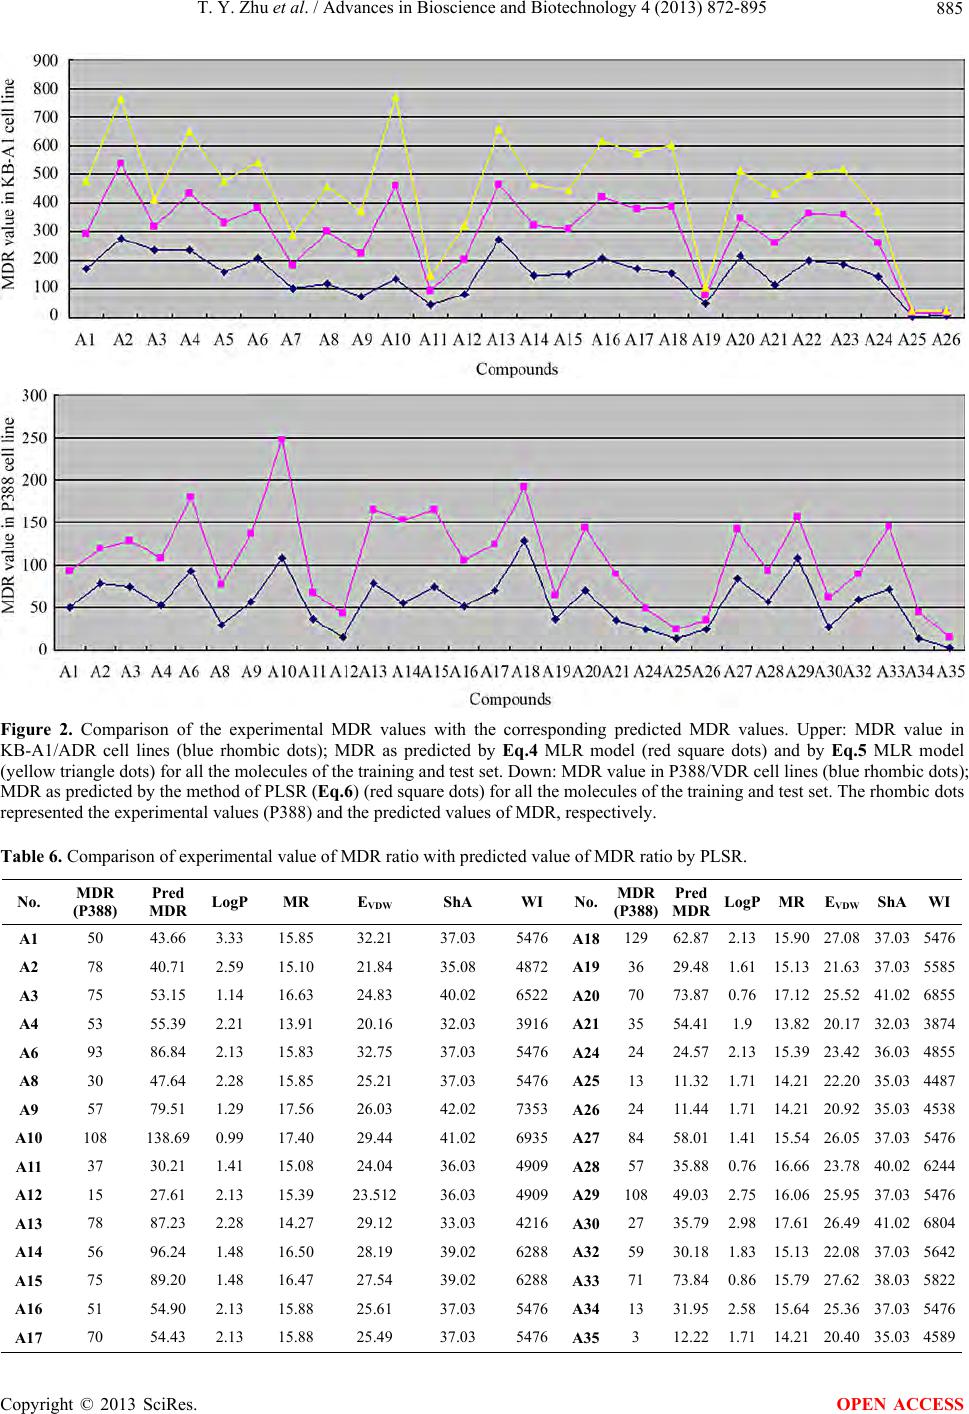 T. Y. Zhu et al. / Advances in Bioscience and Biotechnology 4 (2013) 872-895 885 Figure 2. Comparison of the experimental MDR values with the corresponding predicted MDR values. Upper: MDR value in KB-A1/ADR cell lines (blue rhombic dots); MDR as predicted by Eq.4 MLR model (red square dots) and by Eq.5 MLR model (yellow triangle dots) for all the molecules of the training and test set. Down: MDR value in P388/VDR cell lines (blue rhombic dots); MDR as predicted by the method of PLSR (Eq.6) (red square dots) for all the molecules of the training and test set. The rhombic dots represented the experimental values (P388) and the predicted values of MDR, respectively. Table 6. Comparison of experimental value of MDR ratio with predicted value of MDR ratio by PLSR. No. MDR (P388) Pred MDR LogPMR EVDW ShA WI No.MDR (P388) Pred MDR LogP MR EVDW ShA WI A1 50 43.66 3.3315.85 32.21 37.03 5476 A18 129 62.872.13 15.90 27.08 37.035476 A2 78 40.71 2.5915.10 21.84 35.08 4872 A19 36 29.481.61 15.13 21.63 37.035585 A3 75 53.15 1.1416.63 24.83 40.02 6522 A20 70 73.870.76 17.12 25.52 41.026855 A4 53 55.39 2.2113.91 20.16 32.03 3916 A21 35 54.411.9 13.82 20.17 32.033874 A6 93 86.84 2.1315.83 32.75 37.03 5476 A24 24 24.572.13 15.39 23.42 36.034855 A8 30 47.64 2.2815.85 25.21 37.03 5476 A25 13 11.321.71 14.21 22.20 35.034487 A9 57 79.51 1.2917.56 26.03 42.02 7353 A26 24 11.441.71 14.21 20.92 35.034538 A10 108 138.69 0.9917.40 29.44 41.02 6935 A27 84 58.011.41 15.54 26.05 37.035476 A11 37 30.21 1.4115.08 24.04 36.03 4909 A28 57 35.880.76 16.66 23.78 40.026244 A12 15 27.61 2.1315.39 23.512 36.03 4909 A29 108 49.032.75 16.06 25.95 37.035476 A13 78 87.23 2.2814.27 29.12 33.03 4216 A30 27 35.792.98 17.61 26.49 41.026804 A14 56 96.24 1.4816.50 28.19 39.02 6288 A32 59 30.181.83 15.13 22.08 37.035642 A15 75 89.20 1.4816.47 27.54 39.02 6288 A33 71 73.840.86 15.79 27.62 38.035822 A16 51 54.90 2.1315.88 25.61 37.03 5476 A34 13 31.952.58 15.64 25.36 37.035476 A17 70 54.43 2.1315.88 25.49 37.03 5476 A35 3 12.221.71 14.21 20.40 35.034589 Copyright © 2013 SciRes. OPEN ACCESS 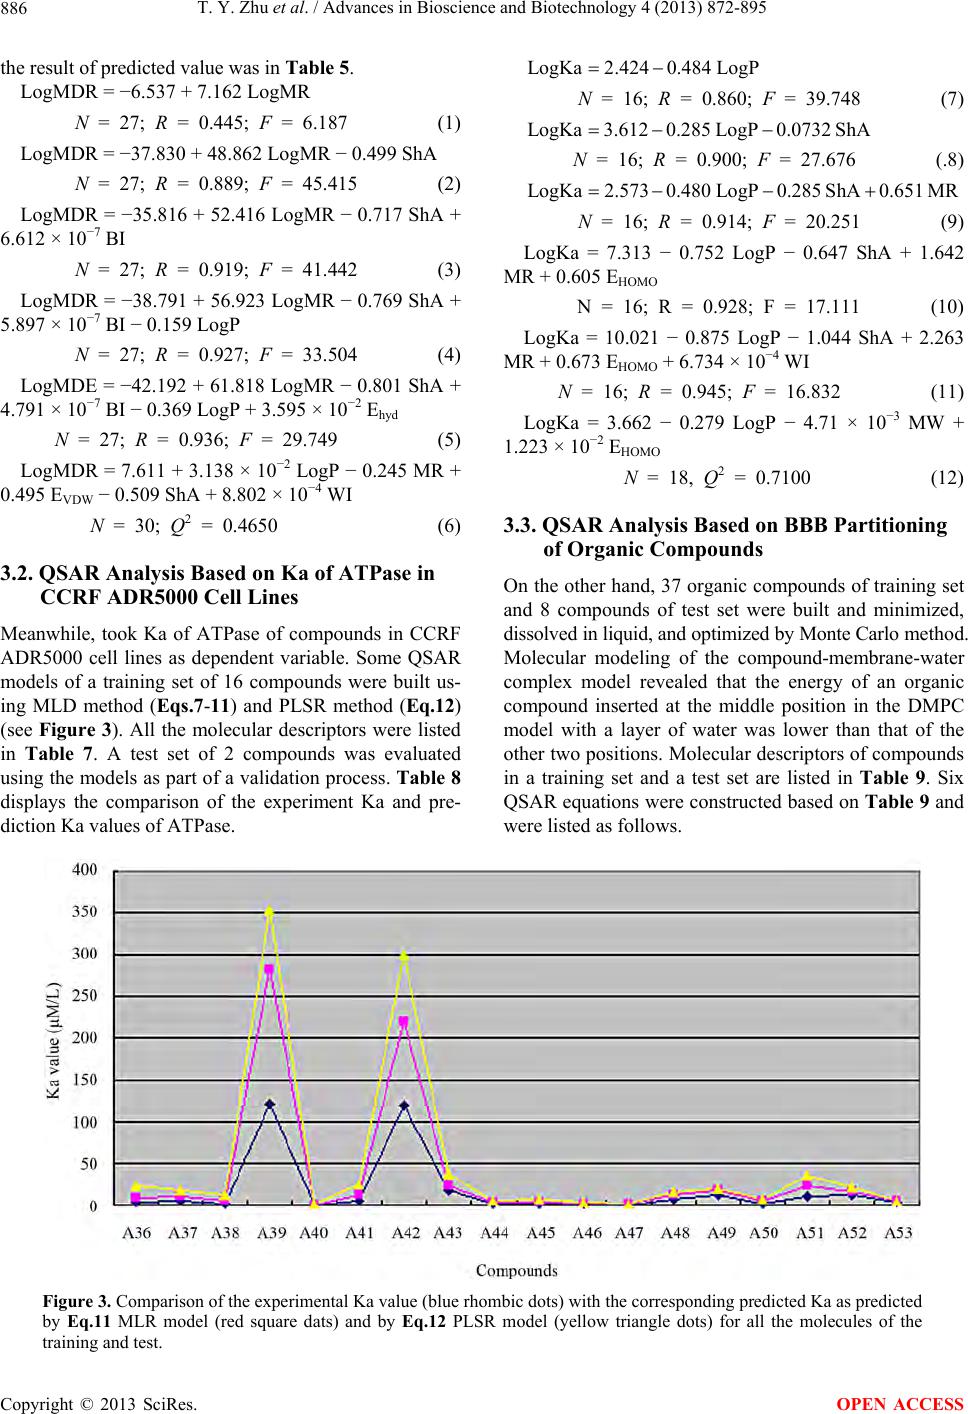 T. Y. Zhu et al. / Advances in Bioscience and Biotechnology 4 (2013) 872-895 Copyright © 2013 SciRes. 886 the result of predicted value was in Table 5. LogKa2.4240.484 LogP LogMDR = −6.537 + 7. 16 2 LogMR N = 16; R = 0.860; F = 39.748 (7) N = 27; R = 0.445; F = 6.187 (1) LogKa3.6120.285 LogP0.0732ShA LogMDR = −37.830 + 48.862 LogMR − 0.499 ShA N = 16; R = 0.900; F = 27.676 (.8) N = 27; R = 0.889; F = 45.415 (2) LogKa2.5730.480 LogP0.285 ShA0.651 MR LogMDR = −35.816 + 52.416 LogMR − 0.717 ShA + 6.612 × 10⁻⁷ BI N = 16; R = 0.914; F = 20.251 (9) LogKa = 7.313 − 0.752 LogP − 0.647 ShA + 1.642 MR + 0.605 EHOMO N = 27; R = 0.919; F = 41.442 (3) LogMDR = −38.791 + 56.923 LogMR − 0.769 ShA + 5.897 × 10⁻⁷ BI − 0.159 LogP N = 16; R = 0.928; F = 17.111 (10) LogKa = 10.021 − 0.875 LogP − 1.044 ShA + 2.263 MR + 0.673 EHOMO + 6.734 × 10⁻⁴ WI N = 27; R = 0.927; F = 33.504 (4) LogMDE = −42.192 + 61.818 LogMR − 0.801 ShA + 4.791 × 10⁻⁷ BI − 0.369 LogP + 3.595 × 10⁻² Ehyd N = 16; R = 0.945; F = 16.832 (11) LogKa = 3.662 − 0.279 LogP − 4.71 × 10⁻³ MW + 1.223 × 10⁻² EHOMO N = 27; R = 0.936; F = 29.749 (5) LogMDR = 7.611 + 3.138 × 10⁻² LogP − 0.245 MR + 0.495 EVDW − 0.509 ShA + 8.802 × 10⁻⁴ WI N = 18, Q2 = 0.7100 (12) 3.3. QSAR Analysis Based on BBB Partitioning of Organic Compounds N = 30; Q2 = 0.4650 (6) 3.2. QSAR Analysis Based on Ka of ATPase in CCRF ADR5000 Cell Lines On the other hand, 37 organic compounds of training set and 8 compounds of test set were built and minimized, dissolved in liquid, and optimized by Monte Carlo meth od. Molecular modeling of the compound-membrane-water complex model revealed that the energy of an organic compound inserted at the middle position in the DMPC model with a layer of water was lower than that of the other two positions. Molecular descriptor s of compounds in a training set and a test set are listed in Table 9. Six QSAR equations were constructed based on Table 9 and were listed as follows. Meanwhile, took Ka of ATPase of compounds in CCRF ADR5000 cell lines as dependent variable. Some QSAR models of a training set of 16 compounds were built us- ing MLD method (Eqs.7-11) and PLSR method (Eq.12) (see Figure 3). All the molecular descriptors were listed in Table 7. A test set of 2 compounds was evaluated using the models as part of a validation process. Table 8 displays the comparison of the experiment Ka and pre- diction Ka va lues of ATP as e. Figure 3. Comparison of the experimental Ka value (blue rhombic dots) with the corresponding predicted Ka as predicted by Eq.11 MLR model (red square dats) and by Eq.12 PLSR model (yellow triangle dots) for all the molecules of the training and test. OPEN ACCESS  T. Y. Zhu et al. / Advances in Bioscience and Biotechnology 4 (2013) 872-895 887 Table 7. The molecular descriptors of some compounds related to ATPase in the training/test sets. No. LogP ShA MR EHOMO (eV)WI MW No.LogPShAMR EHOMO (eV) WI MW A36 3.39 21.04 9.254 −9.14 1366 312.41A45 4.3 26.0411.42 −9.17 2345383.53 A37 3.62 24.04 10.55 −9.20 1949 355.48A46 4.93 32.03 13.27 −8.24 4689462.57 A38 3.67 25.04 10.84 −9.16 2172 367.49A47 5.2 32.0313.38 −8.19 4329464.58 A39 1.42 18.05 7.86 −9.12 920 277.37A48 4.25 26.04 11.45 −9.24 2607383.53 A40 4.93 32.03 13.27 −8.16 4329 462.57A49 4.52 26.04 11.59 −8.94 2367385.55 A41 2.67 25.04 10.29 −8.15 2244 372.44A50 4.88 27.03 12.06 −8.94 2550399.58 A42 0.94 19.05 8.01 −9.15 1050 293.37A51 2.38 26.04 10.99 −9.09 2400383.49 A43 2.54 25.04 10.52 −9.20 2172 369.46A52 3.94 25.04 10.95 −9.05 2172369.51 A44 3.98 32.03 13.50 −9.16 4227 459.59A53 4.93 32.03 13.27 −8.19 4509462.57 Table 8. Comparison the experimental values with the predictiv e v alue s of Ka of these compounds. Predictive values of Ka Predictive values of Ka No. Ka (μM/L) Eq.7 Eq.8 Eq.9 Eq.10 Eq.11Eq.12No. Ka (μM/L)Eq.7 Eq.8 Eq.9 Eq.10 Eq.11Eq.12 A36 3.34 6.07 12.75 9.37 6.43 6.14 13.57A45 1.532.20 3.02 3.32 2.69 2.08 3.50 A37 5.30 4.70 6.62 7.10 6.19 5.60 7.33 A46 1.471.09 0.73 0.52 0.48 0.81 1.02 A38 2.59 4.44 5.41 5.36 3.98 3.06 6.24 A47 0.550.81 0.61 0.46 0.50 0.53 0.84 A39 122 54.54 76.92 73.09 90.64 160.46 70.37A48 7.642.33 3.13 3.83 3.33 4.22 3.60 A40 0.36 1.09 0.73 0.52 0.53 0.51 1.02 A49 12.201.72 2.62 3.39 4.98 5.00 2.99 A41 6.13 13.54 10.43 7.17 11.79 7.23 11.56A50 2.261.15 1.75 2.37 3.50 3.28 2.04 A42 120.00 93.12 89.09 81.21 80.47 99.3780.44A51 10.5018.71 10.66 14.57 16.6 13.2012.02 A43 18.50 15.65 11.36 11.73 8.26 5.56 12.59A52 12.803.29 4.53 4.74 4.57 3.91 5.15 A44 1.01 3.15 1.36 2.10 1.66 2.13 1.88 A53 4.151.09 0.73 0.52 0.51 0.65 1.02 Table 9. The molecular descriptors of the compounds related to BBB in the training/test sets. No PSA (Å2) ClogP BI (Å) Estretch (Kcal/mol)Etotala (Kcal/mol)Etorsiona (Kcal/mol)ΔEtotalb (Kcal/mol) ΔEtorsionb (Kcal/mol) Training set B1 78.90 1.20 12378 −1.35503 −298.2972 −1713.1146 42.46 11.30 B2 94.00 1.99 1101758 −0.15595 −406.0803 −1789.8084 −65.32 −65.39 B3 73.00 3.80 1738650 −1.48472 −256.3021 −1703.1425 84.46 21.27 B4 87.00 1.63 1346396 −1.39112 −302.7543 −1841.5635 38.00 −117.15 B5 39.00 1.02 41807 0.58131 −226.3773 −1734.7452 114.38 −10.33 B6 26.80 3.23 305770 −0.09264 −228.2923 −1679.4604 112.47 44.96 B7 88.80 1.01 58510 0.71038 −279.0781 −1671.3414 61.68 53.07 B8 76.60 2.80 62216 −0.38334 −309.2981 −1654.6730 31.46 69.74 B9 104.40 1.77 83798 −0.35599 −313.4237 −1639.9898 27.34 84.43 B10 108.80 2.00 193593 −0.52172 −548.5593 −1640.9214 −207.80 83.49 B11 47.90 2.51 352512 −0.09496 −312.1226 −1656.7465 28.64 67.67 B12 45.20 4.27 779210 0.00479 −163.8011 −1716.3101 176.96 8.11 B13 38.50 2.61 158640 −0.09491 −170.3338 −1716.7159 170.43 7.70 B14 40.00 4.28 431722 −1.30506 −247.0951 −1748.0241 93.66 −23.61 B15 39.20 5.88 766256 0.09911 −289.2825 −1735.4004 51.48 −10.98 B16 54.90 5.14 766256 −0.14215 −181.0636 −1743.6068 159.70 −19.19 B17 18.80 0.62 20863 0.18071 −331.7044 −1695.6999 9.05 28.72 Copyright © 2013 SciRes. OPEN ACCESS  T. Y. Zhu et al. / Advances in Bioscience and Biotechnology 4 (2013) 872-895 Copyright © 2013 SciRes. 888 Continued B18 46.70 0.27 20264 −1.36843 −209.4697 −1644.6752 131.29 79.74 B19 44.10 2.80 190375 −2.97778 −311.9182 −1713.8942 28.84 10.52 B20 5.40 4.85 210631 −0.06079 −235.7250 −1704.3399 105.03 20.08 B21 0.00 −0.47 4 0.00000 −407.3194 −1729.3793 −66.56 −4.96 B22 0.00 2.14 972 −0.00009 −239.8807 −1675.1827 100.88 49.23 B23 23.40 0.07 213 0.00000 −160.1278 −1672.3898 180.63 52.03 B24 22.60 0.69 712 0.00000 −319.0674 −1742.6968 21.69 −18.28 B25 0.00 3.74 1899 0.00067 −282.3721 −1751.6193 58.39 −27.20 B26 0.00 3.61 1661 0.00000 −285.7132 −1731.9518 55.05 −7.54 B27 0.00 1.43 1661 −0.00008 −238.7249 −1731.3090 102.03 −6.89 B28 0.00 2.48 633 0.00003 −291.5583 −1725.7370 49.20 −1.32 B29 11.60 2.46 21380 −0.00005 −418.0323 −1682.7138 −77.27 41.70 B30 24.40 −0.24 47 0.00000 −329.3150 −1704.6187 11.44 19.80 B31 10.70 1.27 7864 −0.00002 −253.3453 −1747.7044 87.41 −23.29 B32 0.00 2.37 7322 −0.00003 −268.8335 −1714.2486 71.93 10.17 B33 0.00 3.31 931 0.02567 −353.8395 −1739.7672 −13.08 −15.35 B34 24.40 −0.24 47 0.00000 −187.4520 −1720.5500 153.31 3.87 B35 0.00 1.93 7322 −0.00003 −177.4875 −1728.8621 163.27 −4.45 B36 0.00 2.64 2050 −0.02344 −220.3940 −1681.1548 120.36 43.26 B37 0.00 2.63 712 −0.00002 −231.5752 −1722.2582 109.18 2.16 Test set T1 22.70 0.321 712 0.00000 −274.7201 −1713.7409 66.04 10.68 T2 0.00 3.738 1838 0.00000 −225.6308 −1716.6234 115.13 7.79 T3 0.00 4.267 4150 0.00000 −331.3754 −1700.6397 9.38 23.78 T4 11.30 0.870 791 0.00000 −181.5954 −1700.8447 159.16 23.57 T5 0.00 4.397 4650 0.00000 −404.2903 −1741.2420 −63.53 −16.83 T6 0.00 1.103 0 0.00000 −282.9386 −1746.1889 57.82 −21.77 T7 0.00 3.339 791 0.00063 −271.9174 −1681.9440 68.84 42.47 T8 22.70 −0.208 213 0.00000 −364.8884 −1695.3605 −24.13 29.06 Note: aEtotal and Etorsion mean the t otal e nergy and the tors ion energ y of the co mpound- DMPC-water co mplex; bΔEtotal and ΔEtorsion ar e the res idues between t he compound-DMPC-water complex and the DM PC-water complex. n = 37 R = 0.947 S = 0.248 (17) 2 logBB0.5521.73 10PSA LogBB = 8.730 × 10⁻² − 1.04 × 10⁻² PSA + 0.222 ClogP − 9.60 × 10⁻⁷ BI − 0.183 Estretch + 1.364 × 10⁻³ ΔEtotal − 2.68 × 10⁻³ ΔEtorsion n = 37 R = 0.835 S = 0.398 (13) 2 logBB0.2291.70 10PSA0.131ClogP n = 37 R = 0.878 S = 0.352 (14) n = 37 R = 0.955 S = 0.232 (18) logBB = 4.965 × 10⁻² − 1.28 × 10⁻² PSA + 0.211 ClogP − 6.40 × 10⁻⁷ BI Here, n means the number of compounds in a training set, R means the correlative coefficient, and S means the standard residual error. LogBB = log(Cbrain/Cblood). PSA means the total polar surface area of a molecule. CLogP and BI display calculated LogP and connective index of molecular average total distance (relative covalent ra- dius), respectively. They come from CS calcul at i on. ΔEtotal and ΔEtorsion are related to interaction between a com- pound and the membrane-water model. The total energy n = 37 R = 0.924 S = 0.285 (15) LogBB = 6.262 × 10⁻² − 1.36 × 10⁻² PSA + 0.205 ClogP − 7.11 × 10⁻⁷ BI − 0.185 Estretch n = 37 R = 0.938 S = 0.264 (16) LogBB = 6.580 × 10⁻² − 1.21 × 10⁻² PSA + 0.206 ClogP − 7.77 × 10⁻⁷ BI − 0.197 Estretch + 1.330 × 10⁻³ ΔEtotal OPEN ACCESS  T. Y. Zhu et al. / Advances in Bioscience and Biotechnology 4 (2013) 872-895 889 and the torsion energy of the membrane-water complex are −340.7589 and −1724.4164 (Kcal/mol), respectively. ΔEtotal is the change in the total potential energy of the solute-membrane-water complex comparing with that of the membrane-water model and so is ΔEtorsion. With the increase of the independent variable, the rela- tivity of QSAR model was also improved an d its predic- tive ability was enhanced. The most significant Eq.18 displayed that the capability of a compound through BBB was directly proportional to ClogP and ΔEtotal, but inversely proportional to PSA, BI, Estretch, and ΔEtorsion. Figure 4 showed the comparison of the experimental logBB with the corresponding predicted logBB of the molecules in the training set based on Eqs.17 and 18 models (see Table 10). Compound B18 was predicted with a higher logBB than observed, supported by the result of Iyer et al. [ 35]. The test set of 8 compounds to span almost the entire range in BBB partitioning was selected for validation of the QSAR models mentioned above. The observed and predicted logBB values for this test set were given in Table 10 and plotted in Figure 4 (right). It seemed to suggest that Eqs.17 and 18 models could predict logBB for other compounds in drug design. 4. DISCUSSION Some predictive models of MDR, Ka and BBB parti- tioning of organic compounds were built by simulating the interaction between modulators or drugs and P-gp and/or the interreaction of the organic compound with the phospholipide-rich regions of cellular membranes. We have constructed theoretical models of the interac- tion between org anic compounds and P-gp and comp o u nd s with the affinity for and simulation of the P-gp ATPase. On one hand, the interaction between compounds and P-gp (P-gp binding or MDR-reversal activity of com- pounds) is found to depend on LogP, LogMR, and ShA of compounds it transports, which proportional to Log MR whereas inversely proportional to LogP and ShA (see Eqs.1-5). Moreover, modulators or drugs interacting with P-gp and thus reducing the efflux of the cytotoxic compounds would increase the apparent toxicity of the cytotoxic compounds, which might account for more than one mechanism of action in the resistant cells used. There were many uncertainty factors in the MDR ratio assay method which was convinced by our linear Figure 4. Comparison of the experimental logBB values (blue rhombic dots) for all the molecules of the training sets (upper) or the test set (down) to the corresponding predicted logBB as predicted by Eq.17 MI-QSAR model (red square dots) and by Eq.18 MI-QSAR model (yellow triangle dots). Copyright © 2013 SciRes. OPEN ACCESS  T. Y. Zhu et al. / Advances in Bioscience and Biotechnology 4 (2013) 872-895 890 Table 10. The experimental values and the predictive values of Log BB of these compounds. Copyright © 2013 SciRes. OPEN ACCESS  T. Y. Zhu et al. / Advances in Bioscience and Biotechnology 4 (2013) 872-895 Copyright © 2013 SciRes. 891 OPEN ACCESS regression models. Our research results using two dif- ferent statistic methods, MLR and PLSR, have revealed that the QSAR equation was also improved and the pre- dictive ability of the models was enhanced with the in- crease of the variable. Eq.5 was built on KB-A1 cell line with a cytotoxic compound of 2.5 μM ADR while Eq.6 was based on P38 8/VDR-20 cell line with 1.5 μM VCR. Here, most of the models gave satisfactory cross-vali- dated Q2 above 0.500, conventional R above 0.800 and less SE values, indicating their proper predictive ability. Significant differences between values were examined using two-tailed paired T test provided by SPSS. All the results were considered not significant if P < 0.05. Eq.5 model was the most significant and indicated that the potential of P-gp modulators interacted with P-gp de- pended upon MR, BI, Ehyd, ShA, and LogP. The former three displayed positive contributions to the MDR activ- ity of P-gp, suggesting that the MDR activity increased accordingly with the increase of MR. The latter two dis- played negative contribution to the MDR activity of P-gp. On the other hand, our bu ilt models for Ka o f ATPase based on the analogies of purine and propafenone ana- logs suggested that the enzyme hydrolysis of these com- pounds largely depended on LogP, MR, ShA, MW and EHOMO, especially positive related to MR but negative to LogP and ShA (see Eqs.7 to 11). Both models, Eq.11 by MLR and Eq.12 by PLSR, pointed out that EHOMO, posi- tive related with the activity of P-gp ATPase, was an important parameter for the compound stimulated AT- Pase activity with high affinity, whereas another LogP was negative related with the activity of P-gp ATPase. Figure 3 showed that molecular A39 and A42 with higher Ka value of ATPase were depart from other compounds. This may be because they have lower lipo- philicity, which is supported by the research results of Diethart Schmid et al. [31]. The results above showed that the P-gp binding capacity of these compounds shares common characteristics with their ATPase hydrolysis, namely their hydrophobic parameters (such as logP) and steric parameters (e.g. MW, ShA, and MR). In another aspect, our MI-QSAR models indicated that the distribution of organic molecules through BBB was not only influenced by organic solutes themselves, but also related to the properties of the solute-membrane- water complex, namely interactions of the mo lecule with the phospholipide-rich regions of cellular membranes. The QSAR model, especially Eq.18 most significant, revealed that the capability of BBB partitioning of an organic compound focused on six significant features. Obviously, two descriptors, ClogP and ΔEtotal, had posi- tive regression coefficients and the other four descriptors, PSA, BI, Estretch, and ΔEtorsion, had negative regression coefficients. Moreover, PSA descriptor was found as a dominant descriptor in these QSAR models, which was related to the aqueous solubility of the solute compound along with a direct lipophilicity descriptor. When the value of PSA of a molecule lessened within the range from 0 to 108.80 Å2, its value of LogBB would increase. This was consistent with the experimental results that the more polarity it possessed, the more difficultly a mole- cule entered the hydrophobic environment of BBB [38]. BI as the connective index of molecular average total distance pertained to the volume parameter. Our research result showed that a molecule more and more difficultly acrossed through BBB by diffusion with the addition of its bulk. However, the value of LogBB of a molecule increased with the increase of ClogP. It meaned that the hydrophobic molecule could pass through BBB more easily than the hydrophilic molecule does. The presence of Estretch descriptor suggested that with the decrease of the stretch-bend energy of a molecule, its value of LogBB increased. Two of the descriptors, ΔEtotal and ΔEtorsion, found in the logBB QSAR models (Eqs.17 and 18), reflected the behavior of the solutes in the mem- brane and the entire membrane-solute complex. Along with the meaning mentioned, ΔEtotal was equivalent to the change in the average total potential energy between the ternary complex of solute-membrane-water and the binary complex of membrane-water. Similarly, ΔEtorsion was the difference between the dihedral torsion energy of the ternary complex and that of the binary complex. Here, the more the change value of ΔEtotal was, the more its value of LogBB increased. This may be because small molecules across BBB membrane could lead to the change of the complex structure. The more changeability of the structure resulted in greater change of the total potential energy, while the addition of the energy change could be the important cause of the increase of the capability of a small molecule through BBB. On the contrary, the less the difference of the torsion energy was, the larger its LogBB value was. It displayed that a small molecule tight combined with the membrane-water complex could lead to the increase of its LogBB. Moreover, the rela- tionship would suggest that the solute became more flex ible with in the memb rane-wa ter compl ex, which wo u l d possess the greater logBB value, in agreement with the research results of Iyer M et al. [35]. Furthermore, BBB partitioning was mainly found to depend upon two pa- rameters, namely PSA and ClogP, where the ability of organic molecules permeating across BBB was directly proportional to LogP but inversely proportional to PSA (see Eqs.13-18), which was consistent with the research results of Chen and co-worker [2], namely the increasing PSA decreased LogBB rapidly while LogP was positively related to LogBB. It indicated that molecul es w ith h igher lipophilic would be partitioned into the lipid bilayer more easily with more chances to penetrate BBB, sup-  T. Y. Zhu et al. / Advances in Bioscience and Biotechnology 4 (2013) 872-895 892 ported by the research result of Wang et al., namely a large number of structurally and functionally diverse compounds as substrates or modulators of P-gp mostly sharing common structural features, such as aromatic ring structures and high lipophilicity [19]. PSA of CNS active drug should be lower than 90 Å2 [2], while the penetration through the BBB is optimal for LogP value in the range 1.5 - 2.7 (Norinder & Haeberlein, 2002). In addition, several non-MI-QSAR computational mo d- els to describe and predict BBB partitioning have been reported that includes other descriptors besides PSA and ClogP [39]. An alternative, complementary approach to BBB partitioning prediction uses MI-QSAR analysis de- veloped by Iyer M et al. [35]. Their research results showed that BBB partitioning of an organic compound depended upon PSA, CLogP, and the conformational flexibility of the compounds as well as the strength of their “binding” to the model biologic membrane. The MI-QSAR models indicated that BBB partitioning proc- ess could be reliably described for structurally diverse molecules and provided interaction s of the molecule with the phospholipide-rich regions of cellular membranes. An extension of these approaches that combined QSAR with solute-membrane-water complex had been devel- oped by us, which was addition of a layer of water on the hydrophilic side of DMPC monolayer membrane in order to simulate the truth BBB environment. Our results re- vealed that the distribution of organic molecules through BBB was not only influenced by the properties of or- ganic solutes, but also related to the property of the sol- ute-membrane-water complex. The former involved the polarity, hydrophobic, size, and conformational freedom degree of organic molecules, while the latter dealt with the strength of an organic molecule combined with BBB membrane and the structural changeability of a solute- membrane-water complex. Furthermore, the capability of a small molecule across BBB was mainly related to four physicochemical factors, which depended on the relative polarity of a small molecule (namely PSA and ClogP), the molecular volume (i.e. BI), the strength of a small molecule combined with DMPC-water model (viz. ΔEtorsion), and the changeability of the structure of a sol- ute-membrane-water complex (scilicent ΔEtotal). The QSAR model showed that the less polarity and more hydropho- bic molecules relatively easily passed through BBB and entered brain to cure. The reason for the change of the total energy was that small molecules across BBB mem- brane caused the structural change of the solute-mem- brane-water complex. The more the changeability of the complex structure was, the more the change value of its total energy was, and the more easily a small molecule penetrated BBB. In particular, cerebral clearance of Aβ was considered to occur via elimination across BBB, as well as prote- olytic degradation. Attenuation of its elimination was likely to result in the increase of cerebral Aβ deposition, which may facilitate progression of AD [40]. P-gp de- toxified cells by exporting hundreds of chemically unre- lated toxins but had been implicated in MDR in the treatment of cancers. Substrate promiscuity was a hall- mark of P-gp activity, thus a structural description of poly-specific drug-binding was important for the rational design of anti-amyloid accumulation drugs, anticancer drugs and MDR inhibitors. The x-ray structure of apo P-gp at 3.8 angstroms revealed an internal cavity of ap- proximately 6000 Å3 with a 30 Å separation of the two nucleotide-binding domains. Two additional P-gp struc- tures with cyclic peptide inhibitors demonstrated distinct drug-binding sites in the internal cavity capable of ster eo- selectivity that was based on hydrophobic and aromatic interactions. Apo and drug-bound P-gp structures had portals open to the cytoplasm and the inner leaflet of the lipid bilayer for drug entry. The inward-facing confor- mation represented an initial stage of the transport cycle that was competent for drug binding [41]. Currently, P-gp was identificated as an energy-dependent pump, whereas ATPase activity as an assay in itself was possi- bly problematical because the assay was based upon one assumption that drug-induced ATP hydrolysis reflects transport by the transporter [16]. There may be many ways in which this activity could be altered, including direct action on the ATP binding domain. Scientists once observed some compounds such as daunomycin and vin- blastine inhibit ATPase activity, but increase in others, suggesting that modulation of ATPase activity was highly dependent on experimental conditions and may not correlate well with the ab ility of P-gp to transp ort the drug [42-44]. The work of Litman et al. was one of the few studies suggesting that affinity between drugs and ATPase activity has no correlation to LogP, but Surface Area [45]. Because of the less comparability of molecu- lar structures in a training set, our QSAR model pos- sessed more universal significance. However, the preci- sion of the QSAR models was so low that there was still a distance to its application. So a series of organic com- pounds with similar structures are chosen and consist of a training set, thus the precision of QSAR simulation will be largely increased, while the prediction of the ana- logues through BBB will be greatly improved. 5. CONCLUSIONS The pa thogenesis of AD is c haracterized by the aggrega- tion of Aβ into neurotoxic plaques. P-gp is involved in MDR and in neurodegenerative disorders such as PD, AD and epilepsy. P-gp mediates the efflux of Aβ from the brain as well as mediates MDR, while P-gp trans- ports neutral or positively-charged hydrophobic sub- Copyright © 2013 SciRes. OPEN ACCESS  T. Y. Zhu et al. / Advances in Bioscience and Biotechnology 4 (2013) 872-895 893 strates with consuming energy from ATP hydrolysis. In comparison with the ability of organic molecules perme- ating across BBB, P-gp binding or MDR-reversal activ- ity of compounds has a negative correlation with LogP. Moreover, P-gp binding or MDR-reversal activity of compounds is main ly pr opo rtio nal t o Log MR (Eqs.1 to 5) but inversely proportional to LogP (Eqs.4 and 5). Simi- larly, ATPase activity of these compounds was largely negatively related to LogP (Eqs.7 to 12) but positively related to MR (Eqs.9 to 11), where most compounds are with logP value more than 2.7. This show ed that the P-gp binding capacity of these compounds shared common characteristics with their ATPase hydrolysis, namely their hydrophobic parameters (i.e. logP) and steric pa- rameters (e.g. MR). Additionally, the distribution of or- ganic molecules through BBB was not only influenced by organic solutes themselves, but also related to the properties of the solute-membrane water complex, namely interactions of the molecule with the phosphol- ipide-rich regions of cellular membranes. The ability of organic molecules permeating across BBB was mostly proportional to LogP (Eqs.14 to 18) but inversely pro- portional to PSA (Eqs.13 to 18), which is con sistent with the research results of Chen and co-workers [2], namely the increasing PSA decreased LogBB rapidly while LogP positively related to LogBB. Chen et al. have indicated that the optimum logP for designing CNS active drug was about 2.9 and the compound with LogP lower than 2.9 had a positive correlation with logBB, but the com- pound with logP bigger than 2.9 made an unfavorable contribution [2]. It is disclosed that molecules with higher lipophilic would be partitioned into the lipid bi- layer more easily with more chances to penetrate BBB, supported by the research result of Wang et al., namely a large number of structurally and functionally diverse compounds as substrates or modulators of P-gp mostly share common structural features, such as aromatic ring structures and high lipophilicity [1 9]. The LogP not only offered opportunity to p enetrate the lip id bilayer, bu t also gave favorable contribution to binding with P-gp or P450. There may be two reasons for this phenomenon. Firstly, the compounds with higher liposolubility are more vul- nerable to cytochrome P450 metabolism, leading to faster clearance [46]. P450 enzymes catalyze the me- tabolism of a wide variety of endogenous and exogenous compounds including xenobiotics, drugs, environmental toxins, steroids, and fatty acids. Aminated thioxanthones have recently been reported as P-gp inhibitors as well as its interaction with cytochrome P450 3A4 (CYP3A4), as many substrates of P-gp and CYP3A4 are common [47], which could be a major cause of P-gp binding or MDR- reversal activity of compounds inversely proportional to LogP. The second reason was related to the mechanism of P-gp action. According to the model proposed by Higgins and Gottesman [48], after entering into the phospholipid bilayer, compound may interact with P-gp in the inner leaflet of the lipid bilayer. Upon interaction with P-gp, the compound was flipped from the inner leaflet to the outer leaflet of the lipid bilayer. The lipo- philic compounds with high LogP entered into cellular membrane easily and intended to retain there, so its op- portunity to interact with P- gp increased and then its op- portunity to be pumped out of cells enhanced. In conclusion, the predictive model of BBB partition- ing of organic compounds contributed to the discovery of potential AD therapeutic drugs. Moreover, the interac- tion model of P-gp and modulators for the treatment of multidrug resistance indicates the discovery of some molecules to increase Aβ clearance from the brain and reduce Aβ brain accumulation by regulating BBB P-gp in the early stages of AD. Because P-gp is a transporter whose ligands are almost exclusively small molecules, it is not surprising that the pump itself is unable to trans- port Aβ. Nazer and co-worker have indicated the non- proteolytic clearance of Aβ via receptor-mediated trans- port across the BBB and investigated P-gp and the low- density lipoprotein receptor-related protein (LRP) in- volving Aβ efflux across the BBB [49]. Nevertheless, LRP or P-gp alone was insufficient for non-proteolytic transcytosis of intact Aβ. LRP in transcytosing intact Aβ across the BBB may require a co-transporter, such as P-gp [49]. Elucidation of the molecular mechanisms of the potential of LRP and P-gp to efflux cortical Aβ across BBB should help to promote rational therapeutic strategy in AD. 6. ACKNOWLEDGEMENTS This work was supported by a grant from Basic Scientific Research Expenses of Central University (020814360012), National Key Tech- nology R&D Program (2008BAI51B01) and Specialized Research Fund for the Doctoral Program of Higher Education (2012009111 0038). REFERENCES [1] Cheng, Z., Zhang, J., Liu, H., Li, Y., Zhao, Y. and Yang, E. (2010) Central nervous system penetration for small molecule therapeutic agents does not increase in multiple sclerosis- and Alzheimer’s disease-related animal models despite reported blood-brain barrier disruption. Drug Me- tabolism & Disposition, 38, 1355-1361. doi:10.1124/dmd.110.033324 [2] Chen, Y., Zhu, Q.J., Pan, J., Yang, Y. and Wu, X.P. (2009) A prediction model for blood-brain barrier per- meation and analysis on its parameter biologically. Com- puter Methods and Programs in Biomedicine, 95, 280- 287. doi:10.1016/j.cmpb.2009.03.006 [3] Miklossy, J. (2011) Alzheimer’s disease—A neurospiro- chetosis. Analysis of the evidence following Koch’s and Copyright © 2013 SciRes. OPEN ACCESS  T. Y. Zhu et al. / Advances in Bioscience and Biotechnology 4 (2013) 872-895 894 Hill’s criteria. Journal of Neuroinflammation, 8, 90. [4] Inoue, M., Konno, T., Tainaka, K., Nakata, E., Yoshida, H.O. and Morii, T. (2012) Positional effects of phos- phorylation on the stability and morphology of tau-related amyloid fibrils. Biochemistry, 51, 1396-1406. [5] Daebel, V., Chinnathambi, S., Biernat, J., Schwalbe, M., Habenstein, B., Loquet, A., Akoury, E., Tepper, K., Müller, H., Baldus, M., Griesinger, C., Zweckstetter, M., Mandelkow, E., Vijayan, V. and Lange, A. (2012) β- sheet core of tau paired helical filaments revealed by solid-state NMR. Journal of the American Chemical So- ciety, 134, 13982-13989. doi:10.1021/ja305470p [6] Jeynes, B. and Provias, J. (2011) An investigation into the role of p-glycoprotein in Alzheimer’s disease lesion pathogenesis. Neuroscience Letters, 487, 389-393. doi:10.1016/j.neulet.2010.10.063 [7] Vogelgesang, S., Jedlitschky, G., Brenn, A. and Walker, L.C. (2011) The role of the ATP-binding cassette trans- porter p-glycoprotein in the transport of β-amyloid across the blood-brain barrier. Current Pharmaceutical Design, 17, 2778-2786. doi:10.2174/138161211797440168 [8] Bartels, A.L. (2011) Blood-brain barrier p-glycoprotein function in neurodegenerative disease. Current Pharma- ceutical Design, 17, 2771-2777. doi:10.2174/138161211797440122 [9] Gottesman, M.M. and Pastan, I. (1993) Biochemistry of multidrug resistance mediated by the multidrug trans- porter. Annual Review of Biochemistry, 62, 385-427. [10] Kast, C., Canfield, V., Levenson, R. and Gros, P. (1996) Transmembrane organization of mouse p-glycoprotein determined by epitope insertion and immunofluorescence. The Journal of Biological Chemistry, 271, 9240-9248. [11] Bendayan, R., Lee, G. and Bendayan, M. (2002) Func- tional expression and localization of p-glycoprotein at the blood brain barrier. Microscopy Research and Technique, 57, 365-380. [12] Abuznait, A.H., Cain. C., Ingram, D., Burk, D. and Kad- doumi, A. (2011) Up-regulation of p-glycoprotein re- duces intracellular accumulation of beta amyloid: Inves- tigation of p-glycoprotein as a novel therapeutic target for Alzheimer’s disease. Journal of Pharmacy and Pharma- cology, 63, 1111-1118. doi:10.1111/j.2042-7158.2011.01309.x [13] Kothandan, G., Gadhe, C.G., Madhavan, T., Choi, C.H. and Cho, S.J. (2011) Docking and 3D-QSAR (quantita- tive structure activity relationship) studies of flavones, the potent inhibitors of p-glycoprotein targeting the nu- cleotide binding domain. European Journal of Medicinal Chemistry, 46, 4078-4088. doi:10.1016/j.ejmech.2011.06.008 [14] Hartz, A.M., Miller, D.S. and Bauer, B. (2010) Restoring blood-brain barrier p-glycoprotein reduces brain amy- loid-beta in a mouse model of Alzheimer’s disease. Mo- lecular Pharmacology, 77, 715-723. doi:10.1124/mol.109.061754 [15] Jabeen, I., Pleban, K., Rinner, U., Chiba, P. and Ecker, G.F. (2012) Structure-activity relationships, ligand effi- ciency, and lipophilic efficiency profiles of benzophe- none-type inhibitors of the multidrug transporter p-gly- coprotein. Journal of Medicinal Chemistry, 55, 3261- 3273. [16] Stouch, T.R. and Gudmundsson, O. (2002) Progress in understanding the structure-activity relationships of p- glycoprotein. Advanced Drug Delivery Reviews, 54, 315- 328. doi:10.1016/S0169-409X(02)00006-6 [17] Sharom, F.J. (1997) The p-glycoprotein efflux pump: How does it transport drugs? The Journal of Membrane Biology, 160, 161-175. doi:10.1007/s002329900305 [18] Li, Y., Wang, Y.H., Yang, L., Zhang, S.W., Liu, C.H. and Yang, S.L. (2005) Comparison of steroid substrates and inhibitors of p-glycoprotein by 3D-QSAR analysis. Jour- nal of Molecular Structure, 733, 111 -118. [19] Wang, R.B., Kuo, C.L., Lien, L.L. and Lien, E.J. (2003) Structure-activity relationship: Analyses of p-glycopro- tein substrates and inhibitors. Journal of Clinical Phar- macy and Therapeutics, 28, 203-228. [20] Wang, Y.H., Li, Y., Yang, S.L. and Yang, L. (2005) An in silico approach for screening flavonoids as p-gly- coprotein inhibitors based on a Bayesian-regularized neu- ral network. Journal of Computer-Aided Molecular De- sign, 19, 137-147. doi:10.1007/s10822-005-3321-5 [21] Chen, C. and Yang, J. (2006) MI-QSAR models for pre- diction of corneal permeability of organic compounds. Acta Pharmacologica Sinica, 27, 193-204. doi:10.1111/j.1745-7254.2006.00241.x [22] Kubinyi, H. (1995) Strategies and recent technologies in drug discovery. Pharmazie, 50, 647-662. [23] Wiese, M. and Pajeva, I.K. (2001) Structure-activity rela- tionships of multidrug resistance reversers. Current Me- dicinal Chemistry, 8, 685-713. [24] Taub, M.E., Podila, L., Ely, D. and Almeida, I. (2005) Functional assessment of multiple p-glycoprotein (p-gp) probe substrates: Influence of cell line and modulator concentration on p-gp activity. Drug Metabolism & Dis- position, 33, 1679-1687. doi:10.1124/dmd.105.005421 [25] Alka, K. (2003) C-QSAR: A database of 18000 QSARs and associated biological and physical data. Journal of Computer-Aided Molecular Design, 17, 187-196. [26] Kuo, C.L., Assefa, H., Kamath, S., Brzozowski, Z., Slawinski, J., Saczewski, F., Buolamwini, J.K. and Nea- mati, N. (2004) Application of CoMFA and CoMSIA 3D-QSAR and docking studies in optimization of mer- captobenzenesulfonamides as HIV-1 integrase inhibitors. Journal of Medicinal Chemistry, 47, 385-399. doi:10.1021/jm030378i [27] Cramer, R.D., Patterson, D.E. and Bunce, J.D. (1988) Comparative molecular field analysis (CoMFA). 1. Effect of shape on binding of steroids to carrier proteins. Jour- nal of the American Chemical Society, 110, 5959-5967. [28] Chen, L.J., Lian, G.P. and Han, L.J. (2007) Prediction of human skin permeability using artificial neural network (ANN) modeling. Acta Pharmacologica Sinica, 28, 591- 600. [29] Dhainaut, A., Regnier, G., Tizot, A., Pierre A., Leonce, S., Guilbaud, N., Kraus-Berthier, L. and Atassi, G. (1996) New purines and purine analogs as modulators of mul- tidrug resistance. Journal of Medicinal Chemistry, 39, Copyright © 2013 SciRes. OPEN ACCESS  T. Y. Zhu et al. / Advances in Bioscience and Biotechnology 4 (2013) 872-895 Copyright © 2013 SciRes. 895 OPEN ACCESS 4099-4108. [30] Ford, J.M., Bruggemann, E.P., Pastan, I., Gottesman, M.M. and Hait, W.N. (1990) Cellular and biochemical characterization of thioxanthenes for revesal of multidrug resistance in human and murine cell lines. Cancer Re- search, 50, 1748-1756. [31] Schmid, D., Ecker, G., Kopp, S., Hitzler, M. and Chiba, P. (1999) Structure-activity relationship studies of propa- fenone analogs cased on p-glycoprotein ATPase activity measurements. Biochemical Phar macology, 58, 14 47-1456. doi:10.1016/S0006-2952(99)00229-4 [32] Karelson, M. (2000) Molecular descriptors in QSAR/ QSPR. John Wiley & Sons, New York. [33] Karelson, M., Lobanov, V.S. and Katritzky, A.R. (1996) Quantum-chemical descriptors in QSAR/QSPR studies. Chemical Reviews, 96, 1027-1044. [34] Ponce, Y.M., Garit, J.A., Torrens, F., Zaldivar, V.R. and Castro, E.A. (2004) Atom, atom-type, and total linear in- dices of the “molecular pseudograph’s atom adjacency matrix”: Application to QSPR/QSAR studies of organic compounds. Molecules, 9, 1100-1123. doi:10.3390/91201100 [35] Iyer, M., Mishra, R., Han, Y. and Hopfinger, A.J. (2002) Predicting blood-brain barrier partitioning of organic molecules using membrane-interaction QSAR analysis. Pharmaceutical Research, 19, 1611-1621. doi:10.1023/A:1020792909928 [36] Abraham, M.H., Chadha, H.S. and Mitchell, R.C. (1995) Hydrogen bonding. 36. Determination of blood-brain bar- rier distribution using octanol-water partition coefficients. Drug Design and Discovery, 13, 123-131. [37] Abraham, M.H., Takacs-Novak, K. and Mitchell, R.C. (1997) On the partition of ampholytes: Application to blood-brain distribution. Journal of Pharmaceutical Sci- ences, 86, 310-315. doi:10.1021/js960328j [38] Bassolino-Klimas, D., Alper, H.E. and Stouch, T.R. (1993) Solute diffusion in lipid bilayer membranes: An atomic level study by molecular dynamics simulation. Biochemistry, 32, 12624-12637. doi:10.1021/bi00210a010 [39] Ma, X.L., Chen, C. and Yang, J. (2005) Predictive model of blood-brain barrier penetration of organic compounds. Acta Pharmacologica Sinica, 26, 500-512. doi:10.1111/j.1745-7254.2005.00068.x [40] Ohtsuki, S., Ito, S. and Terasaki, T. (2010) Is p-glyco- protein involved in amyloid-β elimination across the blood- brain barrier in Alzheimer’s disease? Clinical Pharma- cology & Therapeutics, 88, 443-445. [41] Aller, S.G., Yu, J., Ward, A., Weng, Y., Chittaboina, S., Zhuo, R., Harrell, P.M., Trinh, Y.T., Zhang, Q., Urbatsch, I.L. and Chang, G. (2009) Structure of p-glycoprotein re- veals a molecular basis for poly-specific drug binding. Science, 323, 1718-1722. doi:10.1126/science.1168750 [42] Ambudkar, S.V., Lelong, I.H., Zhang, J., Cardarelli, C.O., Gottesman, M.M. and Pastan, I. (1992) Partial purifica- tion and reconstitution of the human multidrug-resistance pump: Characterization of the drug-stimulatable ATP hy- drolysis. Proceedings of the National Academy of Sci- ences of the United States of America, 89, 8472-8476. [43] Shapiro, A.B. and Ling, V. (1994) ATPase activity of purified and reconstituted p-glycoprotein from Chinese hamster ovary cells. The Journal of Biological Chemistry, 269, 3745-3754. [44] Doige, C.A., Yu, X. and Sharom, F.J. (1993) The effects of lipids and detergents on ATPase-active p-glycoprotein. Biochimica et Biophysica Acta, 1146, 65-72. [45] Litman, T., Zeuthen, T., Skovsgaard, T. and Stein, W.D. (1997) Structure-activity relationships of p-glycoprotein interacting drugs: Kinetic characterization of their effects on ATPase activity. Biochimica et Biophysica Acta, 1361, 159-168. [46] Waterhouse, R.N. (2003) Determination of lipophilicity and its use as a predictor of blood-brain barrier penetra- tion of molecular imaging agents. Molecular Imaging & Biology, 5, 376-389. doi:10.1016/j.mibio.2003.09.014 [47] Palmeira, A., Sousa, E., Fernandes, M.X., Pinto, M.M. and Vasconcelos, M.H. (2012) Multidrug resistance re- versal effects of aminated thioxanthones and interaction with cytochrome P450 3A4. Journal of Pharmacy and Pharmaceutical scienc e s, 15, 31-45. [48] Higgins, C.F. and Gottesman, M.M. (1992) Is the mul- tidrug transporter a flippase? Trends in Biochemical Sci- ences, 17, 18-21. [49] Nazer, B., Hong, S. and Selkoe, D.J. (2008) LRP pro- motes endocytosis and degradation, but not transcytosis, of the amyloid-beta peptide in a blood-brain barrier in vi- tro model. Neurobiology of Disease, 30, 94-102. doi:10.1016/j.nbd.2007.12.005
|