Open Journal of Radiology, 2013, 3, 117-123
http://dx.doi.org/10.4236/ojrad.2013.33019 Published Online September 2013 (http://www.scirp.org/journal/ojrad)
Comparison Study on Different Quantification Methods of
Diffuse Myocardial Fibrosis of Dilated Cardiomyopathy
Using Myocardial T1 Value*
Takeshi Hayashida, Eijun Sueyoshi#, Hiroki Nagayama, Ichiro Sakamoto, Masataka Uetani
Department of Radiology, Nagasaki University School of Medicine, Nagasaki, Japan
Email: #sueyo@nagasaki-u.ac.jp
Received June 26, 2013; revised July 26, 2013; accepted August 3, 2013
Copyright © 2013 Takeshi Hayashida et al. This is an open access article distributed under the Creative Commons Attribution Li-
cense, which permits unrestricted use, distribution, and reproduction in any medium, provided the original work is properly cited.
ABSTRACT
Purpose: The purpose is to compare several quantification methods and clarify which quantification method is reliable
to estimate diffuse myocardial fibrosis with cardiac MRI in patients with dilated cardiomyopathy (DCM) using myo-
cardial T1 value. Methods and Results: Delayed enhancement imaging was performed in 52 patients with DCM and
10 control subjects to identify fibrosis using an inversion time scout sequence. The mean contrast-enhanced myocardial
(M) T1 values of the pre and post contrast-enhanced myocardial and left ventricular lumen (L) of control and dilated
cardiomyopathy cases were compared. The calculated post M T1 value, pre M T1 value-post M T1 value, and (pre M TI
value-post M T1 value)/(pre L T1 value-post L T1 value) were significantly different between the patient group and the
control group (344.5 ± 31.6 vs. 390.4 ± 19.3 msec, 239.9 ± 64.2 msec vs. 134.0 ± 28.9 msec, and 0.50 ± 0.11 vs. 0.30 ±
0.60, respectively). (Pre M T1 value-post M T1 value)/(pre L T1 value-post L T1 value) was significantly the most re-
lated to the left ventricular ejection fraction (r = 0.66, p < 0.0001). Conclusion: (Pre M T1 value-post M T1 value)/(pre
L T1 value-post L T1 value) was the most reliable quantification method to estimate the severity of DCM.
Keywords: Inversion Time; Quantification Methods; Myocardial Fibrosis; Dilated Cardiomyopathy
1. Introduction
Recently, the importance of myocardial fibrosis in the
development and progression of systolic and diastolic
cardiac failure has been highlighted in cardiomyopathy
[1-3]. Central to the diagnostic utility of cardiovascular
magnetic resonance is its almost unique capacity to re-
veal myocardial fibrosis through the use of delayed ga-
dolinium enhancement imaging [4].
In patients with cardiac infarction, infarcted regions in
the myocardium, having undergone scar formation with
collagen deposition, have a much slower washout rate of
gadolinium-based contrast material than healthy myocar-
dium, leading to markedly increased signal intensity on
T1-weighted imaging [5]. On the other hand, because
60% of dilated cardiomyopathy (DCM) patients have
diffuse myocardial fibrosis, the technique of delayed
contrast enhancement often shows no regional scarring
[5]. Previous study suggested that the mean contrast-
enhanced myocardial inversion time at the null point (T1
value) was significantly shorter in a patient group than in
a control group [5]. T1 value can be easily obtained, but
this technique does not consider the influence of the con-
trast medium in the blood pool, and thus may not evalu-
ate the enhancement of myocardium precisely.
The purpose of this study was to compare several
quantification methods and clarify which quantification
method is reliable to evaluate diffuse myocardial fibrosis
of DCM using T1 value.
2. Materials and Methods
2.1. Patients
Fifty-two patients (33 men, 19 women; mean age ± SD,
53.3 ± 13.6 y; age range, 18 - 77 y) with DCM and 10
control subjects (5 men, 5 women; mean age ± SD, 54.8
± 12.4 y; age range, 55 - 74 y) underwent MRI at our
institution between June 2008 and July 2011. There was
no statistically significant difference in mean age (P =
0.763) between the two groups. The diagnosis of non-
ischemic DCM was made according to World Health
Organization and International Society and Federation of
*Conflict of interest: This work was supported by JSPS KAKENHI
Grant Number 24591776.
#Corresponding author.
C
opyright © 2013 SciRes. OJRad
T. HAYASHIDA ET AL.
118
Cardiology criteria [6]. None of the subjects had clinical
symptoms or signs of ongoing myocarditis. By the use of
coronary angiography, cases of significant coronary ar-
tery disease (>50% diameter luminal stenosis in any
coronary artery) were excluded from this study. Other
exclusion criteria were the presence of any contraindica-
tions for cardiac MRI, significant valvular disease, or any
evidence of infiltrative heart disease by clinical symp-
toms or signs and sonographic findings. In addition, all
patients with DCM underwent myocardial biopsy. The
specimens showed disarray, with varying degrees of in-
terstitial fibrosis of the myocardium, which were consis-
tent with DCM.
On the other hand, all control subjects (n = 10) under-
went cardiac MRI because of arrhythmia; however, no
subjects had abnormalities according to coronary an-
giography, laboratory testing, echocardiography, nuclear
medicine scan, or myocardial biopsy, which were per-
formed to rule out various myocardial diseases.
All subjects gave written informed consent, and the
protocol was approved by a medical ethics committee.
2.2. Cardiac MRI
All subjects were studied in the supine position using a
1.5-T cardiac MRI system (Avanto, Siemens Healthcare)
with an eight-channel body coil. The data acquisition was
blinded to diagnosis. The cardiac MRI study included
cine steady-state free-precision imaging (TR/TE, 3.4/1.2;
in-plane spatial resolution, 1.6 × 2 mm) of left ventricular
function. Cine images were acquired with ECG gating
and breath-holding. Cine images were obtained in 8 - 14
short axis (8-mm thickness with 0-mm spacing) from the
base to the apex of the left ventricle. Vertical long axis
images were also obtained. In all subjects (n = 62), in-
version time scout images were obtained before en-
hancement and 15 minutes from the beginning of bolus
injection of gadopentetate dimeglumine (0.2 mmol/kg;
Magnevist, Bayer Schering Pharma) to identify regional
fibrosis using a 2D inversion recovery gradient-echo
technique (inversion time scout sequence: TR/TE, 20.8/1.3;
flip angle, 25˚; acquisition matrix, 192 × 78; field of view,
34 × 27 cm; slice thickness, 8 mm; inversion time, indi-
vidually determined to null the myocardial and left ven-
tricular lumen signal). Forty-two images per single mid-
ventricular slice were acquired at various inversion times
during breath-holding as long as possible (Figures 1(a)
and (b)). This single midventricular slice was selected on
the basis of long axis scout images of the left ventricle
be- fore inversion time scout images were obtained.
These inversion time scout images were then processed
with a curve-fitting technique to generate T1 maps (Fig-
ures 1(c) and (d)). After the inversion time scout se-
quence was performed, ordinary delayed enhanced im-
ages were obtained.
2.3. Data Analysis
All MRI post-processing was performed by a single ob-
server with more than 10 years of experience in cardiac
MRI. The left ventricular ejection fraction was derived
from cine images using a workstation for analysis (Syngo,
Siemens Healthcare). A T1 mapping sequence was used
to calculate the pre and post contrast-enhanced myocar-
dial and left ventricular lumen T1 times of a single mid-
ventricular slice as an index of diffuse fibrosis. After
image acquisition, short-axis images of varying inversion
times were transferred to a workstation for analysis
(Syngo, Siemens Healthcare). For each image, a region
of interest was drawn in the left ventricular lumen and
around the entire myocardium to calculate the pre and
post contrast-enhanced myocardial and left ventricular
lumen TI0 values for each subject (Figures 1(a) and (b)).
This allowed us to analyze regions of interest to find the
average T1 time for that area, as well as a pixel-by-pixel
determination of T1, by fitting data acquired at various
preparation times to the exponential curve.
We then determined pre and post contrast-enhanced
myocardial (M) and left ventricular lumen (L) T1 values
(pre contrast-enhanced myocardial T1 value; pre M T1
value, pre contrast-enhanced left ventricular lumen T1
value; pre L T1 value, post contrast-enhanced myocardial
T1 value; post M T1 value, post contrast-enhanced left
ventricular lumen T1 value; post L T1 value) [1,7,8]
(Figures 1(c) and (d)). We compared the several quanti-
fication methods as follows: 1) post M T1 value, 2) pre
M T1 value-post M T1 value, 3) post M T1 value/post L
T1 value, and 4) (pre M T1 value-post M T1 value)/(pre
L T1 value-post L T1 value).
2.4. Statistical Analysis
All values are expressed as the mean ± SD. Statistical
analysis was performed on clinical and morphologic
variables with the paired Student’s t test and Mann-
Whitney U test for continuous variables. Pearson’s cor-
relation coefficients were used to examine the correlation
of left ventricular ejection fraction with all TI0 values.
Correlation coefficient values of 0.4 - 1.0 were consid-
ered to indicate a correlation [9]. In all tests, p < 0.05 was
considered significant (SPSS, release 11.5; SPSS).
3. Results
The results are summarized in Table 1. In patients in the
DCM group, the mean pre M T1 value, post M T1 value,
pre L T1 value, and post L T1 value were 581.3 ± 58.3
msec, 344.5 ± 31.6 msec, 741.2 ± 92.5 msec, and 257.5 ±
46.1 msec, respectively. In the control group, the mean
pre M T1 value, post M T1 value, pre L T1 value, and
post L T1 value were 519.7 ± 30.4 msec, 390.4 ± 19.3
msec, 731.4 ± 64.4 msec, and 299.3 ± 35.5 msec,
Copyright © 2013 SciRes. OJRad
T. HAYASHIDA ET AL.
Copyright © 2013 SciRes. OJRad
119
(a) (b)
(c) (d)
Figure 1. A 63-year-old woman with dilated cardiomyopathy. (a) Epicardial and endocardial borders were manually traced,
and a region of interest was placed in a single midventricular slice to obtain signal intensity of left ventricular myocardium.
(b) Region of interest was manually placed in the left ventricular lumen in a single midventricular slice to obtain signal inten-
sity of left ventricular myocardium. (c) We analyzed regions of interest to find the average T1 for that area by fitting data
acquired at various preparation times to an exponential curve. We determined pre contrast-enhanced myocardial T1 value
(vertical line). SI = signal intensity. (d) We analyzed regions of interest to find the average T1 for that area by fitting data
acquired at various preparation times to an exponential curve. We determined post contrast-enhanced myocardial T1 value
(vertical line). SI = signal intensity.
respectively (Table 2). There were statistically signifi-
cant differences between the patient and control groups
in pre M T1 values, post M T1 values, and post L T1
values (P = 0.0052, P < 0.0001, P = 0.002, respectively).
However, there was no significant difference between the
patient and control groups in pre L T1 value (P = 0.559).
In patients in the DCM group, post M T1 value, pre M
T1 value-post M T1 value, post M T1 value/post L T1
value, and (pre M T1 value-post M T1 value)/(pre L T1
value-post L T1 value) were 344.5 ± 31.6 msec, 239.9 ±
64.2 msec, 1.37 ± 0.21, and 0.50 ± 0.11, respectively. In
the control group, post M T1 value, pre M T1 value-post
M T1 value, post M T1 value/post T1 value, and (pre M
T1 value-post M T1 value)/(pre L T1 value-post L T1
value) were 390.4 ± 19.3 msec, 134.0 ± 28.9 msec, 1.31
± 0.13, and 0.30 ± 0.60, respectively (Table 3). There
were statistically significant differences between the pa-
tient and control groups in post M T1 value, pre M T1
value-post M T1 value, and (pre M T1 value-post M T1
value)/(pre L T1 value-post L T1 value) (P < 0.0001, P <
0.0001, P < 0.0001, respectively). However, there was no
significant difference between the patient and control
T. HAYASHIDA ET AL.
120
Table 1. Summary of results in patient and control groups.
Characteristic Control Subjects
(n = 10)
Patients
(n = 52) P
Age(Y) 54.8 ± 12.4 53.3 ± 13.6 NS
Sex(no.) NS
Male 5 33
Female 5 19
LVEF (%) 62.5 ± 7.0 37.2 ± 14.1 <0.0001
Note: LVEF = Left ventricular ejection fraction, NS = not significant.
Table 2. Comparison of pre and post contrast-enhanced
myocardial and left ventricular lumen T1 values between
control and DCM groups.
Control DCM P
Pre M T1 value
(msec) 519.7 ± 30.4 581.3 ± 58.3 0.005
Post M T1
value (msec) 390.4 ± 19.3 344.5 ± 31.6 <0.0001
Pre L T1 value
(msec) 731.4 ± 64.4 741.2 ± 92.5 NS
Post L T1 value
(msec) 299.3 ± 35.5 257.5 ± 46.1 0.002
Note: NS = not significant.
Table 3. Comparison of four quantification methods of T1
value between control and DCM groups.
Control DCM P
Post M T1 value (msec) 390.4 ± 19.3 344.5 ± 31.6 <0.0001
Pre M T1 value - post M
TI value (msec) 134.0 ± 28.9 239.9 ± 64.2 <0.0001
Post M T1 value/post L
T1 value 1.31 ± 0.13 1.37 ± 0.21 0.3422
(pre M T1 value - post
M T1 value)/(pre L T1
value - post L T1 value)
0.30 ± 0.60 0.50 ± 0.11 <0.0001
Note: M = myocardial, L = left ventricular lumen, DCM = dilated cardio-
myopathy.
groups in post M T1 value/post T1 value.
In the DCM groups, (pre M T1 value-post M T1
value)/(pre L T1 value-post L T1 value) was the most
significantly related to the left ventricular ejection frac-
tion (r = 0.66; P < 0.0001) (Figure 2). The other quanti-
fication methods (post M T1 value, pre M T1 value-post
M T1 value, and post M T1 value/post L T1 value) had
smaller positive correlations than (pre M T1 value-post
M T1 value)/(pre L T1 value-post L T1 value) with the
left ventricular ejection fraction (post M T1 value; r =
0.53; P < 0.0001) (Figure 3), pre M T1 value-post M T1
value (r = 0.47; P < 0.0001) (Figure 4), and post M T1
value/post L T1 value (r = 0.10; P = 0.43) (Figure 5).
Figure 2. Scatterplot shows correlation between left ven-
tricular ejection fraction and (pre M T1 value-post M T1
value)/(pre L T1 value-post L T1 value) in patients with
DCM. (Pre M T1 value-post M T1 value)/(pre L T1
value-post L T1 value) was most significantly related to left
ventricular ejection fraction (r = 0.66; P < 0.0001).
Figure 3. Scatterplot shows correlation between left ven-
tricular ejection fraction and post M T1 value in patients
with DCM. Post M T1value was significantly related to left
ventricular ejection fraction (r = 0.53; P < 0.0001).
Figure 4. Scatterplot shows correlation between left ven-
tricular ejection fraction and pre M T1 value-post M T1
value in patients with DCM. Pre M T1 value-post M T1
value was significantly related to left ventricular ejection
fraction (r = 0.47; P < 0.0001).
Copyright © 2013 SciRes. OJRad
T. HAYASHIDA ET AL. 121
Figure 5. Scatterplot shows correlation between left ven-
tricular ejection fraction and post M T1 value/post L T1
value in patients with DCM. Post M T1 value/post L T1
value was not significantly related to left ventricular ejec-
tion fraction (r = 0.10; P =0.43).
4. Discussion
In patients with DCM, an important mechanism for the
occurrence of arrhythmias and failure to respond to treat-
ment is the presence of myocardial fibrosis [10-13]. There-
fore, in patients with DCM, fibrosis is one of the most
important risk factors for mortality.
Delayed enhanced MRI has enabled depiction of
myocardial damage with high spatial resolution in vari-
ous myocardial diseases. Delayed enhanced cardiac MRI
has been used to evaluate focal myocardial fibrosis, but it
is difficult to evaluate diffuse fibrosis of the myocardium.
Prior studies have identified pathologic findings of myo-
cardial fibrosis and disarray can show enhancement on
delayed enhanced images, but delayed enhancement re-
lated to disarray is usually faint. Measurement of con-
trast-enhanced myocardial T1 value can provide an esti-
mate of diffuse fibrosis of the myocardium [1,5,7]. There-
fore, the prior studies used contrast-enhanced myocardial
T1 value, which is easily calculated on a workstation
[14-16]. In addition, T1 value was used as the optimal
inversion time when delayed enhanced MR images were
acquired.
According to previous study, the T1 values were 273 -
420 msec, 15 minutes after administration of contrast
material in patients with DCM [5]. This quantification
method has been postulated to be useful as this contrast-
enhanced myocardial T1 value was significantly shorter
in the patient group than in the control group. However,
this quantification method does not consider the influ-
ence of the contrast medium of the blood pool and thus
this quantification method might not enable precise de-
termination of the enhancement of myocardium. Another
prior study identified quantification methods such as post
M T1 value/post L T1 value, which considered the in-
fluence of the contrast medium of the blood pool [17],
but this quantification method did not measure the dif-
ference between post M T1 value and pre M T1 value, or
between post L T1 value and pre L T1 value. For these
reasons, this quantification method might not evaluate
the enhancement of myocardium precisely.
To our knowledge, this is the first study to determine
pre and post contrast-enhanced myocardial and left ven-
tricular lumen T1 values. This study compared several
quantification methods.
In this study, post M T1 value, pre M T1 value-post M
T1 value, and (pre M T1 value-post M T1 value)/(pre L
T1 value-post L T1 value) showed statistically significant
differences between patient and control groups. These
methods could be useful diagnostic tools for DCM. How-
ever, because the quantification method of post M T1
value did not measure a difference between post M T1
value and pre M T1 value, this quantification method
may not evaluate the enhancement of myocardium pre-
cisely. Moreover, because this quantification method
may not measure the difference between post L T1 value
and pre L T1 value, this quantification method did not
consider the influence of the contrast medium of the
blood pool.
The quantification method of pre M T1 value-post M
T1 value may not measure the difference between post L
T1 value and pre L T1 value. Because this quantification
method did not consider the influence of the contrast
medium of the blood pool, this quantification method
may not evaluate the enhancement of myocardium pre-
cisely.
The quantification method of post M T1 value/post L
T1 value did not show a significant difference between
the patient and control groups, although this quantifica-
tion method considers the influence of the contrast me-
dium of the blood pool.
The quantification method of (pre M T1 value-post M
T1 value)/(pre L T1 value-post L T1 value) measured the
difference between post M T1 value and pre M T1 value,
and between post L T1 value and pre L T1 value. Be-
cause this quantification method considers the influence
of the contrast medium of the blood pool, this method
may evaluate the enhancement of myocardium most pre-
cisely among the four methods.
In prior studies, left ventricular ejection fraction was
suggested to be associated with serious clinical symp-
toms [18-20]. According to our results, (pre M T1
value-post M T1 value)/(pre L T1 value-post L T1 value)
was the most significantly related to the left ventricular
ejection fraction (r = 0.66; P < 0.0001) in the DCM
group. Our study shows that the quantification method of
(pre M T1 value-post M T1 value)/(pre L T1 value-post
L T1 value) considers the influence of the contrast me-
dium of the blood pool and evaluates the enhancement of
myocardium. Therefore, this method may be the most re-
liable diagnostic method to evaluate the extent of myo-
Copyright © 2013 SciRes. OJRad
T. HAYASHIDA ET AL.
122
cardial fibrosis non-invasively.
There were several limitations to this study. First, we
used inversion times to measure a single slice. Ideally,
measurement of the whole myocardium is needed to
evaluate diffuse fibrosis. Therefore, further studies re-
garding markers of fibrosis are needed. In addition, it is
not easy to draw a myocardial boundary. This process
may potentially bias the results.
Second, this study lacked a comparison of severity of
myocardial fibrosis, histologically. However, it may be
impossible to correlate the areas of fibrosis on biopsy
with the areas seen on MRI.
Third, we evaluated only four quantification methods
and we must carry out further examination to find a more
useful quantification method.
5. Conclusion
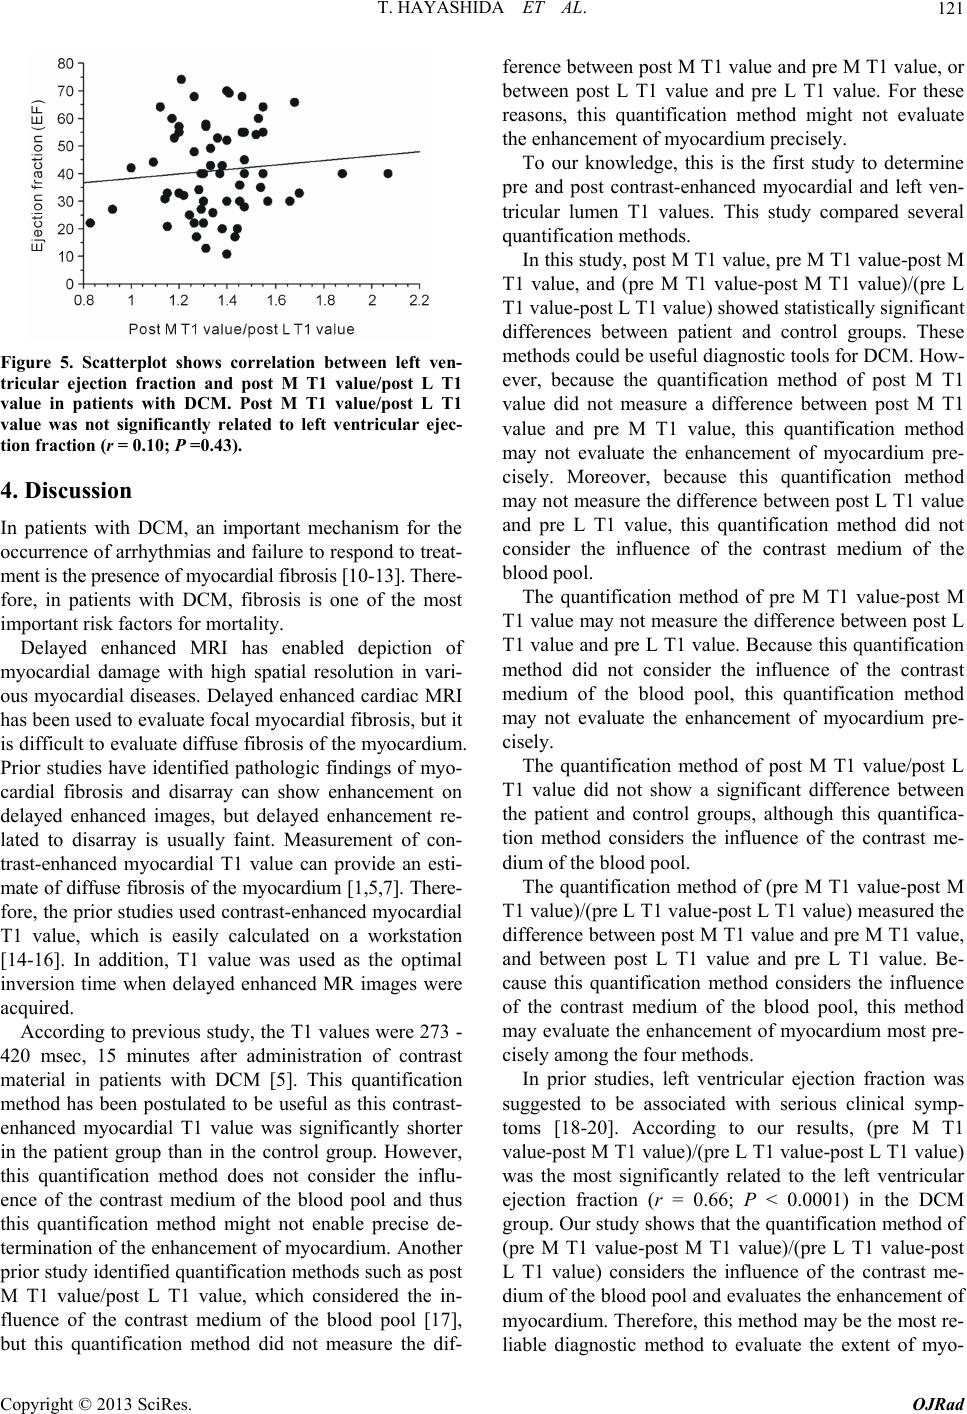
In conclusion, (pre M T1 value-post M T1 value)/(pre L
T1 value-post L T1 value), which considered the influ-
ence of the contrast medium of the blood pool, evaluated
the enhancement of myocardium precisely. This method
was the most significantly related to the left ventricular
ejection fraction. These data suggest that (pre M T1
value-post M T1 value)/(pre L T1 value-post L T1 value)
is the most reliable quantification method to estimate the
severity of DCM.
REFERENCES
[1] L. Iles, H. Pfluger, A. Phrommintikul, J. Cherayath, P.
Aksit, S. N. Gupta, D. M. Kaye and A. J. Taylor, “Eva-
luation of Diffuse Myocardial Fibrosis in Heart Failure
with Cardiac Magnetic Resonance Contrast-Enhanced T1
Mapping,” Journal of the American College of Cardi-
ology, Vol. 52, No. 19, 2008, pp. 1574-1580.
doi:10.1016/j.jacc.2008.06.049
[2] T. M. Koelling, R. S. Chen, R. N. Lubwama, G. J. L’I-
talien and K. A. Eagle, “The Expanding National Burden
of Heart Failure in the United States: The Influence of
Heart Failure in Women,” American Heart Journal, Vol.
147, No. 1, 2004, pp. 74-78.
doi:10.1016/j.ahj.2003.07.021
[3] D. L. Mann, “Mechanisms and Models in Heart Failure:
A Combinatorial Approach,” Circulation, Vol. 100, 1999,
pp. 999-1008. doi:10.1161/01.CIR.100.9.999
[4] T. F. Ismail, S. K. Prasad and D. J. Pennell, “Prognostic
Importance of Late Gadolinium Enhancement Cardio-
vascular Magnetic Resonance in Cardiomyopathy,” Heart,
Vol. 98, No. 6, 2012, pp. 438-442.
doi:10.1136/heartjnl-2011-300814
[5] E. Sueyoshi, I. Sakamoto and M. Uetani, “Contrast-En-
hanced Myocardial Inversion Time at the Null Point for
Detection of Left Ventricular Myocardial Fibrosis in Pa-
tients with Dilated and Hypertrophic Cardiomyopathy: A
Pilot Study,” American Journal of Roentgenology, Vol.
194, No. 4, 2010, pp. W293-W298.
doi:10.2214/AJR.09.3414
[6] P. Richardson, W. McKenna, M. Bristow, B. Maisch, B.
Mautner, J. O’Connell, E. Olsen, G. Thiene, J. Goodwin,
I. Gyarfas, I. Martin and P. Nordet, “Report of the 1995
World Health Organization/International Society and
Federation of Cardiology Task Force on the Definition
and Classification of Cardiomyopathies,” Circulation,
Vol. 93, 1996, pp. 841-842. doi:10.1161/01.CIR.93.5.841
[7] P. Sparrow, D. R. Messroghli, S. Reid, J. P. Ridgway, G.
Bainbridge and M. U. Sivananthan, “Myocardial T1 Map-
ping for Detection of Left Ventricular Myocardial Fibro-
sis in Chronic Aortic Regurgitation: Pilot Study,” Ameri-
can Journal of Roentgenology, Vol. 187, No. 6, 2006, pp.
W630-W635. doi:10.2214/AJR.05.1264
[8] D. R. Messroghli, S. Plein, D. M. Higgins, K. Walters, T.
R. Jones and J. P. Ridgway, “Human Myocardium: Sin-
gle-Breath-Hold MR T1 Mapping with High Spatial Re-
solution—Reproducibility Study,” Radiology, Vol. 238,
No. 3, 2006, pp. 1004-1012.
doi:10.1148/radiol.2382041903
[9] K. H. Zou, K. Tuncali and S. G. Silverman, “Correlation
and Simple Linear Regression,” Radiology, Vol. 227, No.
3, 2003, pp. 617-622. doi:10.1148/radiol.2273011499
[10] R. J. Kim, E. Wu, A. Rafael, E. L. Chen, M. A. Parker, O.
Simonetti, F. J. Klocke, R. O. Bonow and R. M. Judd,
“The Use of Contrast-Enhanced Magnetic Resonance
Imaging to Identify Reversible Myocardial Dysfunction,”
The New England Journal of Medicine, Vol. 343, No. 20,
2000, pp. 1445-1453.
doi:10.1056/NEJM200011163432003
[11] R. G. Assomull, S. K. Prasad, J. Lyne, G. Smith, E. D.
Burman, M. Khan and M. N. Sheppard, P. A. Poole-
Wilson and D. J. Pennell, “Cardiovascular Magnetic
Resonance, Fibrosis, and Prognosiin Dilated Cardio-
myopathy,” Journal of the American College of Cardiol-
ogy, Vol. 48, No. 10, 2006, pp. 1977-1985.
doi:10.1016/j.jacc.2006.07.049
[12] D. Bello, D. S. Fieno, R. J. Kim, F. S. Pereles, R. Pass-
man, G. Song, A. H. Kadish and J. J. Goldberger, “Infarct
Morphology Identifies Patients with Substrate for Sus-
tained Ventricular Tachycardia,” Journal of the American
College of Cardiology, Vol. 45, No. 7, 2005, pp. 1104-
1108. doi:10.1016/j.jacc.2004.12.057
[13] D. Bello, D. J. Shah, G. M. Farah, S. Di Luzio, M. Parker,
M. R. Johnson, W. G. Cotts, F. J. Klocke, R. O. Bonow,
R. M. Judd, M. Gheorghiade and R. J. Kim, “Gadolinium
Cardiovascular Magnetic Resonance Predicts Reversible
Myocardial Dysfunction and Remodeling in Patients with
Heart Failure Undergoing Betablocker Therapy,” Circu-
lation, Vol. 108, 2003, pp. 1945-1953.
doi:10.1161/01.CIR.0000095029.57483.60
[14] A. M. Huber, S. O. Schoenberg, C. Hayes, B. Spannagl,
M. G. Engelmann, W. M. Franz and M. F. Reiser, “Phas-
esensitive Inversion-Recovery MR Imaging in the Detec-
tion of Myocardial Infarction,” Radiology, Vol. 237, No.
3, 2005, pp. 854-860. doi:10.1148/radiol.2373041483
[15] J. N. Oshinski, Z. Yang, J. R. Jones, J. F. Mata and B. A.
French, “Imaging Time after Gd-DTPA Injection is Criti-
cal in Using Delayed Enhancement to Determine Infarct
Copyright © 2013 SciRes. OJRad
T. HAYASHIDA ET AL.
Copyright © 2013 SciRes. OJRad
123
Size Accurately with Magnetic Resonance Imaging,” Cir-
culation, Vol. 104, 2001, pp. 2838-2842.
doi:10.1161/hc4801.100351
[16] C. Klein, S. G. Nekolla, F. M. Bengel, M. Momose, A.
Sammer, F. Haas, B. Schnackenburg, W. Delius, H.
Mudra, D. Wolfram and M. Schwaiger, “Assessment of
Myocardial Viability with Contrast Enhanced Magnetic
Resonance Imaging: Comparison with Positron Emission
Tomography,” Circulation, Vol. 105, 2002, pp. 62-167.
doi:10.1161/hc0202.102123
[17] A. K. Kono, N. Yamada, M. Higashi, S. Kanzaki, H.
Hashimura, Y. Morita, T. Sakuma, T. Noguchi, H. Naito
and K. Sugimura, “Dynamic Late Gadolinium Enhance-
ment Simply Quantified Using Myocardium to Lumen
Signal Ratio: Normal Range of Ratio and Diffuse Ab-
normal Enhancement of Cardiac Amyloidosis,” Journal
of Magnetic Resonance Imaging, Vol. 34, No. 1, 2011, pp.
50-55. doi:10.1002/jmri.22602
[18] J. J. Bax, D. Poldermans, A. Elhendy, J. H. Cornel, E.
Boersma, R. Rambaldi, J. R. Roelandt and P. M. Fioretti,
“Improvement of Left Ventricular Ejection Fraction,
Heart Failure Symptoms and Prognosis after Revascu-
larization in Patients with Chronic Coronary Artery Dis-
ease and Viable Myocardium Detected by Dobutamine
Stress Echocardiography,” Journal of the American Col-
lege of Cardiology, Vol. 34, No. 1, 1999, pp. 163-169.
doi:10.1016/S0735-1097(99)00157-6
[19] F. Cacciapuoti, “Are Clinical Heart Failure and Ejection
Fraction Always Connected?” Open Heart Failure Jour-
nal, Vol. 3, 2010, pp. 1-8.
[20] I. Nishi, T. Noguchi, Y. Iwanaga, S. Furuichi, N. Aihara,
H. Takaki and Y. Goto, “Effects of Exercise Training in
Patients with Chronic Heart Failure and Advanced Left
Ventricular Systolic Dysfunction Receiving β-Blockers,”
Circulation Journal, Vol. 75, No. 7, 2011, pp. 1649-1655.
doi:10.1253/circj.CJ-10-0899