M. KANEMATSU ET AL. 113
2. Materials and Methods
2.1. Patients
This HIPAA-compliant study had institutional review
board approval and all patients provided written in-
formed consent. During a recent 5-month period, 176
consecutive patients with a known malignancy and with-
out known chronic liver disease due to viral, alcoholic,
autoimmune, or cryptogenic hepatitis underwent ab-
dominopelvic contrast-enhanced CT for a preoperative
work-up or a post-therapeutic survey. Of these, 44 pa-
tients were excluded because of; prior abdominal surgery
that could significantly alter the portal venous blood flow
dynamics (n = 38), diffuse fatty liver (n = 2), and nu-
merous liver metastases (n = 4). The remaining 132 pa-
tients (88 men and 44 women; age range, 19 - 91 years;
mean age, 62.1 years) constituted the study population.
The primary malignancies in these 132 patients were;
rectal (n = 35), gastric (n = 29), colon (n = 28), breast (n
= 10), uterine cervical (n = 5), endometrial (n =3), eso-
phageal (n =3), ovarian (n = 3), prostate (n = 2), pancre-
atic (n = 2), renal cell (n = 1), bile duct (n = 1), appen-
diceal (n = 1), pulmonary (n = 1), urinary bladder (n = 1)
or testicular (n = 1) carcinoma, or gastrointestinal stromal
tumor of the stomach (n = 2), malignant lymphoma of the
cervical lymph nodes (n = 2), uterine leiomyosarcoma (n
= 1), and Paget's disease of the scrotum (n = 1).
2.2. Contrast Material Injection and Scan
Protocols
A 16-detector CT scanner (Lightspeed 16; GE Healthcare,
Milwaukee, WI) with a fixed tube voltage of 120 kVp
and an automatic tube current modulation program (3D
mA Modulation; GE Healthcare) was used. Other CT
parameters were as follows: collimation, 1.25 mm; de-
tector configuration, 16 detectors with a 1.25-mm section
thickness (16 × 1.25 mm); table feed, 27.5 mm per rota-
tion; pitch, 1.37; craniocaudal scan range, 45 - 50 cm;
32-cm field of view; 0.5-second gantry rotation time; and
scan acquisition time, 8.8 - 9.7 seconds. All transverse
CT images were reconstructed at section thickness of 5
mm by using a standard reconstruction algorithm.
After the acquisition of unenhanced images, a bo-
lus-tracking program (Smart Prep; GE Medical Systems)
was used to determine the optimal time to initiate diag-
nostic portal venous-phase scanning following the ad-
ministration of contrast medium. All patients were ad-
ministered non-ionic iodinated contrast material contain-
ing 300 mg of iodine per milliliter warmed to body tem-
perature at a dose of 2 mL per kilograms injected intra-
venously over 30 seconds using a commercially available
power injector through a 21-gauge plastic catheter, which
was typically placed in either an antecubital vein or a
radial vein. The fractional dose was 20 mg iodine/kg/sec
in all patients.
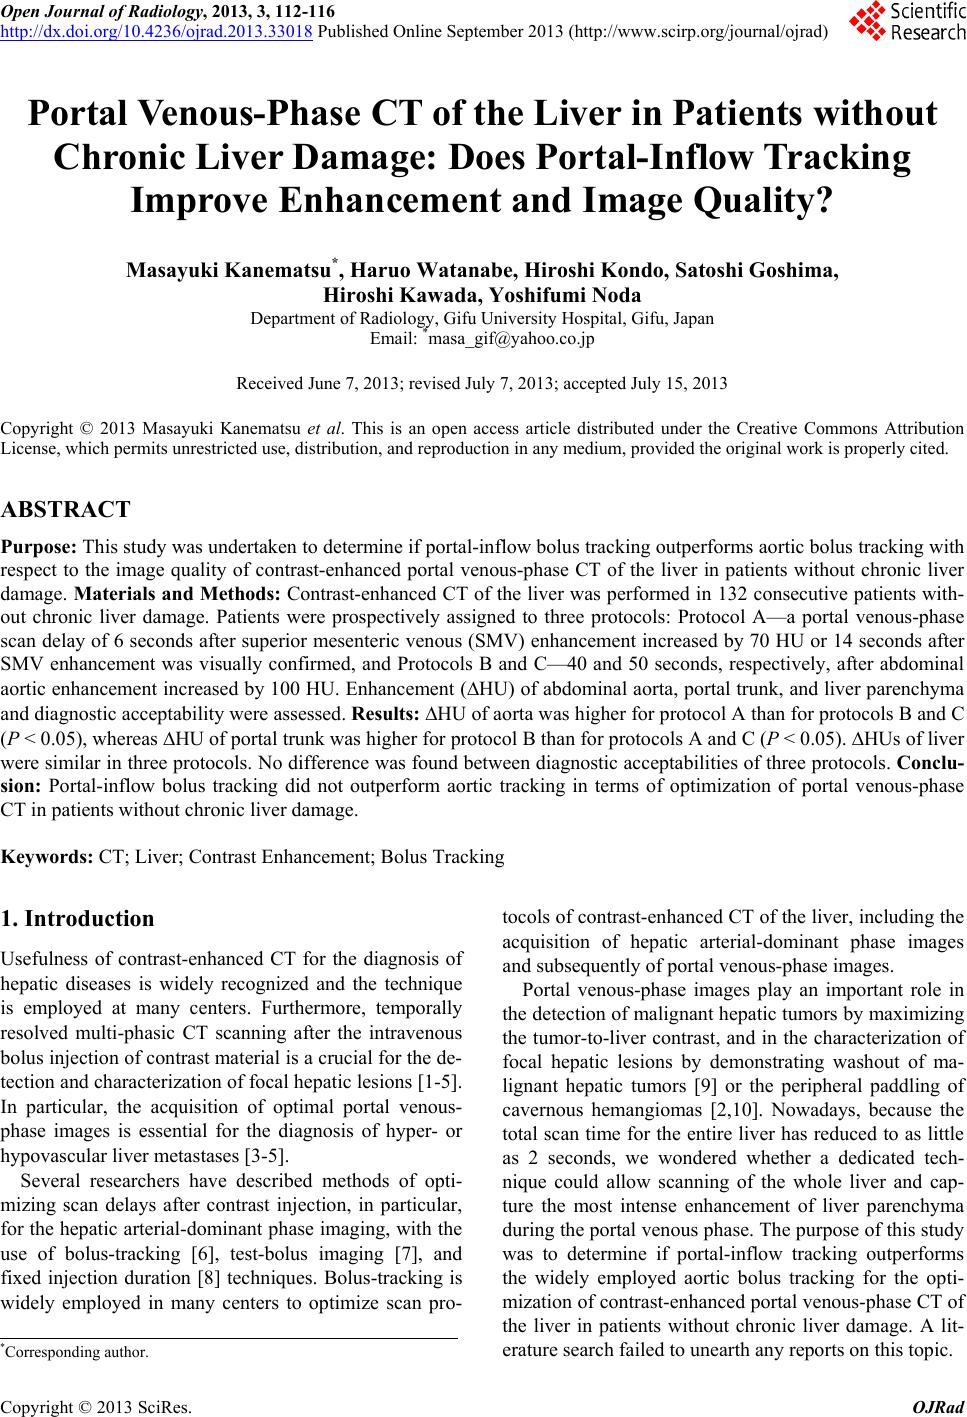
Patients were prospectively randomized to three pro-
tocol groups, using a random-number table, as follows:
Protocol A—the portal venous-phase scan was started 6
seconds after enhancement of the superior mesenteric
vein (SMV) trunk increased by 70 HU or 14 seconds
after the SMV enhancement was visually confirmed, and
Protocols B and C—40 and 50 seconds, respectively,
after the abdominal aortic enhancement increased by 100
HU. For protocol A, CT number measurement in the
SMV occasionally failed due to respiratory motion. Hence,
we determined the empiric scan delay by visually con-
firming SMV enhancement prior to initiating the portal
venous-phase scan. The default empiric scan delay was
determined to be 14 seconds, which was obtained by
adding 8 seconds to the 6 seconds, because the mean
time in seconds from the initiation of contrast inflow in
the SMV to a CT number increase by 70 HU was deter-
mined to be 8.1 ± 3.7 (mean ± 1SD) seconds during our
preliminary evaluation of 40 patients (unpublished our
data).
The region of interest cursor for bolus tracking was
placed in the SMV trunk or in the aorta just above the
diaphragmatic dome. Real-time low-dose (120 kVp, 50
mA) serial monitoring scans were started 30 (protocol A)
or 10 (protocols B and C) seconds after initiating the
contrast injection. The time in seconds from initiation of
contrast injection to diagnostic scan initiation was re-
corded in all patients.
2.3. Quantitative Image Analysis
A radiologist (H. W.) with 5 years of post-training ex-
perience at interpreting body CT images measured mean
CT numbers and determined standard deviations in the
abdominal aorta, portal vein trunk, and liver on a com-
mercially available DICOM viewer. Measurements were
performed on unenhanced and portal venous-phase axial
images. CT numbers of livers were measured in the left
lateral, right anterior, and right posterior segments devoid
of blood vessels, bile ducts, focal hepatic lesions, calci-
fications, and artifacts, and the numbers obtained were
averaged. Quantitative degrees of contrast enhancement
are expressed as CT numbers increases from unenhanced
to contrast-enhanced axial images (ΔHU).
2.4. Qualitative Image Analysis
Two radiologists (H. Kondo and S. G.) with 13 and 10
years of post-training experience of interpreting body CT
images, respectively, who were unaware of patient clini-
cal information and CT imaging parameters prospec-
tively and independently reviewed CT images. Each ra-
diologist first graded images alone, and subsequently,
consensus grades were reached by discussion.
Copyright © 2013 SciRes. OJRad