Identification of Phenotypic and Genotypic Variability among the Isolates of Ramularia areola of Brazilian Cotton
1894
The objective of the present investigation was to verify
phenotypic and genotypic variability among 16 R. areola
isolates collected from different geographical regions of
Brazil, through their virulence spectrum in the glass-
house and through ERIC- and REP-PCR and ITS1-5.8S-
ITS2 rDNA. The objective was also to comprehend rela-
tionship between their phenotypic and genotypic varia-
tion.
2. Material and Methods
Fungal Isolates: Out of the 23 isolates of R. areo la stud-
ied earlier for phenotypic variation [3], 16 isolates were
used in this study for phenotypic and genotypic variation
since other isolates had lost their pathogenicity due to
constant culturing in artificial media. These isolates are
considered representatives of the pathogen occurring
across the cotton growing areas of Brazil and their origin
is presented in Table 1. Fungal isolates were grown in
Petri plates containing V8 juice agar for three weeks, the
growth was scraped from the plates with distilled water
and a few drops of Tween 20 was added to the suspen-
sion. Conidial concentration was adjusted to 106 conidia
ml−1. Twenty five days old plants of three cotton geno-
types (FMT 701, FMT 02102996, CNPA BA 2003-2059)
grown in the glasshouse were inoculated individually.
Twelve plants of each cultivar were inoculated by a hand
sprayer till run off and were incubated in dark for 24 h at
approximately 80% humidity, and later were transferred
to the glass-house bench [3].
Disease Rating: Leaf of each plant showing the high-
est level of infection was scored 30 days after inoculation
using a visual scale of 0 - 3, where 0 = No symptoms of
the disease; 1 = Small pin point necrotic spots without
chlorosis, covering <1% leaf area infected, and incapable
of producing sporulation in a humid chamber under the
laboratory conditions; 2 = Symptoms typically angular
with chlorosis measuring 2 - 3 mm, covering > 1% leaf
area infected, with or without apparent sporulation; 3 =
Symptoms typically angular, coalescing, covering > 25%
leaf area infected, with or without apparent sporulation,
with severe chlorosis and causing premature death of the
leaves. For the purpose of identification of phenotypical
differences, disease ratings between 0 and 1 were con-
sidered Resistant (Incompatible reaction), and ratings be-
tween 2 and 3 were considered Susceptible (Compatible
reaction).
DNA Extraction: Fungal cultures were grown in Petri
plates containing 15 mL of V8-juice agar for three weeks,
the fungal growth was scraped from the plates and the
total DNA was extracted as described by Raeder &
Broda [7]. DNA was quantified by a DyNa Quant 200
Fluorometer (Pharmacia) and RNA was eliminated by
RNase (10 µg·mL−1).
ERIC- and REP-PCR: We used Enterobacterial Re-
petitive Intergenetic Consensus (ERIC) and Repetitive
Extragenic Palindromic Sequence (REP) PCR fingerprint-
ing, and the analysis of internal transcribed spacer of
rDNA to identify genetic variability of R. areola. Use of
the ERIC/REP-PCR was originally reported for genomic
fingerprints of phytopathogenic bacteria [8]. In the recent
years, ERIC/REP-PCR is also being used do detect ge-
netic variability among fungal pathogens of several crops
[9,10]. The sequences of the primers are ERIC1R—
5’-ATGTAAGCTCCTGGGGTTCAC-3’; ERIC2—5’-
AAGTAAGTGACTGGGGTGAGCG-3’; REP1R-1—5’-
IIICGICGICATCIGGC-3’; REP2-1—5’-ICGICTTAT-
CIGGCCTAC-3’. PCR reactions were performed in a
volume of 25 µL containing 10 mM Tris-HCl (pH 8.3),
50 mM KCl, 2 mM MgCl2, 200 uM dNTP, 1.3 uL of 1%
bovine serum albumin, 50 pmol of each primer, 100 ng
of genomic DNA, and 1 U of Taq polymerase (Invitro-
gen). Amplification was performed in a Thermal Cycler
(MJ research, Inc. Watertown, MA, USA) according to
Louws et al. [9] and the PCR products (25 µL) were
submitted to electrophoresis in 2.0% agarose gels and
stained with ethidium bromide.
ITS rDNA: The isolates were also assessed by the in-
ternal transcribed spacer of rDNA (PCR-RFLP), using
the procedure as initially used [10]. The amplification pro-
ducts were digested using randomly selected eight re-
striction enzymes (Alu I, Bam H1, Bgl II, Dra 1, Eco R1,
Hae III, Hind III, and Hinf 1). The products of digestion
were separated through the gel electrophoresis in 2%
agarose. The reaction was analyzed in a total volume of
20 µL containing 1.5 µL of restriction enzyme. DNA di-
gestion was performed according to the instructions of
the supplier. All the amplifications and digestions were
repeated at least once to make sure the repeatability of
the reactions.
3. Results and Discussion
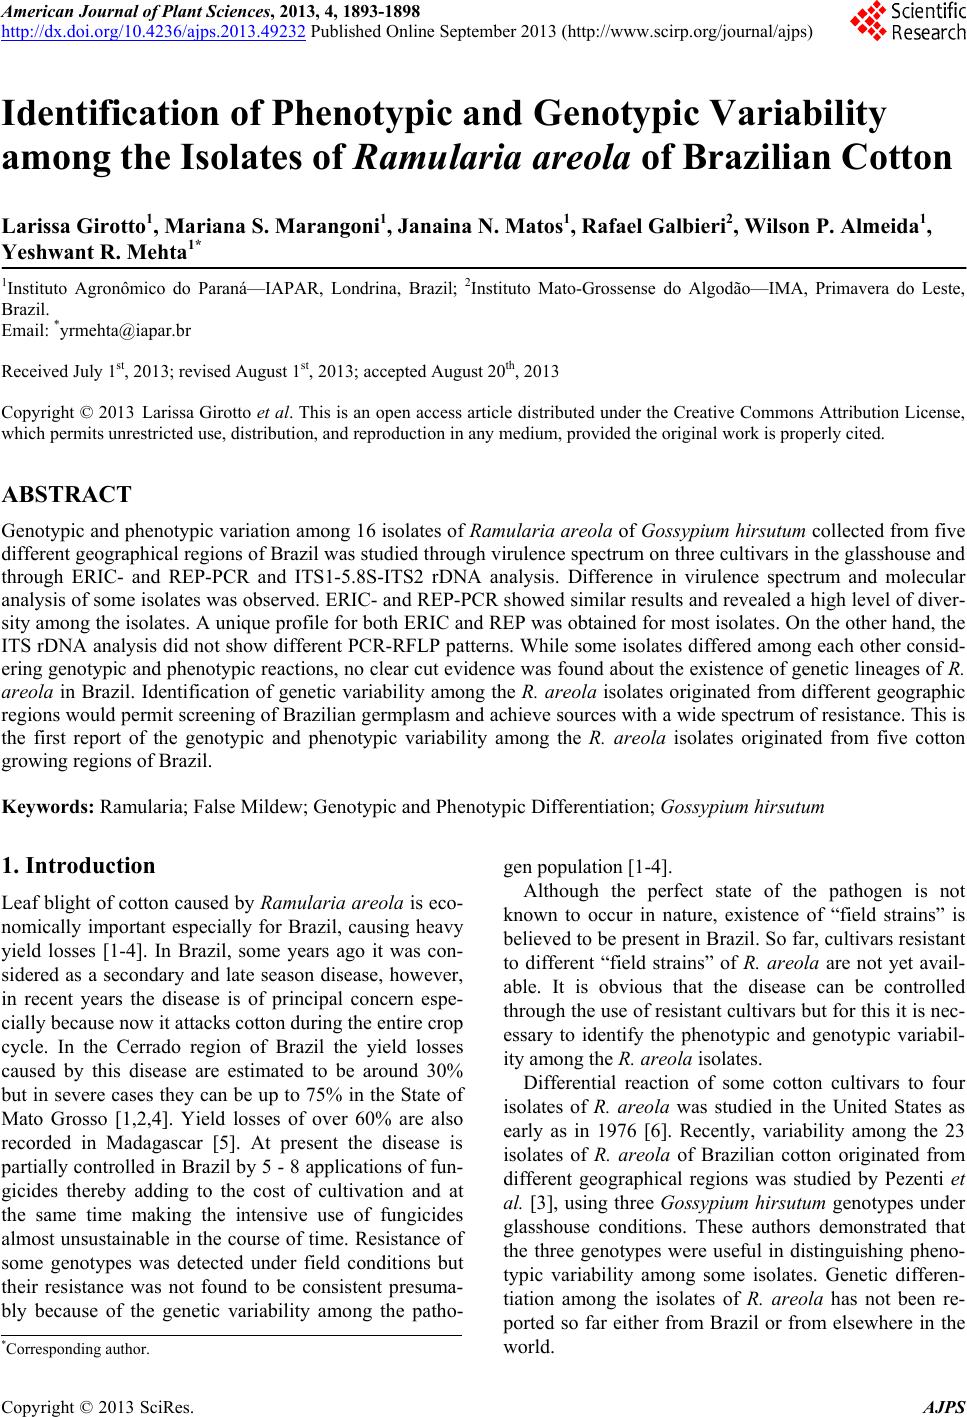
In glasshouse inoculations virulence spectrum showed
phenotypic variation among some isolates. Although the
resistance of genotypes CNPA BA-2003-2059 and FMT
02102996 as identified in earlier studies is governed by
two different genes [2,4], these genotypes showed a sus-
ceptible reaction to three isolates 13.2, 17.5 and 58.4
originated from three different Brazilian States (Ta ble 1 ).
With the exception of isolates 22.3 and 42.7, genotype
FMT 701 was susceptible to all the 16 isolates of R. are-
ola. These results confirm the earlier findings [3].
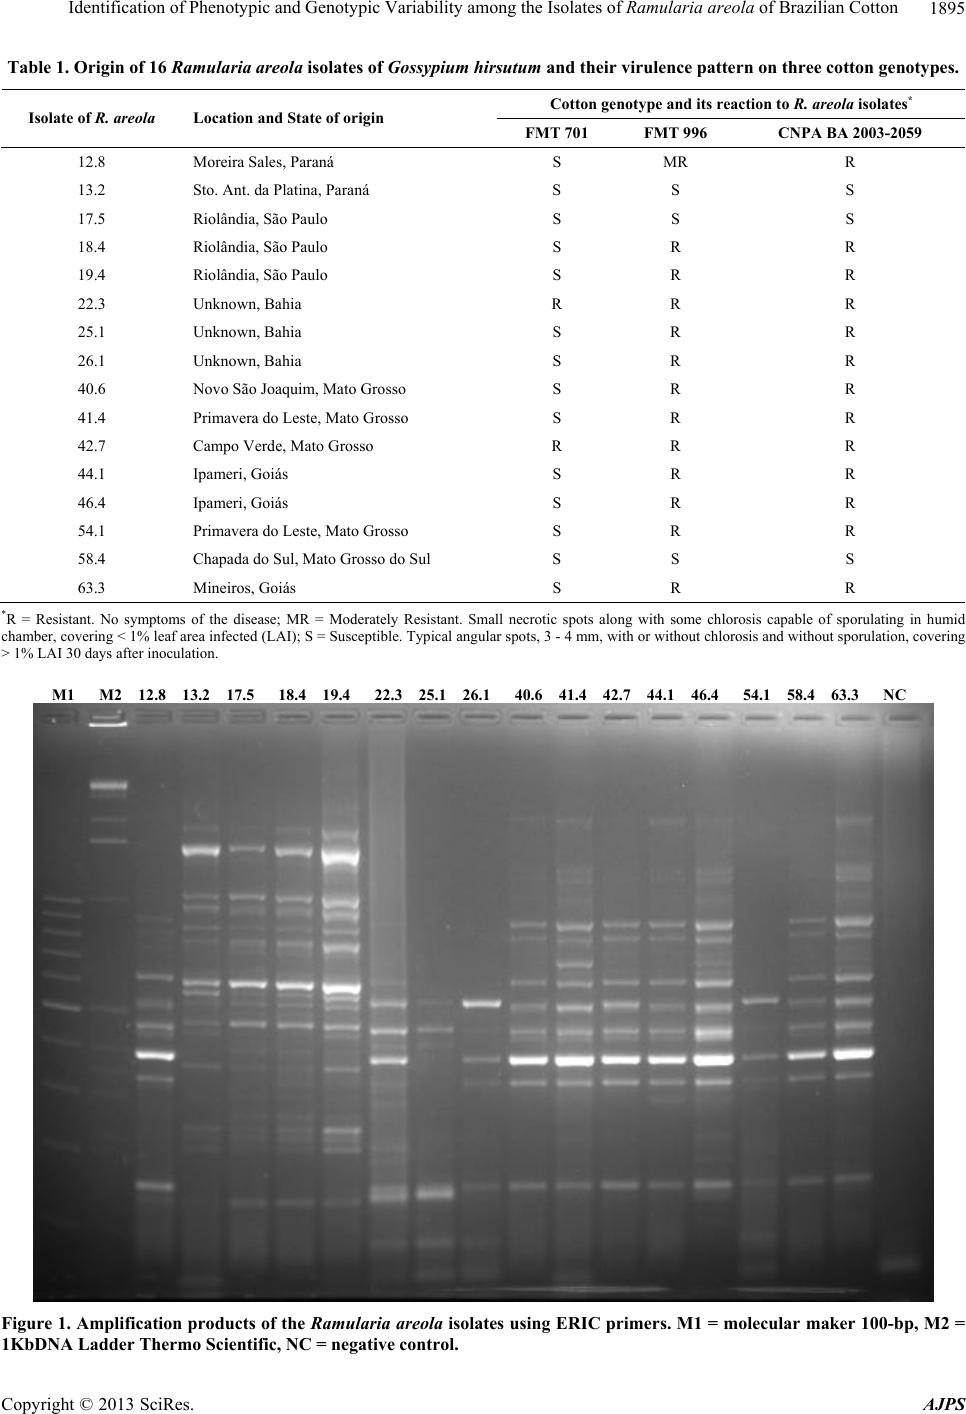
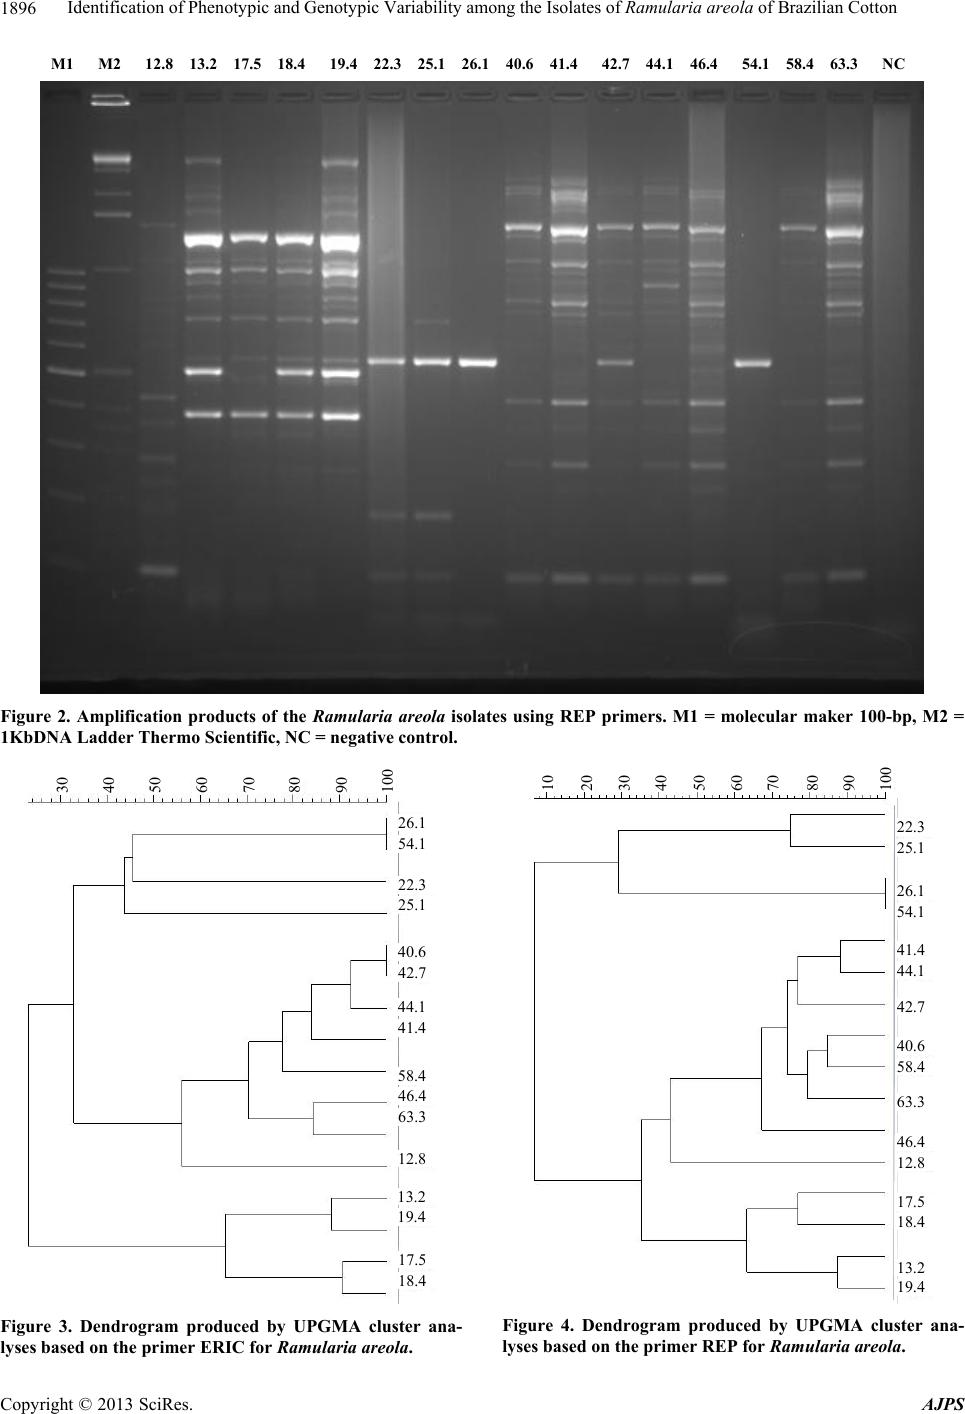
The ERIC/REP primers revealed polymorphism among
the isolates. The number of bands varied from 4 to 15 and
their sizes ranged from 150 to 1000 bp (Figures 1 and 2).
The dendrograms showed almost a unique profile for both
RIC and REP analysis for most isolates (Figures 3 and 4). E
Copyright © 2013 SciRes. AJPS