 iBusiness, 2013, 5, 77-85 http://dx.doi.org/10.4236/ib.2013.53010 Published Online September 2013 (http://www.scirp.org/journal/ib) 77 Empirical Study on Usability Impact Factors of Electronic Wallet-One Card Solution within College Students* Jiangping Wan1,2, Ming Zeng1, Lianyu Liang1 1School of Business Administration, South China University of Technology, Guangzhou, China; 2Institute of Emerging Industriali- zation Development, South China University of Technology, Guangzhou, China. Email: scutjsp@126.com, zm889091@sohu.com, jade_go@163.com Received June 30th, 2013; revised July 25th, 2013; accepted August 4th, 2013 Copyright © 2013 Jiangping Wan et al. This is an open access article distributed under the Creative Commons Attribution License, which permits unrestricted use, distribution, and reproduction in any medium, provided the original work is properly cited. ABSTRACT Empirical study on usability impact factors of electronic wallet-one card solution within college students includes the analysis of the current situation within the electronic wallet-one card solution for college students, the analysis of be- havior habit within using the electronic wallet-one card solution for college students, and sets up a preliminary usability evaluation indicator system of electronic wallet-one card solution for college students, and the factor analysis for us- ability evaluation indicator system through the questionnaire. According the result of factor analysis, we set up an im- proved usability evaluation indicator system of electronic wallet-one card solution for college students. The purpose of the study is to improve the usability of electronic wallet-one card solution. Keywords: Electronic Wallet; One Card Solution; Usability; Factor Analysis; Empirical Study 1. Introduction The definition of electronic wallet has narrow and broad sense. Electronic wallet in the narrow sense refers to a kind of payment tool commonly used in activities of daily living and shopping, and it is suitable for small shopping [1]. Electronic purse generalization is no longer confined to a stored-value card, it also includes digital cash from the bank or the family of electronic wallet and other kinds of electronic money, it can also be consumed correctly in the POS machine, be carried out by online consumer and internet consumer. Electronic money is stored in the elec- tronic wallet, such as electronic cash, electronic money, Alipay, TenPay, baifubao, new pay, Yee Pay, China mo- bile phone payment [2]. With low transaction costs, con- venient and fast, high penetration rate as the carrier of electronic purse (intelligent mobile phone), low interfer- ence, electronic wallet gets more and more groups favor. One Card Solution is to realize the intelligent man- agement of various functions in the same card. Its core content is to bring about the standardization and automa- tion of the information resource management from the generation, collection, transmission to the summary analysis of business data by using the particular physical media of the card. From the perspective of industry ap- plication, one card solution can be divided into: campus one card solution, business one card solution, park one card solution, city one card solution (bus one card solu- tion, super highway one card solution, social security etc. IC collection fee, all that can be seen as a city card) [3]. This paper is organized in the following: Section 2 is a literature review, which focuses on the theory of usability, the theory of usability and user experience, and the in- troduction of tools and methods of electronic wallet-one card solution for college students. Section 3 is setting up a preliminary usability evaluation indicator system of electronic wallet-one card solution for college students. Section 4 is analyzing the usability evaluation indicator system using a factor analysis method. Section 6 is the conclusion. 2. Literature Review International organization for standard ISO9241-11 shows the definition of usability is “a product can be used by specified users with effectiveness, efficiency and satisfaction in a specified environment” [4]. Effective- ness refers to the degree of correctness and completeness of the user to fulfill a particular task and achieve the spe- cific goal, namely whether users can use products to do what they want; Efficiency refers to the ratio of effec- *This research was supported by Key Project of Guangdong Province Education Office (06JDXM63002), NSF of China (70471091), and QualiPSo (IST-FP6-IP-034763). Copyright © 2013 SciRes. IB  Empirical Study on Usability Impact Factors of Electronic Wallet-One Card Solution within College Students 78 tiveness with the use of resources (e.g., time); Satisfac- tion refers to users’ subjective satisfaction and accep- tance in the process of using products. Hartson believes usability has two meanings: usefulness and ease of use. Usefulness means whether the product can implement a series of functions. Ease of use refers to the interaction efficiency between the user and the interface, the learn- ability, and user’s satisfaction [5]. Jacob Nielsen, the American guru the Web ease of use, believes that usabil- ity is not a unit attribute of the user interface, the product will have high usability only when each element achieve good level. Usability has many components, and it has association with the following five dimensions of usabil- ity traditionally [6]: 1) Learnability: whether the product is easy to learn, and the user can begin to complete the task with the system in a short time; 2) The interaction efficiency: the efficiency for the user to use the product to complete specific tasks; 3) Memorability: the usage of the product is easy to remember, which means the user who does not use the product frequently can still re- member how to operate it after a period of time, without learning from scratch; 4) The error rate and severity: us- ers can make least error in the process of using the prod- uct, or it can avoid serious disasters caused by the mis- take; 5) Customer satisfaction: users can feel satisfied or even delighted after using the product. There are four criteria of usability engineering indica- tor (Table 1). For the user, user experience is the subjective feeling of the user to the product, and is the sum of the contents of what the user feels and obtains in the process of using the product [7]. Usability is a kind of overall experience, and is an important product of interactive IT product/ system. For the user, usability means whether the product is effective, easy to learn, efficient, easy to remember, little fault, and how is the efficiency and subjective feel- ing when he finish the task with the product. It involves three important usability information [8]: the intended use, the environmental conditions and the usability met- rics (Figure 1). Factor analysis method is a technology to simplify multivariate, with the purpose to decompose the original variables, and to generalize the potential “category”. The indicators with strong correlation will be classified as the same category. Each kind of variable represents a general factor, and there are little correlations between different categories. Thus the several original correlative indica- tors can be combined into a few independent indicators which can fully reflect the overall information, and it can solve the multi-collinearity problem between the vari- ables on the premise of not losing the main information [10]. Factor analysis generally can be divided into the following five steps [11]: 1) confirm whether it is suit- able for factor analysis; 2) extract common factors, and confirm the number of factors and the method to calcu- Table 1. Usability engineering standards. Standards Usability Factors ISO9241-11 ISO9241-10 Jakob Nielsen Human-computer Interaction Effectiveness √ √ Efficiency √ √ √ Satisfaction √ √ √ Memorability √ √ Suitability for learning √ √ √ Error tolerance √ √ √ Suitability for task √ √ Consistency √ √ Suitability for individualization √ √ Controllability √ √ Self-descriptiveness √ √ Utility √ Compatibility √ Proximity √ Legibility or audibility √ Identifiable √ Feedback √ Minimized memory load √ Shortcut √ Copyright © 2013 SciRes. IB  Empirical Study on Usability Impact Factors of Electronic Wallet-One Card Solution within College Students 79 late the factors; 3) make the factors with more named interpretability; 4) determine and name factors; 5) calcu- late factor score of each sample. The research of this pa- per is based on an empirical study on usability impact factors of electronic wallet-one card solution within col- lege students. 3. The Preliminary Usability Evaluation Indicator System of the Electronic Wallet-One Card Solution 3.1. The Analysis of the Current Situation for the Electronic Wallet Electronic wallet is an important part of electronic trad- ing, the transaction size of electronic trading scale in China reached 7 trillion in 2011, increased by 46.4% (note: data from iResearch: the release of the E-com- merce core data of Q4 and annual 2011 in China). Today, the most widely used field of the electronic wallet is the electronic ticket system of city public transportation. They are convenient for citizens to go out, and have been extended gradually in all cities of China. The characteris- tics of electronic wallets, which are secure, convenient, efficient and fast, can satisfy the requirements of secure payment for today’s electronic commerce, especially for the small-amount shopping. After two expansions of university enrollment, college students have become a special large consumer group, and they have both real consumption ability and consumption potential in the future. With the deepening of college informatization degree, the use of electronic wallet increase every day, as well as the use size of college students, such as bus IC card, campus-one card solution (eating, shopping, cam- pus consumption), mobile phone card, and pay treasure. The college students’ consumption is getting more and more attention. It was reported that, in 2004, college stu- dents’ average consumption amount had exceeded the national average annual disposable amount [12]. The fac- tors affect students’ use of electronic wallet include col- lege students’ cognition degree of electronic wallet, the intention to use, the affordability of terminal equipment price, the concentration degree, after-sales service to- gether with students’ cognitive preferences, habits, ide- ology, safety performance. 3.2. The Analysis of User Behavior E.S. Lewis (1898) proposed the traditional consumer behavior model: attention to products, interested, gener- ate purchase desire, get memories, and purchase action (ADIMA mode) (Figure 2). But with the arrival of in- formation age, the behavior model has translated into: attention to products, interested, information search, purchase action and information sharing. Dentsu pro- posed the AISAS model later, aiming at consumers life- style change in the Internet and wireless applications era (Figure 3). Electronic wallet users’ behavior pattern has and simi- larities with that of the information age users, namely they understand the electronic wallet by friends or through the Internet, thereby become interested in the electronic wallet and generate using behavior, then the satisfaction or realization of the function and demand will be produced during the process of use, which prompts the next action, and the introduction of the elec- tronic wallet, realizing the information sharing (Figure 4). Through the market research reports of the electronic wallet and the actual results of related interviews, three factors, the usage terminal and scenario, the main behav- Product User Task Equipment Environment Anticipated goalGoals Usability: the effectiveness, efficiency and subjective Effectiveness Efficiency Subjective Interaction Usability evaluation Figure 1. The relationship between the usability and user experience [9]. Attention Interest Desire Memory Action AIDMA Model Figure 2. AIDMA model [13]. Copyright © 2013 SciRes. IB  Empirical Study on Usability Impact Factors of Electronic Wallet-One Card Solution within College Students 80 Attention Interest Search Action Share AISAS Model Figure 3. AISAS model [13]. Friends/Ad Interest Action PC behavior Satisfaction Share Figure 4. The real consumer behavior model of the elec- tronic wallet. ior modes and the factors impact using the electronic wallet, were used to analyze the user behavior in this paper. In terms of the usage terminal and scenario, the scene of using the electronic wallet-one card solution for most electronic wallet users can be divided into four categories: eating in the dining hall, consuming in the supermarket, taking a bus, taking the subway. Function is the priority for user when using the electronic wallet, so the user may not consider the fast operation speed of. Generally, the user needs the adaptation time after their first use of an electronic wallet, for the inadaptability in changing habits. But after the first use, the user will get satisfaction, and it will promote the use of next time. The vast majority of the user’s behavior patterns accord with the consumption pattern mentioned above (Figure 3). As the factors that affect users’ using of the electronic wallet, users will be affected by the function and safety of the electronic wallet-one card solution, and it will also have influence whether it can give users the “aesthetic feeling”, as well as the user’s feelings and emotions. The forma- tion process of the user behavior habit of the electronic wallet was concluded (Figure 5). 3.3. The Determination of Usability Evaluation Indicator According to the above analysis, the usability evaluation indicator system of the electronic wallet-one card solu- tion (Table 2) were built, which were certificated in four dimensions, cognition, functionality, ease of use, and satisfaction respectively. Specifically, cognition factor includes three indicators: the target users, environmental conditions, and the future prospects. Different users, dif- ferent environmental conditions and the views towards the prospects of the electronic wallets have effect on the user’s cognition of the electronic wallet-one card solution; Functionality factor includes 5 indicators: effectiveness, compatibility, security, extensibility and practicability. Whether the electronic wallets can finish the task that users need or not, and whether it have compatibility, well security, and extensibility will influence its function; Ease of use factor includes 4 indicators: learnability, memorability, controllability, and operational efficiency, which directly affect its usability; Satisfaction factor in- cludes 5 indicators: dependence degree, professional de- gree, tangibles, the same degree, and reactivity. 4. Factor Analysis for Usability Evaluation Indicator System 4.1. The Design of the Questionnaire 4.1.1. The Aim of the Questionnaire Through related literature reference and the typical user interviews, we preliminary determine usability evalua- tion indicator system of electronic wallet-one card solu- tion for college students, and design the questionnaire on the basis of the preliminary usability evaluation indicator system of electronic wallet-one card solution for college students, we improve the indicator system according to the feedback and suggestions of the questionnaire, the weight of each indicator will be supported by the results of the questionnaire analysis. 4.1.2. The Principles of Questionnaire Design The results of questionnaire survey will determine the structure of usability evaluation indicator system of elec- tronic wallet-one card solution for college students and the weight of each indicator, questionnaire design is a prerequisite condition whether it can get a scientific sur- vey result, therefore questionnaire design must follow: 1) rationality: rationality refers to the questionnaire must be closely related with the investigation subject, otherwise, it may appear different results; 2) generality: generality refers to the setting of issue should be of universal sig- nificance, avoid excessive details or too many special case problems; 3) logicality: logicality refers to ques- tionnaire design should have associative perception, namely problems should have logicality between each other, can’t have logical errors, the questionnaire should be a small system of relatively perfect; 4) clarity: clarity refers to the setting of problems must be standardized, clear, easy to answer; 5) non-inducible: non-inducible refers to the setting of problems should be at a neutral position, no prompt or subjective assumption, can’t re- strict the independence and objectivity of is the respon- Copyright © 2013 SciRes. IB  Empirical Study on Usability Impact Factors of Electronic Wallet-One Card Solution within College Students 81 Function of electronic wallet Scope of influence, applicability Objective environmental, social and cultural background Objective condition Visual ex erience Interaction experience Similar operating experience Subjective experience Usability impression Figure 5. The formation process of the user behavior habit. Table 2. The usability evaluation indicator system of the electronic wallet-one card solution. Research object First grade indicator Second grade indicator X1: The target users X2: The environmental conditions Cognition X3: The future prospects X4: Effectiveness X5: Compatibility X6: Security X7: Extensibility Functionality X8: Practicability X9: Learnability X10: Memorability X11: Controllability Usability X12: Operational efficiency X13: Reliability X14: Assurance X15: Tangibles X16: Empathy Empirical study on usability impact factors of electronic wallet-one card solution within college students Satisfaction X17: Responsiveness Dents; 6) facilitate the collation and analysis: Good ques- tionnaire should consider not only the combination of survey subjects and convenient collection of information, but also consider the results of the survey are easier to obtain and have a great convincingness. So it must take into account the collation and analysis work after ques- tionnaire survey. 4.1.3. The Questionnaire Design We design the usability evaluation indicator system of electronic wallet-one card solution for college students according to the above principles, its basic structure is as follows: the first part explains the purpose of the investi- gation. The second part is the questionnaire survey in- structions, explaining the significance of the score rating and the score to the respondents. Investigation uses the 10 scale, scores from the 1 - 10, the importance increase successively. The third part is the survey respondents give the rating scale of indicator. According to the above, this paper selects 17 indicators, in order to avoid ambigu- ity, we have explanation to part of indicator in the design of the questionnaire. The fourth part is the personal in- formation of the respondents. 4.1.4. Dat a Col l ecti on This paper-empirical study on usability impact factors of electronic wallet-one card solution within college stu- dents, positions the investigation object in college stu- dents, especially sophomore, junior, senior students, de- signs the questionnaire using a written form, collects the questionnaires filled by the students, eliminates some questionnaires which do not meet the requirements, col- lates and counts up the questionnaire results using the list form, prepares for the using of factor analysis. 4.2. Correlation Analysis of Evaluation Indicator When we are using the factor analysis, if the original variables are independent between each other, related degree is very low, there is no information overlap, there is no common factor among all the variables, then it would not comprehensive and concentrated, so there is no need to carry on the factor analysis, so it must have a set of analysis for statistical data to determine whether there is a strong correlation between factors, whether it is suitable for factor analysis, SPSS provides the KMO test and Bartlett test of sphericity for us to confirm the corre- lation factor. We operate the data of the questionnaire by using SPSS and get the results (Tables 3 and 4). Through the test results of Tables 3 and 4, from the correlation coefficient matrix of the initial variables, we know the correlation coefficient of X1 and X2 (0.956), X1 and X3 (0.980) etc. are large, and the corresponding Sig value is small, it indicates they have more obvious corre- lation between these variables, at the same time the KMO value of the sample is 0.704, the P value of Bartley’s test of spherical is 0, so it is suitable for apply- ing the factor analysis. 4.3. Determination of Main Factors In the factor analysis, we extract and colligate factor based on the sample data using the principal component analysis method. We get the results by operating related operations using SPSS (Tables 5 and 6). 4.3.1. Extract Main Factors We extract the principal factors using the principal com- ponents analysis method, the number of principal factors is determined by the Kaiser standard (namely eigenvalue greater than 1). According to Table 5, the corresponding eigenvalue of 4 factors are greater than 1, respectively Copyright © 2013 SciRes. IB 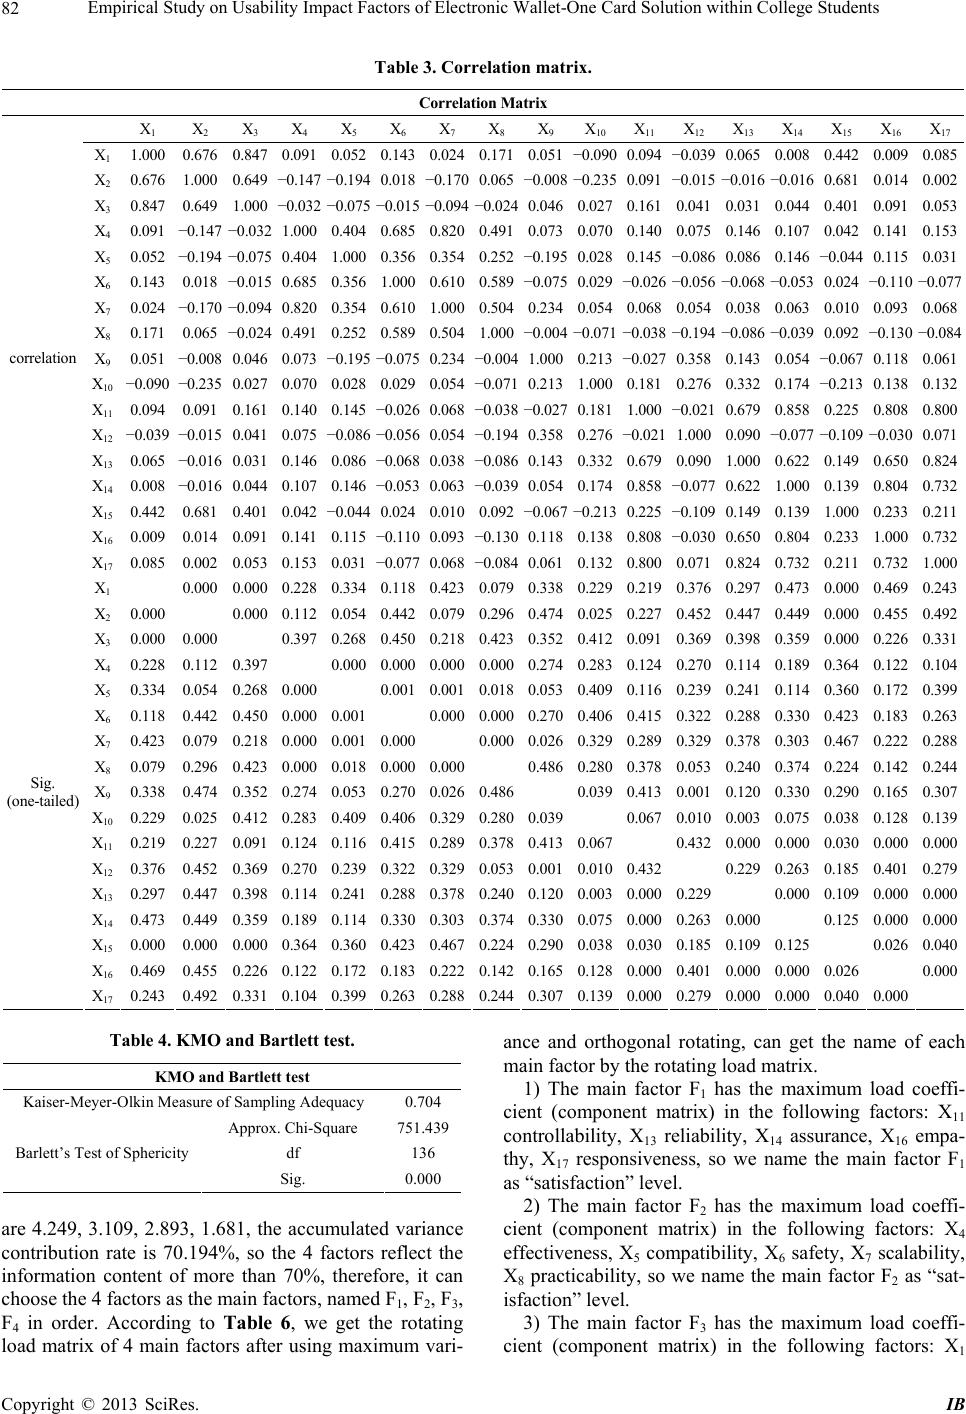 Empirical Study on Usability Impact Factors of Electronic Wallet-One Card Solution within College Students Copyright © 2013 SciRes. IB 82 Table 3. Correlation matrix. Correlatio n Matrix X1 X2 X3 X4 X5 X6 X7 X8 X9 X10 X11 X12 X13 X14 X15 X16 X17 X1 1.000 0.676 0.847 0.091 0.052 0.1430.0240.1710.051−0.090 0.094 −0.0390.065 0.008 0.442 0.0090.085 X2 0.676 1.000 0.649 −0.147 −0.194 0.018−0.170 0.065−0.008−0.2350.091 −0.015 −0.016 −0.016 0.681 0.0140.002 X3 0.847 0.649 1.000 −0.032 −0.075 −0.015 −0.094−0.0240.0460.0270.1610.0410.031 0.044 0.401 0.0910.053 X4 0.091 −0.147 −0.032 1.000 0.404 0.6850.8200.4910.0730.0700.1400.0750.146 0.107 0.042 0.1410.153 X5 0.052 −0.194 −0.075 0.404 1.000 0.3560.3540.252−0.1950.0280.145 −0.0860.086 0.146 −0.044 0.1150.031 X6 0.143 0.018 −0.015 0.685 0.356 1.0000.6100.589−0.075 0.029 −0.026 −0.056−0.068 −0.053 0.024 −0.110 −0.077 X7 0.024 −0.170 −0.094 0.820 0.354 0.6101.0000.5040.2340.0540.0680.0540.038 0.063 0.010 0.0930.068 X8 0.171 0.065 −0.024 0.491 0.252 0.5890.5041.000−0.004 −0.071 −0.038 −0.194−0.086 −0.039 0.092 −0.130 −0.084 X9 0.051 −0.008 0.046 0.073 −0.195 −0.075 0.234 −0.0041.0000.213−0.0270.3580.143 0.054 −0.067 0.1180.061 X10 −0.090 −0.235 0.027 0.070 0.028 0.0290.054−0.0710.2131.0000.1810.2760.332 0.174 −0.213 0.1380.132 X11 0.094 0.091 0.161 0.140 0.145 −0.0260.068 −0.038 −0.0270.1811.000 −0.0210.679 0.858 0.225 0.8080.800 X12 −0.039 −0.015 0.041 0.075 −0.086 −0.056 0.054 −0.1940.3580.276 −0.0211.0000.090 −0.077 −0.109 −0.0300.071 X13 0.065 −0.016 0.031 0.146 0.086 −0.0680.038 −0.0860.1430.3320.6790.0901.000 0.622 0.149 0.6500.824 X14 0.008 −0.016 0.044 0.107 0.146 −0.0530.063 −0.0390.0540.1740.858 −0.0770.622 1.000 0.139 0.8040.732 X15 0.442 0.681 0.401 0.042 −0.044 0.0240.0100.092−0.067 −0.213 0.225−0.1090.149 0.139 1.000 0.2330.211 X16 0.009 0.014 0.091 0.141 0.115 −0.1100.093 −0.130 0.1180.1380.808 −0.0300.650 0.804 0.233 1.0000.732 correlation X17 0.085 0.002 0.053 0.153 0.031 −0.0770.068 −0.0840.0610.1320.8000.0710.824 0.732 0.211 0.7321.000 X1 0.000 0.000 0.228 0.334 0.1180.4230.0790.3380.2290.2190.3760.297 0.473 0.000 0.4690.243 X2 0.000 0.000 0.112 0.054 0.4420.0790.2960.4740.0250.2270.4520.447 0.449 0.000 0.4550.492 X3 0.000 0.000 0.397 0.268 0.4500.2180.4230.3520.4120.0910.3690.398 0.359 0.000 0.2260.331 X4 0.228 0.112 0.397 0.000 0.0000.0000.0000.2740.2830.1240.2700.114 0.189 0.364 0.1220.104 X5 0.334 0.054 0.268 0.000 0.0010.0010.0180.0530.4090.1160.2390.241 0.114 0.360 0.1720.399 X6 0.118 0.442 0.450 0.000 0.001 0.0000.0000.2700.4060.4150.3220.288 0.330 0.423 0.1830.263 X7 0.423 0.079 0.218 0.000 0.001 0.000 0.0000.0260.3290.2890.3290.378 0.303 0.467 0.2220.288 X8 0.079 0.296 0.423 0.000 0.018 0.0000.000 0.4860.2800.3780.0530.240 0.374 0.224 0.1420.244 X9 0.338 0.474 0.352 0.274 0.053 0.2700.0260.486 0.0390.4130.0010.120 0.330 0.290 0.1650.307 X10 0.229 0.025 0.412 0.283 0.409 0.4060.3290.2800.039 0.0670.0100.003 0.075 0.038 0.1280.139 X11 0.219 0.227 0.091 0.124 0.116 0.4150.2890.3780.4130.067 0.4320.000 0.000 0.030 0.0000.000 X12 0.376 0.452 0.369 0.270 0.239 0.3220.3290.0530.0010.0100.432 0.229 0.263 0.185 0.4010.279 X13 0.297 0.447 0.398 0.114 0.241 0.2880.3780.2400.1200.0030.0000.229 0.000 0.109 0.0000.000 X14 0.473 0.449 0.359 0.189 0.114 0.3300.3030.3740.3300.0750.0000.2630.000 0.125 0.0000.000 X15 0.000 0.000 0.000 0.364 0.360 0.4230.4670.2240.2900.0380.0300.1850.109 0.125 0.026 0.040 X16 0.469 0.455 0.226 0.122 0.172 0.1830.2220.1420.1650.1280.0000.4010.000 0.000 0.026 0.000 Sig. (one-tailed) X17 0.243 0.492 0.331 0.104 0.399 0.2630.2880.2440.3070.1390.0000.2790.000 0.000 0.040 0.000 Table 4. KMO and Bartlett test. KMO and Bartlett test Kaiser-Meyer-Olkin Measure of Sampling Adequacy 0.704 Approx. Chi-Square 751.439 df 136 Barlett’s Test of Sphericity Sig. 0.000 are 4.249, 3.109, 2.893, 1.681, the accumulated variance contribution rate is 70.194%, so the 4 factors reflect the information content of more than 70%, therefore, it can choose the 4 factors as the main factors, named F1, F2, F3, F4 in order. According to Table 6, we get the rotating load matrix of 4 main factors after using maximum vari- ance and orthogonal rotating, can get the name of each main factor by the rotating load matrix. 1) The main factor F1 has the maximum load coeffi- cient (component matrix) in the following factors: X11 controllability, X13 reliability, X14 assurance, X16 empa- thy, X17 responsiveness, so we name the main factor F1 as “satisfaction” level. 2) The main factor F2 has the maximum load coeffi- cient (component matrix) in the following factors: X4 effectiveness, X5 compatibility, X6 safety, X7 scalability, X8 practicability, so we name the main factor F2 as “sat- isfaction” level. 3) The main factor F3 has the maximum load coeffi- cient (component matrix) in the following factors: X1  Empirical Study on Usability Impact Factors of Electronic Wallet-One Card Solution within College Students 83 Table 5. Eigenvalue and variance contribution rate. Total variance explained Initial eigenvalues Extraction sums of squared loadings Rotation sums of squared loadings Component Total % of Variance Cumulative %Total % of VarianceCumulative %Total % of Variance Cumulative % 1 4.249 24.996 24.996 4.249 24.996 24.996 4.131 24.301 24.301 2 3.109 18.290 43.287 3.109 18.290 43.287 3.124 18.378 42.679 3 2.893 17.018 60.305 2.893 17.018 60.305 2.928 17.226 59.905 4 1.681 9.889 70.194 1.681 9.889 70.194 1.749 10.289 70.194 5 0.991 5.830 76.025 6 0.763 4.486 80.510 7 0.679 3.997 84.507 8 0.544 3.197 87.705 9 0.491 2.891 90.596 10 0.463 2.726 93.322 11 0.326 1.917 95.239 12 0.191 1.123 96.362 13 0.175 1.030 97.392 14 0.145 0.852 98.244 15 0.120 0.707 98.951 16 0.103 0.608 99.559 17 0.075 0.441 100.000 Extraction method: principal component analysis Table 6. Factor load matrix after rotating. Rotated component matrixa Component 1 2 3 4 X1 0.007 0.131 0.887 0.040 X2 −0.027 −0.110 0.898 −0.094 X3 0.041 −0.058 0.861 0.125 X4 0.134 0.886 −0.018 0.147 X5 0.154 0.552 −0.137 −0.219 X6 −0.105 0.846 0.066 −0.034 X7 0.052 0.860 −0.063 0.210 X8 −0.119 0.734 0.121 −0.143 X9 0.024 0.022 0.060 0.752 X10 0.221 0.021 −0.183 0.584 X11 0.924 0.046 0.113 −0.032 X12 −0.038 −0.067 −0.003 0.762 X13 0.830 0.006 0.019 0.211 X14 0.900 0.032 −0.005 −0.038 X15 0.210 0.031 0.704 −0.217 X16 0.895 0.003 0.046 0.024 X17 0.900 0.004 0.059 0.080 Extraction method: principal component analysis target users, X2 environmental conditions, X3 future pros- pects, X15 tangibles, so we name the main factor F3 as “satisfaction” level. 4) The main factor F4 has the maximum load coeffi- cient (component matrix) in the following factors: X9 learnability, X10 memorability, X12 operational efficiency, so we name the main factor F4 as “satisfaction” level. 4.3.2. The Correlation and Reliability Analysis of Main Factors We perform relevant operation for the questionnaire data using SPSS and get the results as follows (Tables 7 and 8): Ta ble 7 shows that 6 main factors are completely or- thogonal selected by factor covariance matrix, namely the 6 main factors are highly uncorrelated. They reflect independently 6 party of usability evaluation indicator system. At the same time, we can see from Table 8, the Cronbach’s Alpha’s α coefficient value of 4 main factors are 0.851 (F3), 0.843 (F4), 0.838 (F2), 0.937 (F1). The Cronbach’s Alpha’s α coefficient value of 4 main factors are greater than 0.8, so we can think the factor structure has great consistency and validity. 4.3.3. Sol vi ng the Weight of Factors 1) The weight of the main factors Factor variance contribution refers to the main factors provides the variance contribution sum for all variables, it is an indicator which measures the relative importance of the main factors, the variance contribution is greater, Copyright © 2013 SciRes. IB 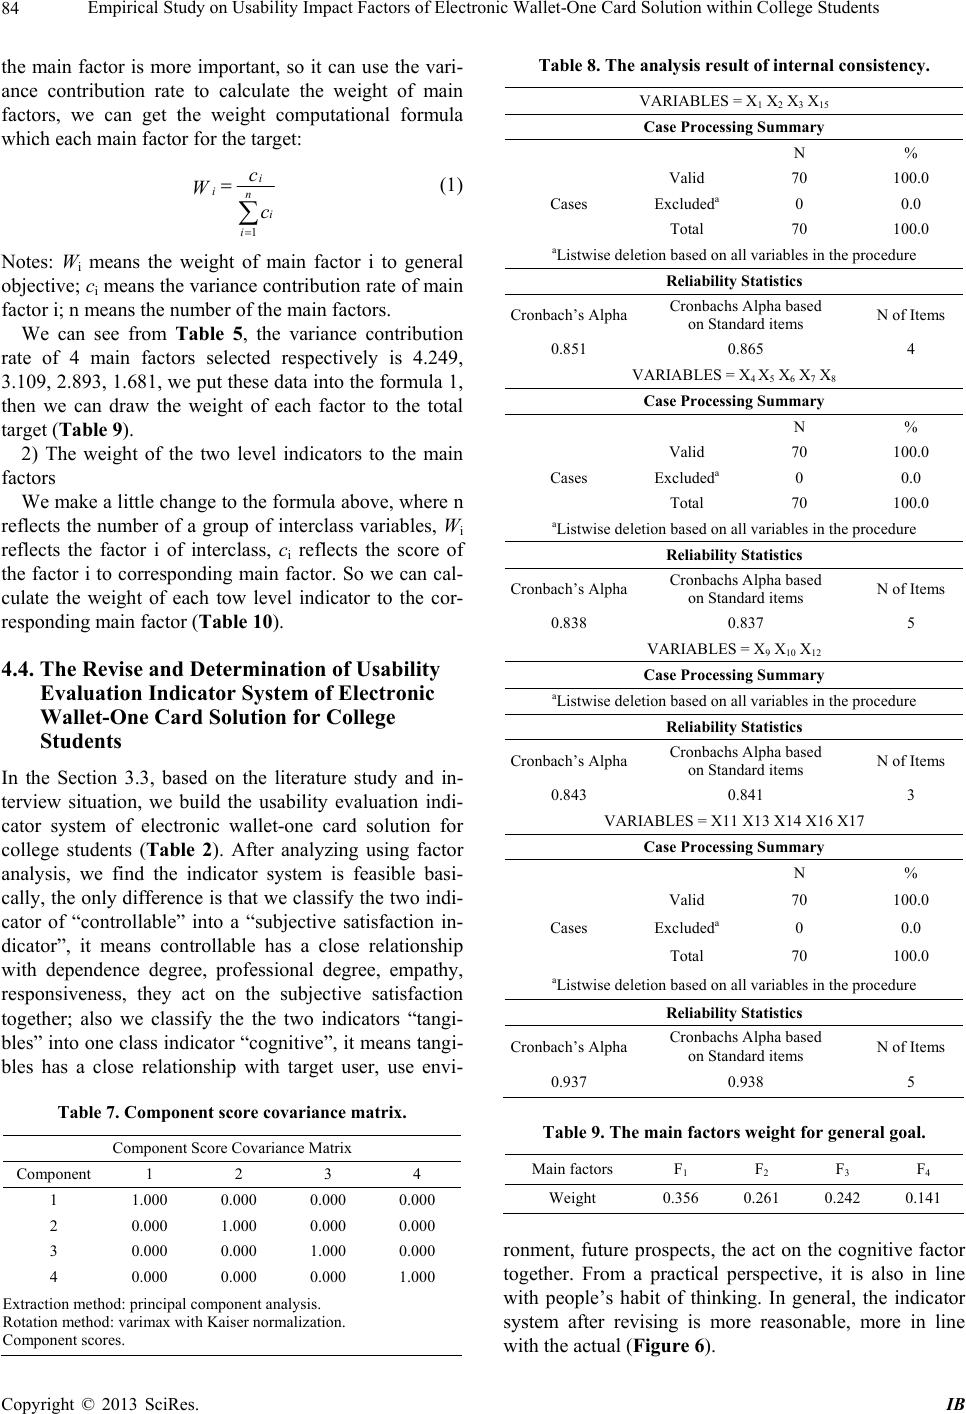 Empirical Study on Usability Impact Factors of Electronic Wallet-One Card Solution within College Students 84 the main factor is more important, so it can use the vari- ance contribution rate to calculate the weight of main factors, we can get the weight computational formula which each main factor for the target: 1 i in i i c W c (1) Notes: Wi means the weight of main factor i to general objective; ci means the variance contribution rate of main factor i; n means the number of the main factors. We can see from Table 5, the variance contribution rate of 4 main factors selected respectively is 4.249, 3.109, 2.893, 1.681, we put these data into the formula 1, then we can draw the weight of each factor to the total target (Table 9). 2) The weight of the two level indicators to the main factors We make a little change to the formula above, where n reflects the number of a group of interclass variables, Wi reflects the factor i of interclass, ci reflects the score of the factor i to corresponding main factor. So we can cal- culate the weight of each tow level indicator to the cor- responding main factor (Table 10). 4.4. The Revise and Determination of Usability Evaluation Indicator System of Electronic Wallet-One Card Solution for College Students In the Section 3.3, based on the literature study and in- terview situation, we build the usability evaluation indi- cator system of electronic wallet-one card solution for college students (Table 2). After analyzing using factor analysis, we find the indicator system is feasible basi- cally, the only difference is that we classify the two indi- cator of “controllable” into a “subjective satisfaction in- dicator”, it means controllable has a close relationship with dependence degree, professional degree, empathy, responsiveness, they act on the subjective satisfaction together; also we classify the the two indicators “tangi- bles” into one class indicator “cognitive”, it means tangi- bles has a close relationship with target user, use envi- Table 7. Component score covariance matrix. Component Score Covariance Matrix Component 1 2 3 4 1 1.000 0.000 0.000 0.000 2 0.000 1.000 0.000 0.000 3 0.000 0.000 1.000 0.000 4 0.000 0.000 0.000 1.000 Extraction method: principal component analysis. Rotation method: varimax with Kaiser normalization. Component scores. Table 8. The analysis result of internal consistency. VARIABLES = X1 X2 X3 X15 Case Processing Summary N % Valid 70 100.0 Excludeda 0 0.0 Cases Total 70 100.0 aListwise deletion based on all variables in the procedure Reliability Statistics Cronbach’s AlphaCronbachs Alpha based on Standard items N of Items 0.851 0.865 4 VARIABLES = X4 X5 X6 X7 X8 Case Processing Summary N % Valid 70 100.0 Excludeda 0 0.0 Cases Total 70 100.0 aListwise deletion based on all variables in the procedure Reliability Statistics Cronbach’s AlphaCronbachs Alpha based on Standard items N of Items 0.838 0.837 5 VARIABLES = X9 X10 X12 Case Processing Summary aListwise deletion based on all variables in the procedure Reliability Statistics Cronbach’s AlphaCronbachs Alpha based on Standard items N of Items 0.843 0.841 3 VARIABLES = X11 X13 X14 X16 X17 Case Processing Summary N % Valid 70 100.0 Excludeda 0 0.0 Cases Total 70 100.0 aListwise deletion based on all variables in the procedure Reliability Statistics Cronbach’s AlphaCronbachs Alpha based on Standard items N of Items 0.937 0.938 5 Table 9. The main factors weight for general goal. Main factors F1 F 2 F 3 F 4 Weight 0.356 0.261 0.242 0.141 ronment, future prospects, the act on the cognitive factor together. From a practical perspective, it is also in line with people’s habit of thinking. In general, the indicator system after revising is more reasonable, more in line with the actual (Figure 6). Copyright © 2013 SciRes. IB 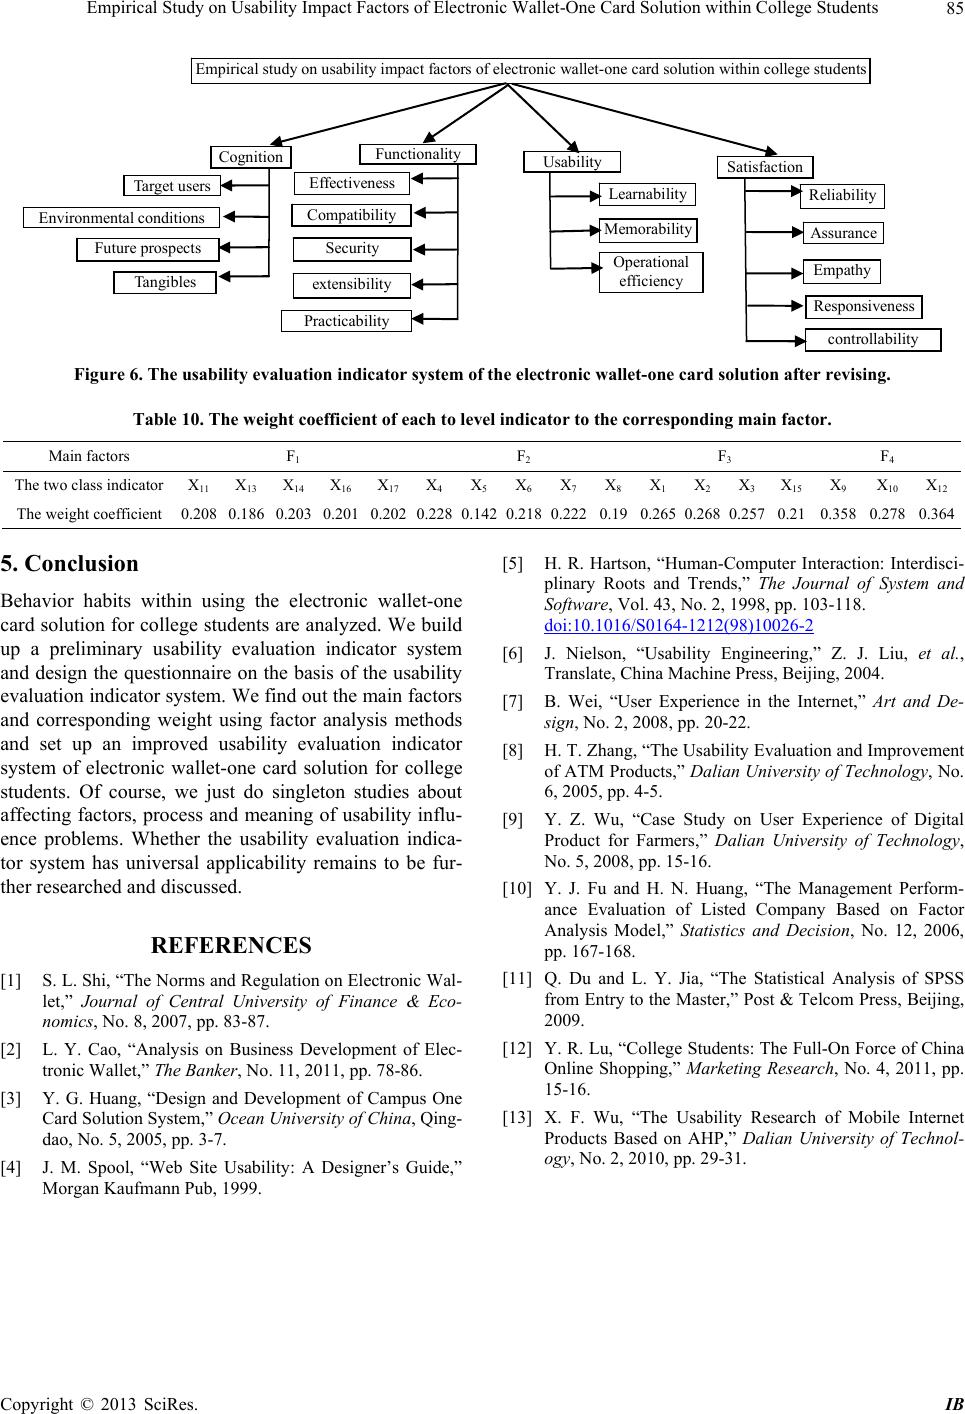 Empirical Study on Usability Impact Factors of Electronic Wallet-One Card Solution within College Students Copyright © 2013 SciRes. IB 85 Empirical study on usability impact factors of electronic wallet-one card solution within college students Cognition Functionalit Satisfaction Usability Learnability Memora bilit y Operational efficiency Compatibility Security extensibility Effectiveness Relia bility Assurance Empathy Tangibles Practicability Resp onsiven ess Target users Environmental conditions Future prospects controllability Figure 6. The usability evaluation indicator system of the electronic wallet-one card solution after revising. Table 10. The weight coefficient of each to level indicator to the corresponding main factor. Main factors F1 F 2 F 3 F 4 The two class indicator X11 X 13 X 14 X 16 X 17 X4X5X6X7X8X1X2X3 X 15 X 9 X 10 X12 The weight coefficient 0.208 0.186 0.203 0.201 0.2020.2280.1420.2180.2220.190.265 0.2680.257 0.21 0.358 0.2780.364 5. Conclusion [5] H. R. Hartson, “Human-Computer Interaction: Interdisci- plinary Roots and Trends,” The Journal of System and Software, Vol. 43, No. 2, 1998, pp. 103-118. doi:10.1016/S0164-1212(98)10026-2 Behavior habits within using the electronic wallet-one card solution for college students are analyzed. We build up a preliminary usability evaluation indicator system and design the questionnaire on the basis of the usability evaluation indicator system. We find out the main factors and corresponding weight using factor analysis methods and set up an improved usability evaluation indicator system of electronic wallet-one card solution for college students. Of course, we just do singleton studies about affecting factors, process and meaning of usability influ- ence problems. Whether the usability evaluation indica- tor system has universal applicability remains to be fur- ther researched and discussed. [6] J. Nielson, “Usability Engineering,” Z. J. Liu, et al., Translate, China Machine Press, Beijing, 2004. [7] B. Wei, “User Experience in the Internet,” Art and De- sign, No. 2, 2008, pp. 20-22. [8] H. T. Zhang, “The Usability Evaluation and Improvement of ATM Products,” Dalian University of Technology, No. 6, 2005, pp. 4-5. [9] Y. Z. Wu, “Case Study on User Experience of Digital Product for Farmers,” Dalian University of Technology, No. 5, 2008, pp. 15-16. [10] Y. J. Fu and H. N. Huang, “The Management Perform- ance Evaluation of Listed Company Based on Factor Analysis Model,” Statistics and Decision, No. 12, 2006, pp. 167-168. REFERENCES [11] Q. Du and L. Y. Jia, “The Statistical Analysis of SPSS from Entry to the Master,” Post & Telcom Press, Beijing, 2009. [1] S. L. Shi, “The Norms and Regulation on Electronic Wal- let,” Journal of Central University of Finance & Eco- nomics, No. 8, 2007, pp. 83-87. [12] Y. R. Lu, “College Students: The Full-On Force of China Online Shopping,” Marketing Research, No. 4, 2011, pp. 15-16. [2] L. Y. Cao, “Analysis on Business Development of Elec- tronic Wallet,” The Banker, No. 11, 2011, pp. 78-86. [3] Y. G. Huang, “Design and Development of Campus One Card Solution System,” Ocean University of China, Qing- dao, No. 5, 2005, pp. 3-7. [13] X. F. Wu, “The Usability Research of Mobile Internet Products Based on AHP,” Dalian University of Technol- ogy, No. 2, 2010, pp. 29-31. [4] J. M. Spool, “Web Site Usability: A Designer’s Guide,” Morgan Kaufmann Pub, 1999.
|