 Applied Mathematics, 2013, 4, 1242-1250 http://dx.doi.org/10.4236/am.2013.49168 Published Online September 2013 (http://www.scirp.org/journal/am) Mixture Models for Estimating the Number of Drug Users in Thailand 2005-2007 Chukiat Viwatwongkasem1*, Pratana Satitvipawee1, Suthi Jareinpituk2, Pichitpong Soontornpipit1 1Department of Biostatistics, Faculty of Public Health, Mahidol University, Bangkok, Thailand 2Department of Epidemiology, Faculty of Public Health, Mahidol University, Bangkok, Thailand Email: *chukiat.viw@mahidol.ac.th Received June 19, 2013; revised July 19, 2013; accepted July 26, 2013 Copyright © 2013 Chukiat Viwatwongkasem et al. This is an open access article distributed under the Creative Commons Attribu- tion License, which permits unrestricted use, distribution, and reproduction in any medium, provided the original work is properly cited. ABSTRACT It is difficult to measure the sizes of illegal drug user populations directly by using the survey method because of many “hidden drug addicts” and the difficulty of receiving a true response. Systematic and routine information on treatment episodes of drug users is adopted to estimate the population size in this study. Mixture models of zero-truncated Poisson distributions using the nonparametric maximum likelihood estimators (NPMLE) by means of capture-recapture re- peated count data were used to project the number of drug users. The method was applied to surveillance data of drug users identified by treatment episodes in over 1140 health treatment centers in Thailand from the Bureau of Health Ser- vice System Development, Ministry of Public Health. We presented how this mixture model could be utilized to con- struct the unobserved frequency of drug users with no treatment episode and further estimated the total population size of drug users in the country from 2005 to 2007. The result of simulation was confirmed that mixture model is suitable when population is large. By means of mixture models, the estimations for the number of drug users were fitted with excellent goodness-of-fit values and we were also compared to the conventional Chao estimates. The NPMLE for the total number of drug users in Thailand 2005, 2006, and 2007 were 184,045 (95% CI: 181,297 - 186,793), 230,665 (95% CI: 226,611 - 234,719), 299,670 (95% CI: 294,217 - 305,123), respectively, also 125,265 (95% CI: 123,092 - 127,142), 166,287 (95% CI: 163,222 - 169,352), 228,898 (95% CI: 224,766 - 233,030) for the number of methamphetamine (Yaba) users, and 11,559 (95% CI: 10,234 - 12,884), 11,333 (95% CI: 9276 - 13,390), 8953 (95% CI: 7878 - 10,028) for the number of heroin users, respectively. The numbers of marijuana, kratom-plant, opium, and inhalant users were under-estimated because their symptoms were mild and not severe enough to remedy in health treatment centers which led to the smaller size of the total number of drug users. The well-estimated sizes of heroin and methamphetamine ad- dicts are high reliable because they are based on clearly evident count with a severe addiction problem to health treat- ment centers. The estimation by means of mixture models can be recommended to monitor drug demand trend and drug health service routinely; it is easy to calculate via the available programs MIXTP based on request. Keywords: Capture-Recapture Count Data; Drug Use in Thailand; Mixture Models of Zero-Truncated Poisson Distributions; Population Size Estimation; Unobserved Zero Count Data 1. Introduction Drug abuse in Thailand has remained a serious health problem; its epidemic is still severe and widespread. In- formation on the number of illegal drug users is a benefit of the policy and the plan on narcotics control, to imple- ment a reduction strategy, and to allocate resources to the health service. Nevertheless, it is difficult to measure the sizes of drug user populations directly because of many “hidden drug addicts”. Surveys, especially on the large national scale, are unlikely to be the most efficient meth- ods due to a huge cost and manpower, the difficulty of receiving a true response, the problems of dealing with a hidden population and ethical issues. Capture-recapture methods are a classical and useful tool to solve a hidden population problem and to estimate a total population size because it can estimate and adjust for the extent of incomplete ascertainment using infor- mation from overlapping lists of cases from two or more distinct sources [1]. Moreover, there are not only the conventional multiple sources methods but also the ap- *Corresponding author. C opyright © 2013 SciRes. AM  C. VIWATWONGKASEM ET AL. 1243 proaches available based upon one source with repeated counts for each individual. In this study, a single source is considered from a surveillance system counting the number of times that a drug user went to a treatment in- stitution. There were few studies in Thailand which used the capture-recapture method for estimating the number of drug users. Mastro et al. [2] estimated the number of HIV-infected injection drug users in Bangkok under two- sample sources of 18 methadone treatment centers and 72 urine testing police stations. Suppawattanabodee [3] used two sources of health treatment records and police arrestment records for estimating the number of drug users in Bangkok 2001. However, for one source with repeated count data, applications have been few relevant studies in Thailand. Böhning et al. [4] estimated the number of drug users in Bangkok 2001 by means of zero-truncated count mixture distributions. Viwatwong- kasem, Kuhnert, and Satitvipawee [5] projected the number of heroin users in Bangkok 2002 using the mix- ture of zero-truncated Poisson models. Note that the ze- ro-truncated Poisson mixture distributions are different from the mixture of zero-truncated Poisson models, at least the mixing distribution in both estimations. A mixture model is a flexible approach to cope with long-tailed, skewed, and/or contaminated count distribu- tions in a natural way. The mixing idea corresponds to a mixture representing the presence of sub-populations within an overall population. Formally, a mixture model can cope with not only two or more distributions (het- erogeneity) but also includes the case of one distribution (homogeneous population) [6-8]. Böhning and Schön [9] proposed the nonparametric maximum likelihood esti- mators (NPMLE) of population size based on the count- ing distribution. Böhning and Kuhnert [10] showed the equivalence of the zero-truncated count mixture distribu- tions and the mixture of zero-truncated count distribu- tions. They stated that for any mixing distribution of the truncated mixture, a usually different mixing distribution of the mixture of truncated counts could be found so that the likelihood surfaces for both models agreed; conse- quently, for estimating population size, two estimators associated with two models had equal values. Punya- charoensin and Viwatwongkasem [11] predicted HIV incidence in Thailand utilizing the backcalculation of mixture of the past AIDS incidence and AIDS incubation period distributions. Viwatwongkasem, Kuhnert, and Sa- titvipawee [5] compared the performance of population size estimators under the truncated count model with and without allowance for contaminations among Mc-Ken- drick’s, Mantel-Haenszel’s, Zelterman’s, Chao’s, the ma- ximum likelihood, and their proposed methods of the mixture of zero-truncated count models. The proposed estimator provided the best choice according to its small- est bias and smallest mean square error for a situation of sufficiently large population sizes and it also performed well even for a homogeneous situation. Although, the mixture model has been used previously in many fields of application, it is still not very common; only few relevant studies were found in Thailand and, in addition, the numerical computation of mixture model estimates has not been directly provided in the existing standard statistical packages. With the motivation of having at present few relevant studies and unavailable statistical packages with the option or focus on estimat- ing the size of a hidden population, we take this opportu- nity to address the gap by adopting the nonparametric maximum likelihood estimators (NPMLE) for estimating the mixture parameters of zero-truncated Poisson distri- butions leading to the population size estimate of interest. 2. Methods 2.1. The Horvitz-Thompson Approach Suppose that a registration system identifies n observed cases, but not all cases of a population of size N, and the system can identify a case with probability 0 where p0 is probability of the unidentified cases. This leads to the expected equation of the population size, 1p 0 1NNp Np 0 where 0 is the expected number of cases identified by the system which simply can be estimated by n, number of identified (observed) cases. It leads to the estimating equation 1Np 0 NNpn , (1) which in other words can be stated that the population size N is the sum of both the unobserved and the ob- served cases (n). The Equation (1) can easily be solved for N to provide the Horvitz-Thompson estimator 0 ˆ1Nn p (2) and 0ˆ ˆ nNn . The Horvitz-Thompson approach seems easy, but the unknown 0 probability of unobserved cases must be estimated and this is quite differently ac- complished in the various methods of estimation. p 2.2. Data Sources The surveillance data on the drug addicts undergoing treatment and rehabilitation in the country over 1140 health treatment centers (1144 centers in 2005 and 2006, 1258 centers in 2007) collected by the Bureau of Health Service System Development (BHSSD), Ministry of Public Health, were adopted during 2005 to 2007. Each anonymous record of treatment episodes in database was linked to the same patient with matching keywords, such as age, gender, date of birth, district and city of birth, present address, hospital number and name, date of re- Copyright © 2013 SciRes. AM  C. VIWATWONGKASEM ET AL. 1244 ceiving treatment episodes. This study was approved by the Ethics Committee on Human Rights of the Faculty of Public Health, Mahidol University, with the approved number 105/2011. 2.3. Statistical Methods Suppose that Y is the number of treatment episodes in a case; obviously, Y has the values ranged from 1 to m (without zero value) where m is the largest number of treatment episodes in a case. Now data Y are tallied into a frequency table like Table 1. We let i be the number of treatment episodes in a case, ni be the number (frequency) of cases identified with i episodes where and a sample size 12 m is the total num- ber of observed cases. In Table 1, the observed frequen- cies of treatment episodes for heroin users in Thailand 2005 are n1 = 3057, n2 = 791, n3 = 351, n4 = 107, n5 = 80, n6 = 59, n7+ = 22. 1, 2,,im nnn n To estimate the population size N and the size of zero treatment episode n0, we let 1 be probabilities of cases identified 1, times. Under homogeneity, the density function pi is assumed to be a zero-truncated Poisson since zero identification does not occur in the sample; that is, ,, m pp ,m ,exp ,10, 1exp i i ! i pfi f i where . However, frequently the homogeneous model is not appropriate in real situations to fit an ade- quate model. Mixture models allowing for heterogeneity are more flexible and we consider a discrete mixture of truncated Poisson densities of the form 1, 2,i 1 , k ij j pfiQ qfi , j (3) where the mixing distribution 12 12 k k Qqq q gives weights to parameters 0 j q for , k is the number of components in the mixture and 1, 2,,jk j 1 1 k j j q . Then, the log-likelihood for the mixture of zero-truncated count densities is 1 11 loglog , log , m i i mk ij ij LQnf iQ nqfi (4) In this situation, with the help of gradient functions and the consideration at the boundaries of parameter space, the log-likelihood is concave on the parameter space of all discrete probability densities on which it can be maximized, leading to the nonparametric maximum likelihood estimator (NPMLE) of Q. To proceed in the EM context, we need the complete data log likelihood, which is given in this case as 11 11 loglog , log mk CDiijj ij mk iij j ij LQnz fi nz q (5) where the unobserved covariate ij is 1 if i belongs to component j and 0 otherwise. In the E-step, the unob- served indicator variates, ij, are replaced by their ex- pected posterior probabilities, , leading to z ij ze 1 ;, 1;, , , ijij ijj iji j j jj k jj j eEznq Pz nq fi q fi q (6) In the M-step, the new values 1 ˆˆ ,, k , 1 are found, which maximize the expected version of com- plete log likelihood (5). The results of the weighting es- timates are obtained by ˆˆ ,, k qq 1 ˆˆ ,, k qq 1 1 ˆ,for 1,, m jiij i qnej n k (7) Similarly, the solution after solving the equations of derivatives with respect to ˆ is obtained by 1 1 ˆˆ 1exp,for 1,, m iij i jj m iij i in ej ne k (8) Note that (8) does not provide a close form solution; the iterative procedure is needed until the desired accu- racy is achieved. Having identified the model and the associated parameter estimates, we can estimate the probability of zero treatment episodes p0 as 01 ˆ ˆˆ exp k j j p q (9) so that the Horvitz-Thompson approach leads to a popu- lation size estimate 11 ˆ ˆ ˆˆ ˆ 1exp1 exp kj k j jj j qn Nn q (10) 2.4. Model Evaluation It is crucial to select an appropriate model among various potential models differing in the number of components k. The smallest value of the Bayesian Information Criterion (BIC) is considered to choose the best model: the smaller Copyright © 2013 SciRes. AM  C. VIWATWONGKASEM ET AL. Copyright © 2013 SciRes. AM 1245 distribution with size parameter n and categorical prob- ability parameters i nthen ˆ Nas constructed us- ing the BIC-selected mixture model. Suppose that there were B samples of size n each, population size estimates * 1 ˆ ,, BIC-value, the better model. n; w * ˆ NNailable. These resampled data were used to compute variances and confidence intervals as asymptotic normal intervals. ˆ 2log21log k BICL Qkn (11) The BIC adjusts the log-likelihood with the number of parameters multiplied by the log-sample size; BIC works well as model selection criterion in mixture model since it does not suffer under likelihood irregulari- ties that are typical for mixture models [8,12]. 21kwere av The appropriate NPMLE for k = 2 components of mixture yielded . The associated 95% con- fidence interval for heroin users in Thailand 2005 was established and lied between (10,234, 12,884). As a gen- eral trend, the estimated size was about 3 times higher than the observed data ˆ Q 9 ˆ11,55N ˆ N n. Also, it was usually important to provide an estimate of completeness (of the surveillance stream) given as ˆ100%nN , which was for heroin users 38.6% (95% CI: 34.7% - 43.6%). 3. An Application For the surveillance data of heroin users 2005 in Table 1, the observed frequencies were n1 = 3057, n2 = 791, n3 = 351, n4 = 107, n5 = 80, n6 = 59, n7+ = 22. Table 2 showed that the mixture of two-components of zero-truncated Poisson model was the best fitting with the smallest BIC value. The results produced 0 for the unob- served number of heroin users without any treatment episodes and for the total number of heroin users whereas a well-established alternative Chao’s [13] estimator ˆ7092n ˆ11,559N 2 12 yielded which was close to the appropriate NPMLE model with k = 2 components in the mixture. Likewise, Figure 1 compared frequency distributions of treatment episodes among the observed frequencies, single Poisson with zero-truncation, and the mixture of zero-truncated Pois- son with two components. The Poisson mixture provided an excellent goodness-of-fit to the observed frequencies whereas the simple Poisson was not adequate; it was clearly evident with the smallest BIC value. ˆ2 Chao Nnn nˆ10,374 Chao N 4. Results Thailand Narcotics Annual Report 2006 of the Office of Confidence Intervals Bootstrap resampling technique was applied to compute the variance of mixtures of truncated count data since the direct computation via the information matrix was usu- ally difficult. For each nonparametric bootstrap, frequen- cies were sampled from a multinomial 12 ,,, m nn n Figure 1. Frequency distribution of treatment episodes among the observed counts, single Poisson, and mixture of two truncated Poisson. Table 1. Observed frequencies of treatment episodes of heroin users in Thailand 2005: n1 = 3057, n2 = 791, n3 = 351, n4 = 107, n5 = 80, n6 = 59, n7+ = 22. Number of treatment episodes in a case (i) 0 1 2 … m = 7+ Total Number of cases (Frequency ni) - 3057 791 … 22 n = 4467 Table 2. The k-components mixture of zero-truncated Poisson models for estimating the size of heroin users in Thailand 2005. k ˆj ˆj q log-likelihood BIC 0 ˆ n ˆ N 1 0.9869 1.000 −4893 9796 2654 7121 1 2 0.4094 2.7772 0.7965 0.2035 −4543 9111 7092 11,559 1 2 3 0.0419 0.8546 3.2260 0.3346 0.5361 0.1293 −4538 9119 36,757 41,224  C. VIWATWONGKASEM ET AL. 1246 the Narcotics Control Board [14] showed that the number of drug addicts undergoing treatment and rehabilitation had increased from 41,564 patients in year 2005 to 43,156 patients in 2006. Most of them were the drug pa- tients who underwent treatment for the first time (about 80%). Adolescents aged between 15 and 24 years old were the biggest group (49%). Among them, 83% were new drug patients while 17% were the relapsing patients. 33% of the total drug patients were unemployed while 19% were laborers and 13% were students. Drug epi- demics were mostly found in Bangkok (50%) and 30% were located in the central region of Thailand while the rest were in the North, the South, and the Northeast, re- spectively. Methamphetamine (Yaba) addicts were still the biggest group of drug patients in all treatment centers (79%) because the ingredients were not hardly available and the price was not too high in comparing purity and severity. The second biggest group was cannabis (mari- juana) addicts (11%); most marijuana was spread in many urban and rural areas; however, the price of mari- juana was still cheaper compared with other illicit drugs. Heroin epidemic was still important though it has a high price but the injuries were quite severe. Kratom plants were abused in many areas of the country side; farmers and peasants used kratom plants for working in the rice fields to work longer. The number of club drugs like ec- stasy, ketamine, cocaine, and crystallized methampheta- mine had an increasing trend in big cities and the rich persons. The MIXTP program developed by authors was avail- able to achieve the estimates of population size under the mixture of truncated count models via FORTRAN POWERSTATION and now it is available on the re- quest. Table 3 illustrated the sizes of drug users, estimated by the mixture of truncated Poisson models and classi- fied by types of drugs in Thailand 2005-2007. Metham- phetamine users were the biggest group and tended to increase from 2005-2007 while heroin users trended to decrease slightly because of its high price. The numbers of marijuana, kratom-plant, and inhalant users were un- der-estimated because of their mild severities. Trend of marijuana sizes increased from 2005-2007 while trends of kratom-plant, inhalant, and others were difficult to predict. 5. A Simulation Study Although data fitting of mixture of truncated count model was well in the examples, we wish to ensure this in general case via the simulation experiment. Let count variables Yi be generated from a two-component mixture of Poisson distributions with equal weights attached to the component means 11 and 2 where 21, 2,,5 . That is, 2 0.51 0.5 i YPo Po where 1, 2,,iN 01 ,,, m nn n nn . Population sizes were 200 (for small), 1000 (for medium), 5000 (for large), 10,000 (very large). Each simulated datum i was tallied to get frequencies with respect to the counts where 01 m N Y 0,1,, m n N . Then was dropped and zero- truncated frequencies 1 were used to compute population size estimators of mixture model and Chao. This was done under 5000 replications; mean, standard deviation (SD), and root of mean square error (RMSE) of all estimates were computed and determined from these replications. 0 n ,, m nn The results are found in Table 4 and we can conclude in the following: Under homogeneity 21 , mixture model estima- tor with 1 component in this case performs well with smaller RMSE, regardless of population size; Chao’s estimator is worse with larger RMSE under this ho- mogeneity. Under heterogeneity 21 , Chao’s estimator per- forms better when population size is small to moder- ate (N = 200, 1000); mixture model estimator is better when population is large to very large (N ≥ 5000) and degrees of heterogeneity are strong 24, 5 , at least 3 2 . Furthermore, we found that if the weak degrees of heterogeneity occur 22,3 in combination with small to moderate population size (N = 200, 1000), mixture model estimator has a problem of the large excess values of standard deviation. 6. Discussion The NPMLE method provides well-estimated sizes of various drug-user target populations, obtained from the surveillance data on the drug addicts with emphasis on methamphetamine (228,898 cases in 2007) and heroin (8953 cases in 2007) users. It can be expected that these surveillance data provide a high reliability because they are based on clearly evident contact counts of drug ad- dicts with a severe addiction problem to health treatment centers. A comparison by means of a national household survey of ONCB [15] yielded the under-estimated sizes of 66,320 methamphetamine users and 3907 heroin users per year. In contrast, the estimated sizes of this study using NPMLE of users with kratom-plant (less than 18,720 cases in 2007), marijuana (27,323 cases in 2007), and inhalant (13,362 cases in 2007) are frequently under- estimated because of their low severity of symptoms to cure, leading to the smaller size of total number of drug users (299,670 cases in 2007). This fact is confirmed by a national household survey of the ONCB [15] that re- ported an estimate of 378,214 kratom-plant users, 57,527 Copyright © 2013 SciRes. AM 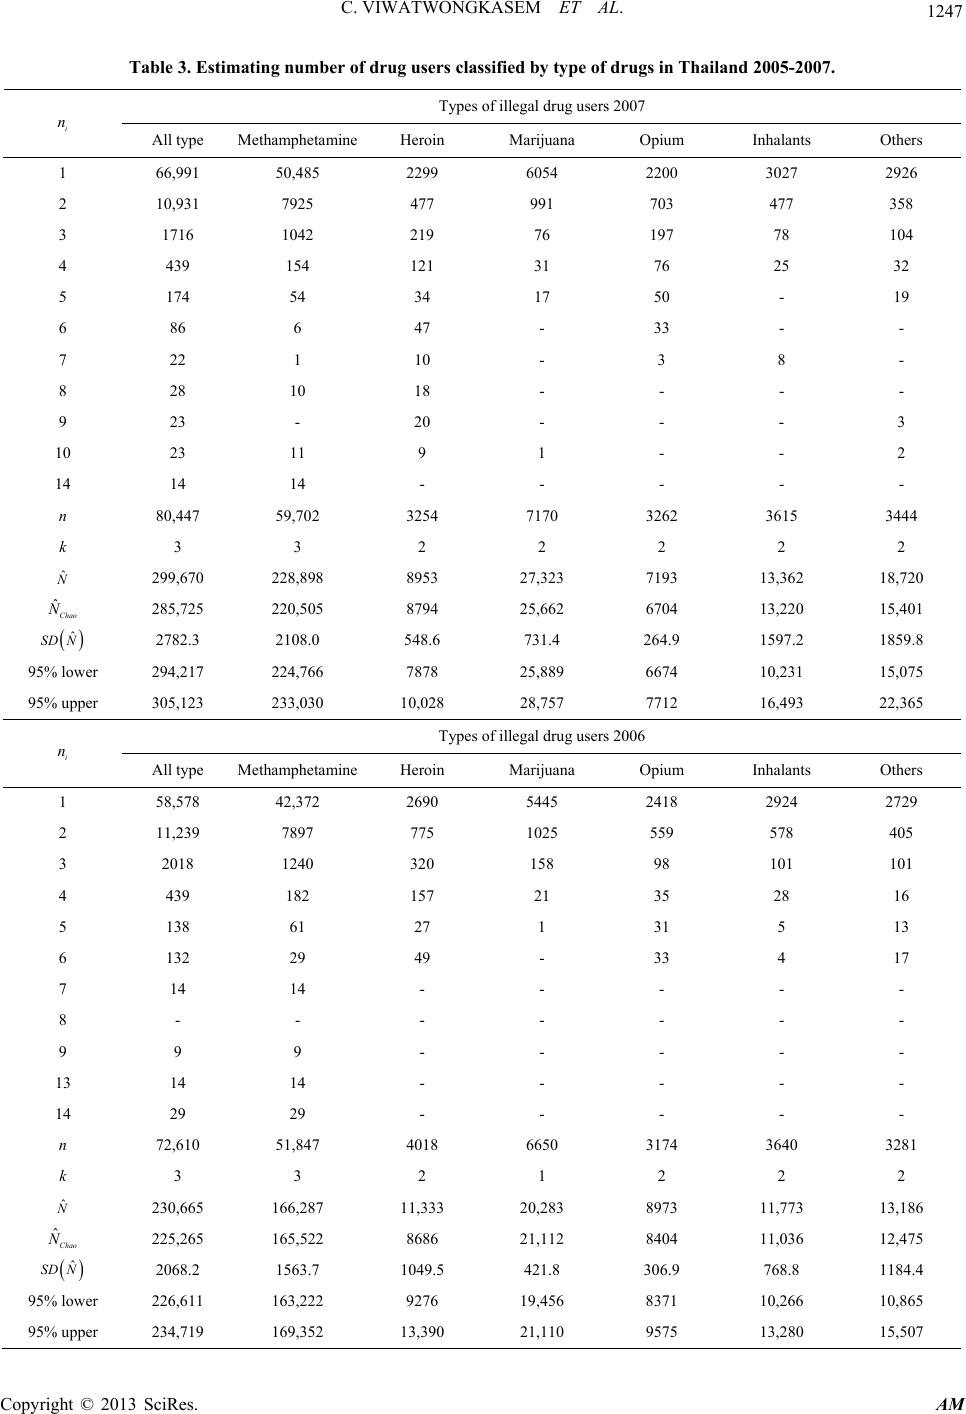 C. VIWATWONGKASEM ET AL. 1247 Table 3. Estimating number of drug users classified by type of drugs in Thailand 2005-2007. Types of illegal drug users 2007 i n All type Methamphetamine Heroin Marijuana Opium Inhalants Others 1 66,991 50,485 2299 6054 2200 3027 2926 2 10,931 7925 477 991 703 477 358 3 1716 1042 219 76 197 78 104 4 439 154 121 31 76 25 32 5 174 54 34 17 50 - 19 6 86 6 47 - 33 - - 7 22 1 10 - 3 8 - 8 28 10 18 - - - - 9 23 - 20 - - - 3 10 23 11 9 1 - - 2 14 14 14 - - - - - n 80,447 59,702 3254 7170 3262 3615 3444 k 3 3 2 2 2 2 2 ˆ N 299,670 228,898 8953 27,323 7193 13,362 18,720 ˆChao N 285,725 220,505 8794 25,662 6704 13,220 15,401 ˆ SD N 2782.3 2108.0 548.6 731.4 264.9 1597.2 1859.8 95% lower 294,217 224,766 7878 25,889 6674 10,231 15,075 95% upper 305,123 233,030 10,028 28,757 7712 16,493 22,365 Types of illegal drug users 2006 i n All type Methamphetamine Heroin Marijuana Opium Inhalants Others 1 58,578 42,372 2690 5445 2418 2924 2729 2 11,239 7897 775 1025 559 578 405 3 2018 1240 320 158 98 101 101 4 439 182 157 21 35 28 16 5 138 61 27 1 31 5 13 6 132 29 49 - 33 4 17 7 14 14 - - - - - 8 - - - - - - - 9 9 9 - - - - - 13 14 14 - - - - - 14 29 29 - - - - - n 72,610 51,847 4018 6650 3174 3640 3281 k 3 3 2 1 2 2 2 ˆ N 230,665 166,287 11,333 20,283 8973 11,773 13,186 ˆChao N 225,265 165,522 8686 21,112 8404 11,036 12,475 ˆ SD N 2068.2 1563.7 1049.5 421.8 306.9 768.8 1184.4 95% lower 226,611 163,222 9276 19,456 8371 10,266 10,865 95% upper 234,719 169,352 13,390 21,110 9575 13,280 15,507 Copyright © 2013 SciRes. AM 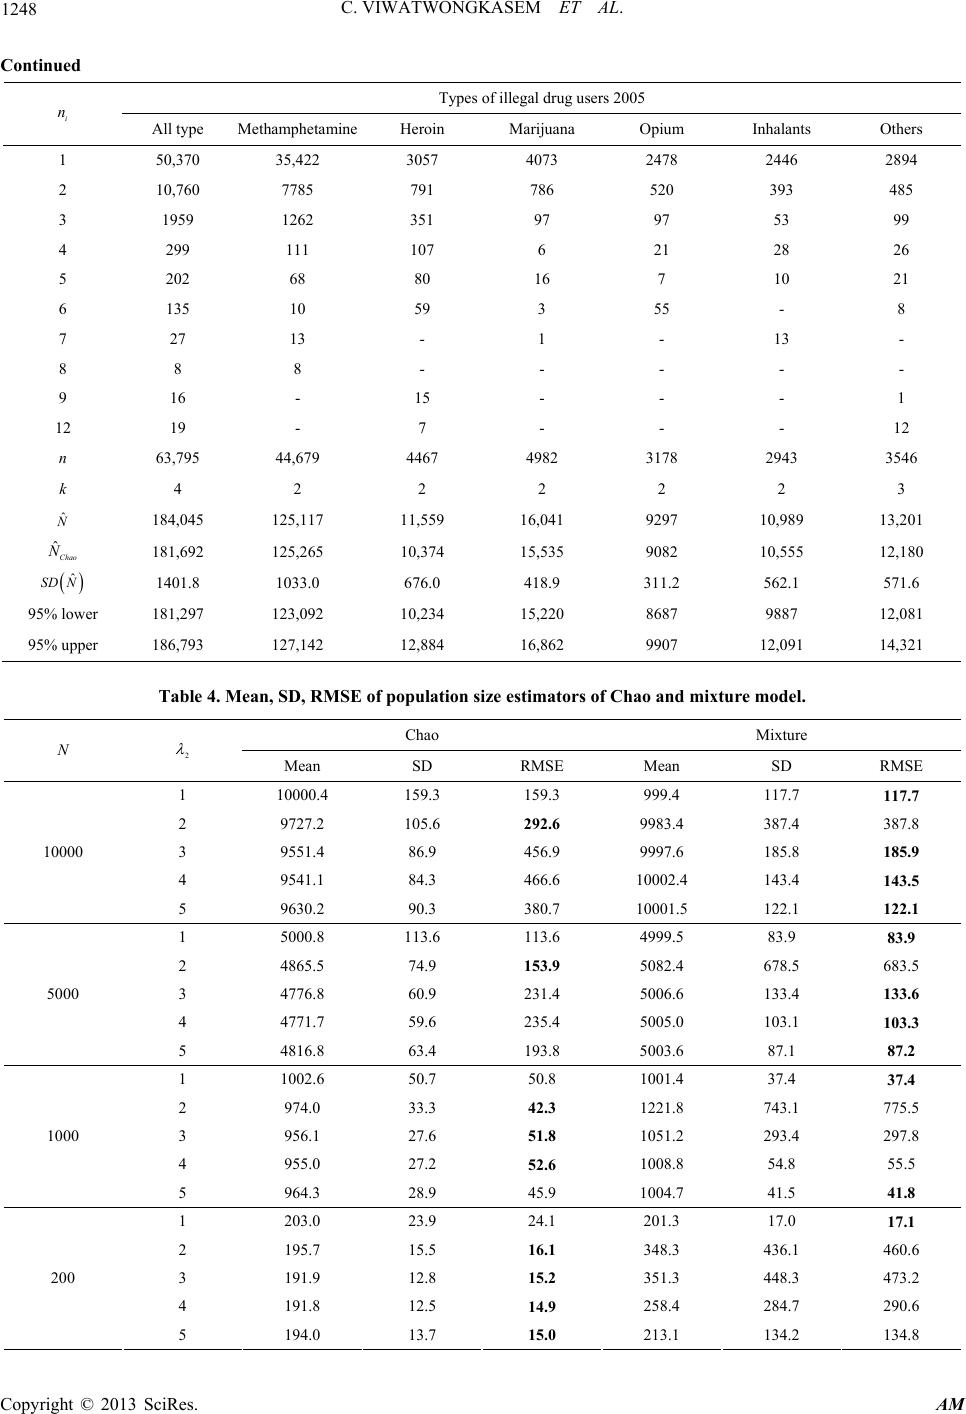 C. VIWATWONGKASEM ET AL. 1248 Continued Types of illegal drug users 2005 i n All type Methamphetamine Heroin Marijuana Opium Inhalants Others 1 50,370 35,422 3057 4073 2478 2446 2894 2 10,760 7785 791 786 520 393 485 3 1959 1262 351 97 97 53 99 4 299 111 107 6 21 28 26 5 202 68 80 16 7 10 21 6 135 10 59 3 55 - 8 7 27 13 - 1 - 13 - 8 8 8 - - - - - 9 16 - 15 - - - 1 12 19 - 7 - - - 12 n 63,795 44,679 4467 4982 3178 2943 3546 k 4 2 2 2 2 2 3 ˆ N 184,045 125,117 11,559 16,041 9297 10,989 13,201 ˆChao N 181,692 125,265 10,374 15,535 9082 10,555 12,180 ˆ SD N 1401.8 1033.0 676.0 418.9 311.2 562.1 571.6 95% lower 181,297 123,092 10,234 15,220 8687 9887 12,081 95% upper 186,793 127,142 12,884 16,862 9907 12,091 14,321 Table 4. Mean, SD, RMSE of population size estimators of Chao and mixture model. Chao Mixture N 2 Mean SD RMSE Mean SD RMSE 1 10000.4 159.3 159.3 999.4 117.7 117.7 2 9727.2 105.6 292.6 9983.4 387.4 387.8 3 9551.4 86.9 456.9 9997.6 185.8 185.9 4 9541.1 84.3 466.6 10002.4 143.4 143.5 10000 5 9630.2 90.3 380.7 10001.5 122.1 122.1 1 5000.8 113.6 113.6 4999.5 83.9 83.9 2 4865.5 74.9 153.9 5082.4 678.5 683.5 3 4776.8 60.9 231.4 5006.6 133.4 133.6 4 4771.7 59.6 235.4 5005.0 103.1 103.3 5000 5 4816.8 63.4 193.8 5003.6 87.1 87.2 1 1002.6 50.7 50.8 1001.4 37.4 37.4 2 974.0 33.3 42.3 1221.8 743.1 775.5 3 956.1 27.6 51.8 1051.2 293.4 297.8 4 955.0 27.2 52.6 1008.8 54.8 55.5 1000 5 964.3 28.9 45.9 1004.7 41.5 41.8 1 203.0 23.9 24.1 201.3 17.0 17.1 2 195.7 15.5 16.1 348.3 436.1 460.6 3 191.9 12.8 15.2 351.3 448.3 473.2 4 191.8 12.5 14.9 258.4 284.7 290.6 200 5 194.0 13.7 15.0 213.1 134.2 134.8 Copyright © 2013 SciRes. AM  C. VIWATWONGKASEM ET AL. Copyright © 2013 SciRes. AM 1249 marijuana users, and 48,849 inhalant users in year 2007, leading to 575,312 cases for total number of drug users. The huge difference in values between two methods mentioned, stem mainly from the severity of symptoms of drug use. With this point of view, the estimated sizes of methamphetamine and heroin users from the surveil- lance data of this NPMLE study seem to be more useful than those from the national survey, in particular, if viewed from the perspective of a benefit of allocating resources on health service, monitoring drug epidemics, and planning policy on narcotics control. In general, the estimated sizes from this study are at least three times higher than the observed data. Hence, the completeness of identification is about 30% - 40%. Due to the result of simulation that mixture model es- timator behaves well when population size is large, there is no reason to reject the use of mixture model to esti- mate the hidden population size and the total population size for each type of drugs since the observed total num- ber of drug users is large enough. However, there is something called a boundary problem: extremely large observations in some samples. This could explain the overestimation effect seen in the simulation for N = 200. Kuhnert et al. [16] used the median for a series of esti- mates of population size in their simulation to avoid highly influential size estimates. Basically, the mixture model is a flexible approach to cope with homogeneity and heterogeneity, including long-tailed, skewed, and/or contaminated distributions in a natural way. Recently, there has been an increased interest in zero- truncated count models. These models can be applied in many areas such as illegal immigrants, illegal gun own- ers, HIV epidemic, scrapie disease on sheep, or criminal persons. This article has shown how the mixture models allowing for heterogeneity can be applied to estimate the unobserved population size of drug users with zero treatment episodes and then estimate the total population size of illegal drug addicts. Indeed, there are not only the estimators available based upon mixture models but also there are the Mantel-Haenszel’s [17], Zelterman’s [18], Chao’s [13], and maximum likelihood methods available in estimating population sizes. Viwatwongkasem, Kuh- nert, and Satitvipawee [5] found that the mixture of zero- truncated count model and Chao’s model provided the best choice among the above estimators, according to its smallest bias and smallest mean square error, especially for a situation of sufficiently large population sizes; fur- thermore, the mixture itself also performed well even for a homogeneous situation. Although the mixture model provides a nice estimate, its variance estimate is usually difficult to find. Bootstrap resampling technique was applied to compute the variance of mixture of truncated count data, instead of the direct computation via the in- formation matrix. Further study should focus on the es- timation of the variance of mixture models. But this is a challenging task as stated by Chao [19], Cormack [20], and Böhning and Schön [9]. Other parametric models such as the binomial model, the hypergeometric model, and the inverse sampling of the negative binomial model should be considered in any future research. Fortunately, the appropriate NPMLE models for these surveillance data of drug users in 2005-2007 do not face a spurious value of overestimation. However, in few oc- currences, the NPMLE of mixture may provide an over- estimation. The occurrence of overestimates is due to the boundary problem of an estimate which is evaluated at the boundary of parameter space. The improvement in reducing overestimation bias should be investigated in any further study. 7. Acknowledgements We are grateful to Kanya Boonthongtho, our M.Sc. (Bio- statistics) student as well as the Bureau of Health Service System Development (BHSSD), Ministry of Public Health, for providing the surveillance dataset. We would like to thank the referees and the editors for comments which greatly improved this paper. This study was par- tially supported for publication by the China Medical Board (CMB), Faculty of Public Health, Mahidol Uni- versity, Bangkok, Thailand. REFERENCES [1] E. B. Hook and R. R. Regal, “Capture-Recapture Meth- ods in Epidemiology: Methods and Limitations,” Epide- miologic Reviews, Vol. 17, No. 2, 1995, pp. 243-264. [2] T. D. Mastro, D. Kitayaporn, B. G. Weniger, et al., “Es- timating the Number of HIV-Infected Injection Drug Us- ers in Bangkok: A Capture-Recapture Method,” American Journal of Public Health, Vol. 84, No. 7, 1994, pp. 1094- 1099. doi:10.2105/AJPH.84.7.1094 [3] B. Suppawattanabodee, “Estimating the Number of Drug Users in Bangkok: A Capture-Recapture Method,” Master of Sciences Thesis, Mahidol University, Bangkok, 2003. [4] D. Böhning, B. Suppawattanabodee, W. Kusolvisitkul, and C. Viwatwongkasem, “Estimating the Number of Drug Users in Bangkok 2001: A Capture-Recapture Ap- proach Using Repeated Entries in One List,” European Journal of Epidemiology, Vol. 19, No. 12, 2004, pp. 1075-1083. doi:10.1007/s10654-004-3006-8 [5] C. Viwatwongkasem, R. Kuhnert and P. Satitvipawee, “A Comparison of Population Size Estimators under the Truncated Count Model with and without Allowance for Contaminations,” Biometrical Journal, Vol. 50, No. 6, 2008, pp. 1006-1021. doi:10.1002/bimj.200810484 [6] D. Böhning, “Computer-Assisted Analysis of Mixtures and Applications. Meta-Analysis, Disease Mapping and Others,” Chapman & Hall/CRC, Boca Raton, 2000. [7] B. G. Lindsay, “The Geometry of Mixture Likelihoods  C. VIWATWONGKASEM ET AL. 1250 Part I: A General Theory,” Annals of statistics, Vol. 11, No. 3, 1983, pp. 783-792. doi:10.1214/aos/1176346245 [8] G. McLachlan and D. Peel, “Finite Mixture Models,” Wiley, New York, 2000. doi:10.1002/0471721182 [9] D. Böhning and D. Schön, “Nonparametric Maximum Likelihood Estimation of Population Size Based on the Counting Distribution,” Journal of the Royal Statistical Society: Series C (Applied Statistics), Vol. 54, No. 4, 2005, pp. 721-737. doi:10.1111/j.1467-9876.2005.05324.x [10] D. Böhning and R. Kuhnert, “Equivalence of Truncated Count Mixture Distributions and Mixture of Truncated Count Distributions,” Biometrics, Vol. 62, No. 4, 2006, pp. 1207-1215. doi:10.1111/j.1541-0420.2006.00565.x [11] N. Punyacharoensin and C. Viwatwongkasem, “Trends in Three Decades of HIV/AIDS Epidemic in Thailand by Nonparametric Backcalculation Method,” AIDS, Vol. 23, No. 9, 2009, pp. 1143-1152. doi:10.1097/QAD.0b013e32832baa1c [12] N. M. Laird, “Nonparametric Maximum Likelihood Es- timation of a Mixing Distribution,” Journal of the Ame- rican Statistical Association, Vol. 73, No. 364, 1978, pp. 805-811. doi:10.1080/01621459.1978.10480103 [13] A. Chao, “Estimating the Population Size for Capture- Recapture Data with Unequal Catchability,” Biometrics, Vol. 43, No. 4, 1987, pp. 783-791. doi:10.2307/2531532 [14] Office of the Narcotics Control Board (ONCB), “Thai- land Narcotics Annual Report,” Aroon Printing Co., Ltd., Bangkok, 2006. [15] Office of the Narcotics Control Board (ONCB), Aca- demic Network Organization Board on Substance Abuse, “Estimation of the Number of Drug Addicts in Thailand 2007,” Union Ultra Violet Co., Ltd., Bangkok, 2007. [16] R. Kuhnert, V. J. Del Rio Vilas, J. Gallagher and D. Böh- ning, “A Bagging-Based Correction for the Mixture Model Estimator of Population Size,” Biometrical Jour- nal, Vol. 50, No. 6, 2008, pp. 993-1005. doi:10.1002/bimj.200810485 [17] N. Wannasirikul, “A Comparison of Truncated Poisson Estimators of Population Size under Model Contamina- tions,” Master of Sciences Thesis, Mahidol University, Bangkok, 2005. [18] D. Zelterman, “Robust Estimation in Truncated Discrete Distributions with Application to Capture-Recapture Ex- periments,” Journal of Statistical Planning and Inference, Vol. 18, No. 2, 1988, pp. 225-237. doi:10.1016/0378-3758(88)90007-9 [19] A. Chao, “Estimating Population Size for Sparse Data in Capture-Recapture Experiments,” Biometrics, Vol. 45, No. 2, 1989, pp. 427-438. doi:10.2307/2531487 [20] R. M. Cormack, “Interval Estimation for Mark-Recapture Studies of Closed Populations,” Biometrics, Vol. 48, No. 2, 1992, pp. 567-576. doi:10.2307/2532310 Copyright © 2013 SciRes. AM
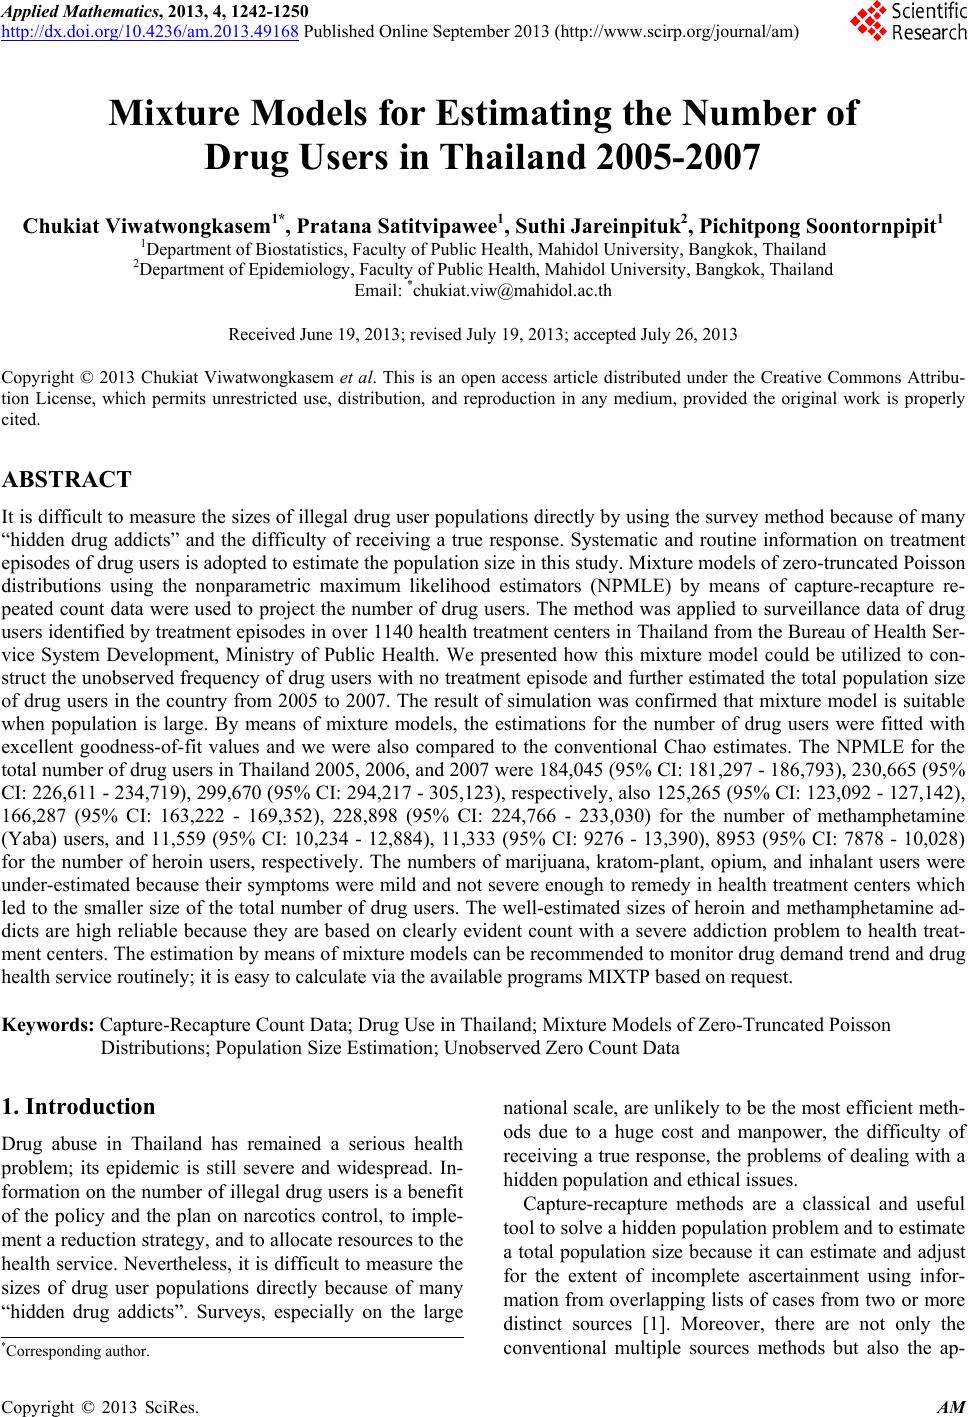
|