Forming Stages of Polycrystalline TiN Films Depending on the Nitrogen Concentration in Mixed Gas
12
Globular stage:
forming of globules
without substrate
surface wetting
(50%) and with the
one (70%, 90%)
Forming of 3D
formations with
grain
substructure:
non-ordered at
50%, 70%;
ordered at 90%
Integration of the 3D
formations with grain
substructure: without
ordering at 50%; initial
ordering at 70%; forming
of pseudoplains {100} on
surface at 90%
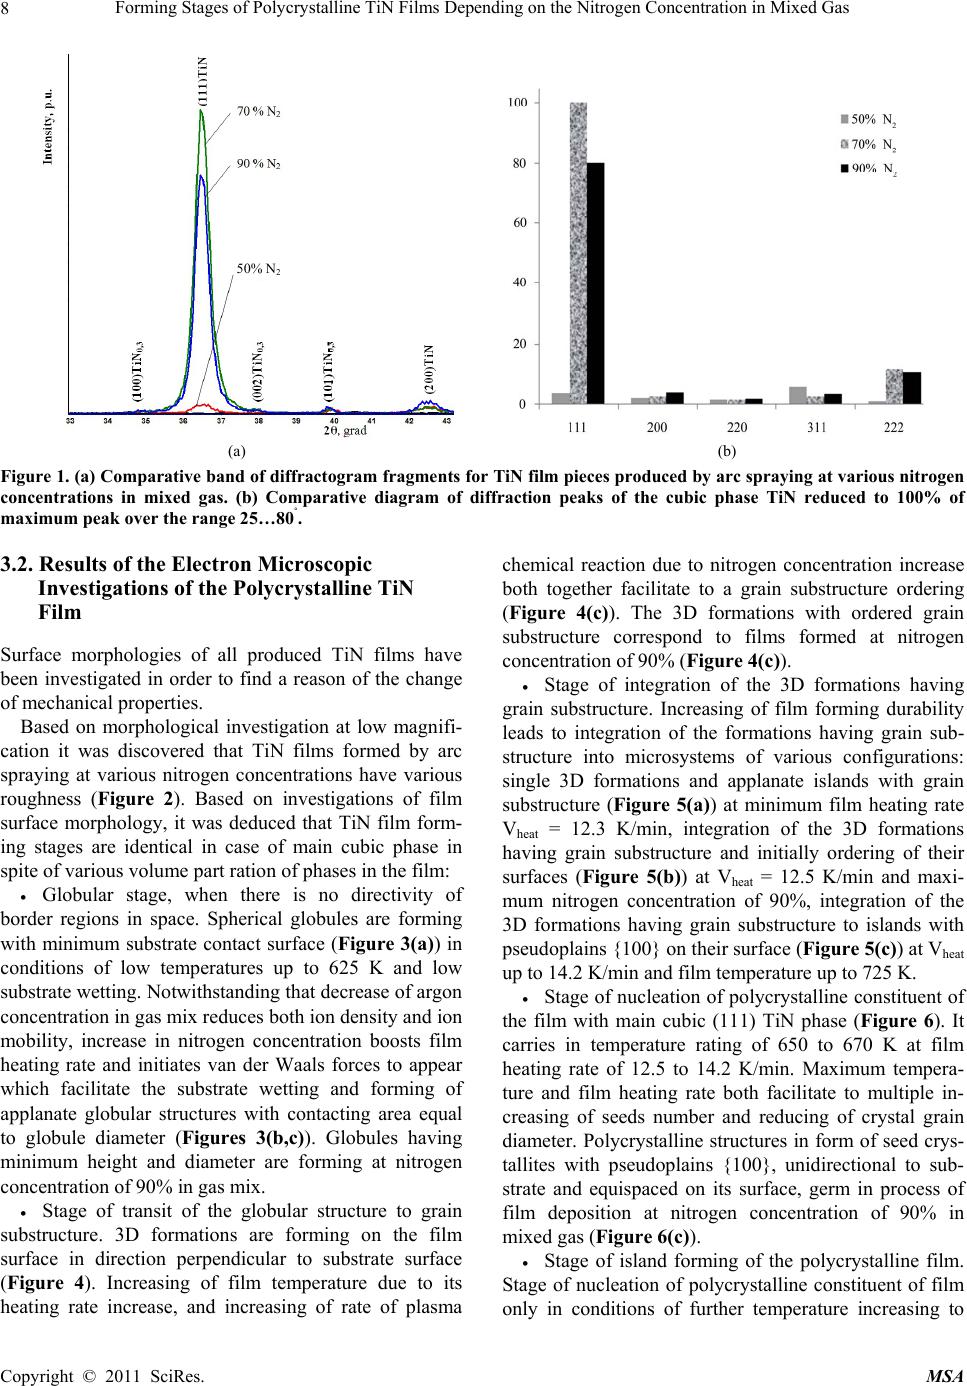
Germi-nati
on of
polycrysta
lline
constituent
of the film
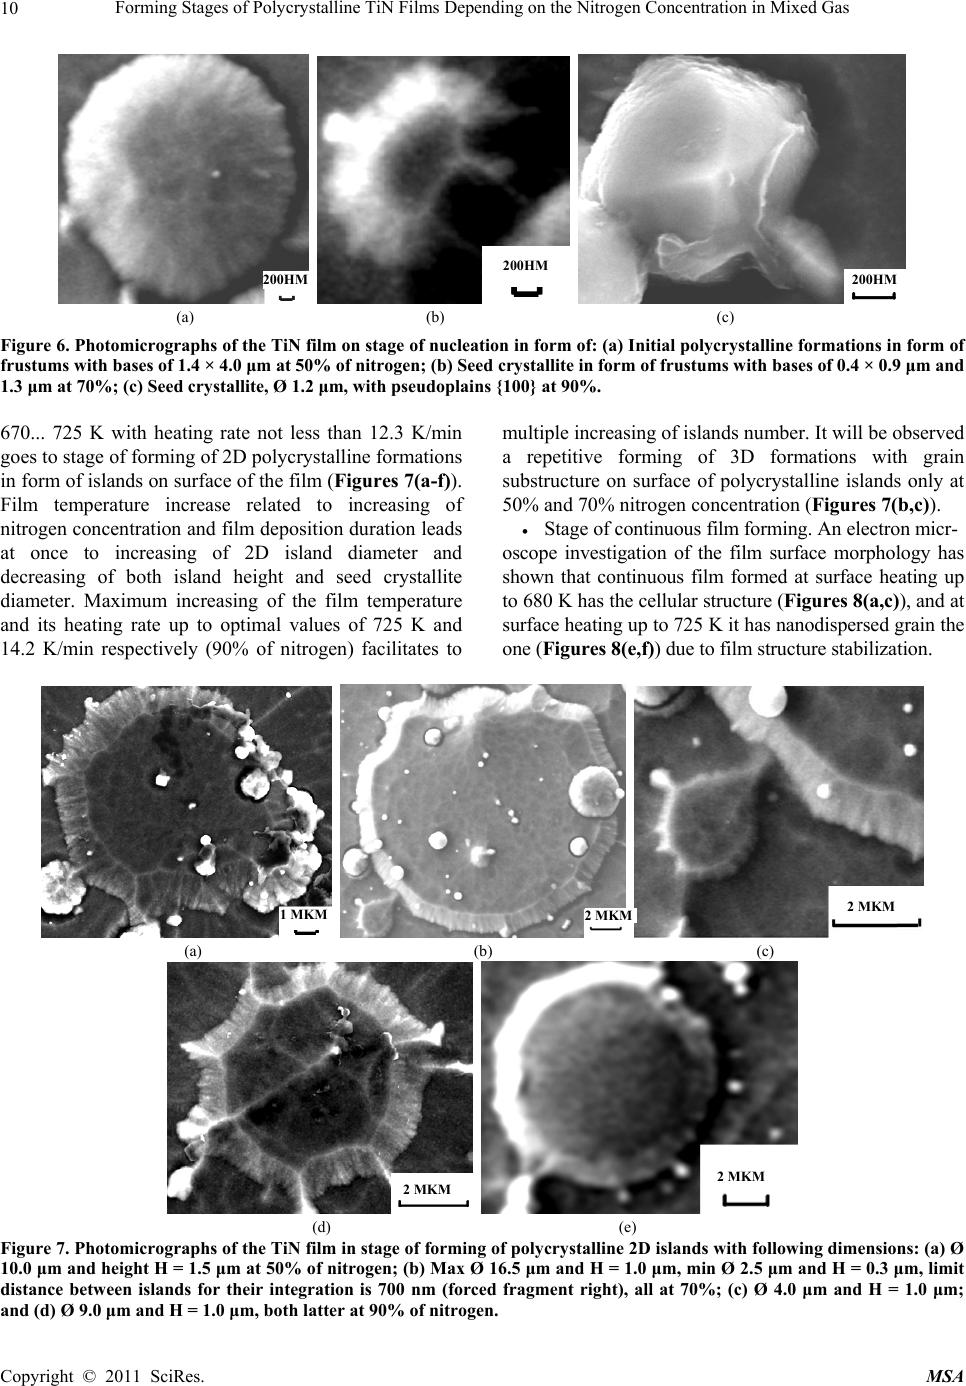
Forming
of
polycrysta
lline 2D
island s
Forming
of
continuou
s
polycrysta
lline film
Forming of 3D
ordered grain (70%)
and 2D ordered
column (90%)
formations on the
continuous film
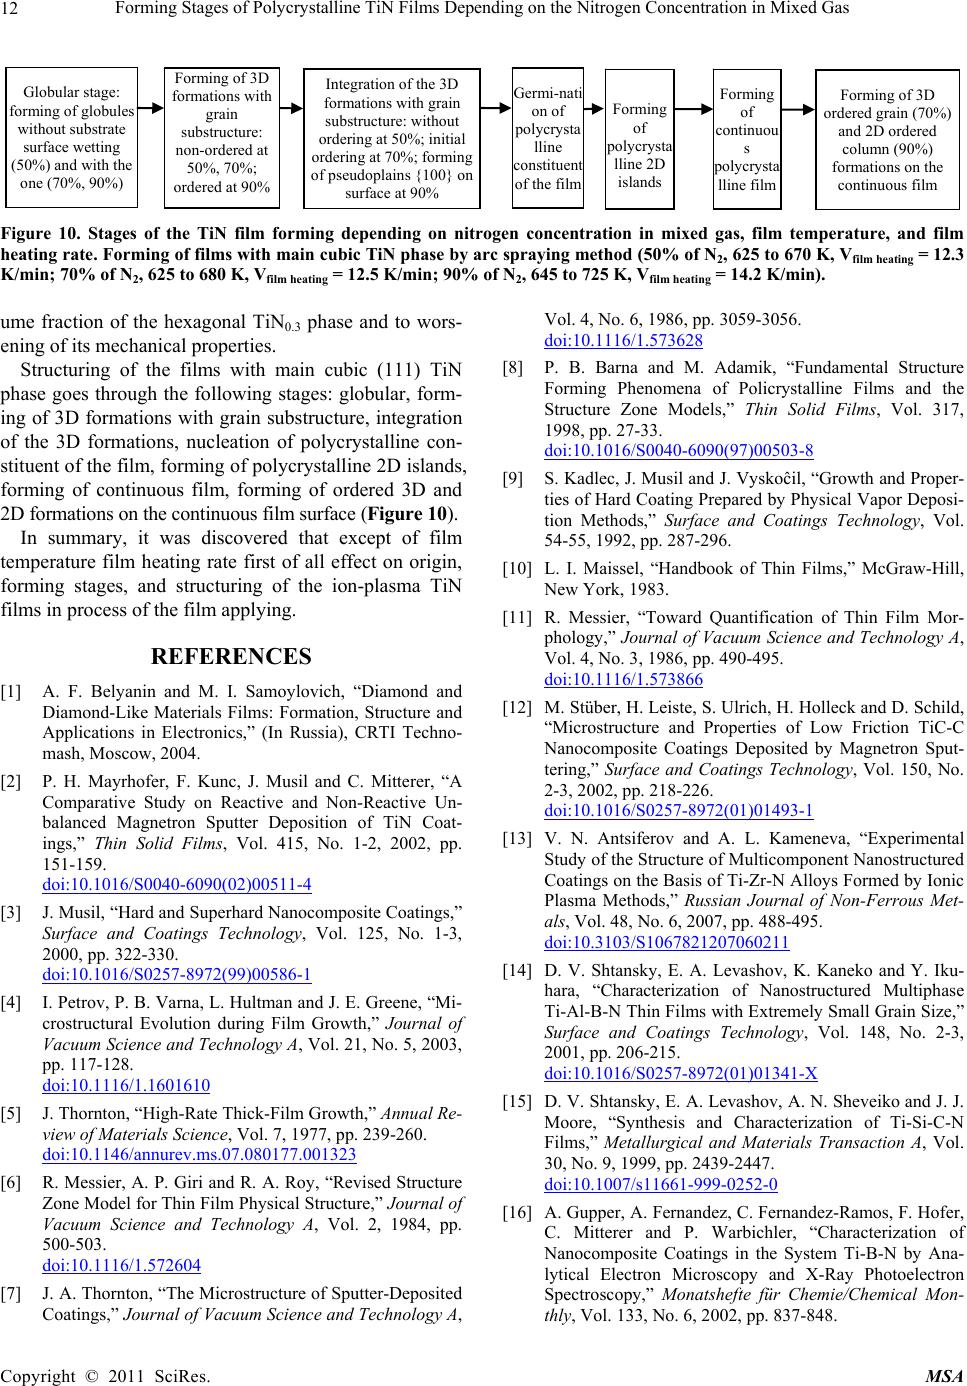
Figure 10. Stages of the TiN film forming depending on nitrogen concentration in mixed gas, film temperature, and film
heating rate. Forming of films with main cubic TiN phase by arc spraying method (50% of N2, 625 to 670 K, Vfilm heating = 12.3
K/min; 70% of N2, 625 to 680 K, Vfilm heating = 12.5 K/min; 90% of N2, 645 to 725 K, Vfilm heating = 14.2 K/min).
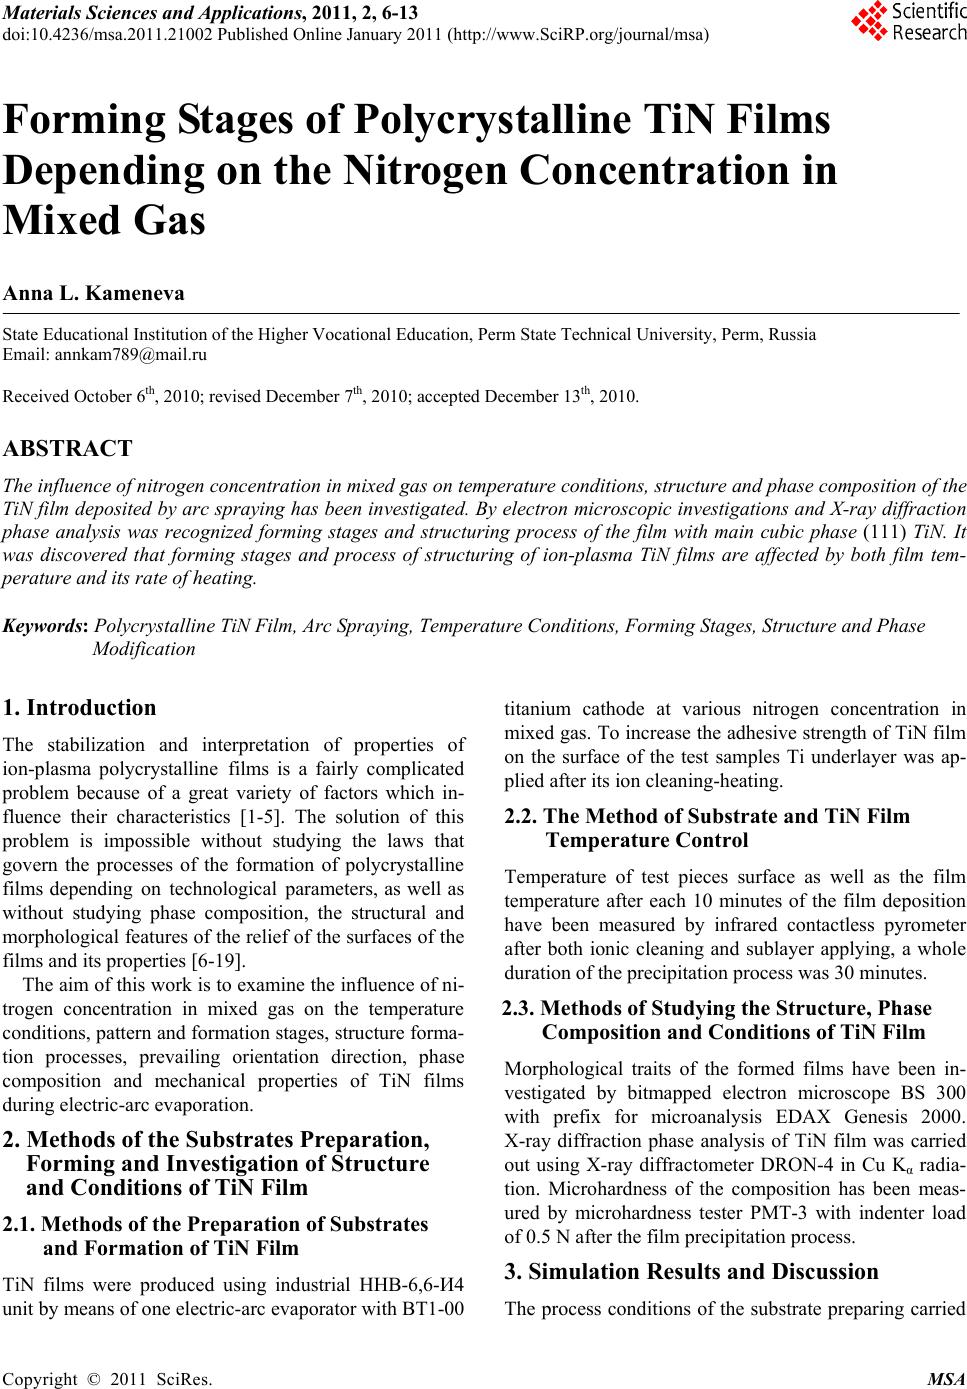
ume fraction of the hexagonal TiN0.3 phase and to wors-
ening of its mechanical properties.
Structuring of the films with main cubic (111) TiN
phase goes through the following stages: globular, form-
ing of 3D formations with grain substructure, integration
of the 3D formations, nucleation of polycrystalline con-
stituent of the film, forming of polycrystalline 2D islands,
forming of continuous film, forming of ordered 3D and
2D formations on the continuous film surface (Figure 10).
In summary, it was discovered that except of film
temperature film heating rate first of all effect on origin,
forming stages, and structuring of the ion-plasma TiN
films in process of the film applying.
REFERENCES
[1] A. F. Belyanin and M. I. Samoylovich, “Diamond and
Diamond-Like Materials Films: Formation, Structure and
Applications in Electronics,” (In Russia), CRTI Techno-
mash, Moscow, 2004.
[2] P. H. Mayrhofer, F. Kunc, J. Musil and C. Mitterer, “A
Comparative Study on Reactive and Non-Reactive Un-
balanced Magnetron Sputter Deposition of TiN Coat-
ings,” Thin Solid Films, Vol. 415, No. 1-2, 2002, pp.
151-159.
doi:10.1016/S0040-6090(02)00511-4
[3] J. Musil, “Hard and Superhard Nanocomposite Coatings,”
Surface and Coatings Technology, Vol. 125, No. 1-3,
2000, pp. 322-330.
doi:10.1016/S0257-8972(99)00586-1
[4] I. Petrov, P. B. Varna, L. Hultman and J. E. Greene, “Mi-
crostructural Evolution during Film Growth,” Journal of
Vacuum Science and Technology A, Vol. 21, No. 5, 2003,
pp. 117-128.
doi:10.1116/1.1601610
[5] J. Thornton, “High-Rate Thick-Film Growth,” Annual Re-
view of Materials Science, Vol. 7, 1977, pp. 239-260.
doi:10.1146/annurev.ms.07.080177.001323
[6] R. Messier, A. P. Giri and R. A. Roy, “Revised Structure
Zone Model for Thin Film Physical Structure,” Journal of
Vacuum Science and Technology A, Vol. 2, 1984, pp.
500-503.
doi:10.1116/1.572604
[7] J. A. Thornton, “The Microstructure of Sputter-Deposited
Coatings,” Journal of Vacuum Science and Technology A,
Vol. 4, No. 6, 1986, pp. 3059-3056.
doi:10.1116/1.573628
[8] P. B. Barna and M. Adamik, “Fundamental Structure
Forming Phenomena of Policrystalline Films and the
Structure Zone Models,” Thin Solid Films, Vol. 317,
1998, pp. 27-33.
doi:10.1016/S0040-6090(97)00503-8
[9] S. Kadlec, J. Musil and J. Vyskoĉil, “Growth and Proper-
ties of Hard Coating Prepared by Physical Vapor Deposi-
tion Methods,” Surface and Coatings Technology, Vol.
54-55, 1992, pp. 287-296.
[10] L. I. Maissel, “Handbook of Thin Films,” McGraw-Hill,
New York, 1983.
[11] R. Messier, “Toward Quantification of Thin Film Mor-
phology,” Journal of Vacuum Science and Technology A,
Vol. 4, No. 3, 1986, pp. 490-495.
doi:10.1116/1.573866
[12] M. Stüber, H. Leiste, S. Ulrich, H. Holleck and D. Schild,
“Microstructure and Properties of Low Friction TiC-C
Nanocomposite Coatings Deposited by Magnetron Sput-
tering,” Surface and Coatings Technology, Vol. 150, No.
2-3, 2002, pp. 218-226.
doi:10.1016/S0257-8972(01)01493-1
[13] V. N. Antsiferov and A. L. Kameneva, “Experimental
Study of the Structure of Multicomponent Nanostructured
Coatings on the Basis of Ti-Zr-N Alloys Formed by Ionic
Plasma Methods,” Russian Journal of Non-Ferrous Met-
als, Vol. 48, No. 6, 2007, pp. 488-495.
doi:10.3103/S1067821207060211
[14] D. V. Shtansky, E. A. Levashov, K. Kaneko and Y. Iku-
hara, “Characterization of Nanostructured Multiphase
Ti-Al-B-N Thin Films with Extremely Small Grain Size,”
Surface and Coatings Technology, Vol. 148, No. 2-3,
2001, pp. 206-215.
doi:10.1016/S0257-8972(01)01341-X
[15] D. V. Shtansky, E. A. Levashov, A. N. Sheveiko and J. J.
Moore, “Synthesis and Characterization of Ti-Si-C-N
Films,” Metallurgical and Materials Transaction A, Vol.
30, No. 9, 1999, pp. 2439-2447.
doi:10.1007/s11661-999-0252-0
[16] A. Gupper, A. Fernandez, С. Fernandez-Ramos, F. Hofer,
С. Mitterer and P. Warbichler, “Characterization of
Nanocomposite Coatings in the System Ti-B-N by Ana-
lytical Electron Microscopy and X-Ray Photoelectron
Spectroscopy,” Monatshefte für Chemie/Chemical Mon-
thly, Vol. 133, No. 6, 2002, pp. 837-848.
Copyright © 2011 SciRes. MSA