 American Journal of Plant Sciences, 2013, 4, 1736-1743 http://dx.doi.org/10.4236/ajps.2013.49213 Published Online September 2013 (http://www.scirp.org/journal/ajps) Effect of Treated Waste Water Irrigation on Plant Growth and Soil Properties in Gaza Strip, Palestine Yasser El-Nahhal1,2, Khalil Tubail1, Mohamad Safi1, Jamal Safi1,3* 1Environmental Protection and Research Institute, Gaza, Palestine; 2The Islamic University of Gaza, Gaza, Palestine; 3Al-Azhar University of Gaza, Gaza, Palestine. Email: *eprigaza@palnet.com Received June 30th, 2013; revised July 30th, 2013; accepted August 10th, 2013 Copyright © 2013 Yasser El-Nahhal et al. This is an open access article distributed under the Creative Commons Attribution License, which permits unrestricted use, distribution, and reproduction in any medium, provided the original work is properly cited. ABSTRACT This study investigated the effect of treated wastewater (TWW) irrigation on growth of Chinese cabbage and corn and on soil properties in Gaza Strip, Palestine. Chinese cabbage and corn were planted in winter and summer seasons re- spectively in a sandy soil. The experimental design was a randomized complete block using 2 treatments with 4 repli- cates. Soil samples were collected from 0.0 - 120 cm depths from all plots and analyzed for pH, electric conductivity (EC) and nutrient contents. The plants were irrigated with either TWW or fresh water (FW) fortified with NPK, while control used drip irrigation system. The biomass (total fresh weight of the plants) was used as an indicator of the plant yields. Concentration of heavy metals on plant leaves was determined by Inductive Coupled Plasma Analyzer (ICP) and was taken as an indicator of plant quality. Biomass of Chinese cabbage and corn grown in plots irrigated with TWW was higher than those grown in plots irrigated with FW. These results indicate the ability of TWW supplying the neces- sary nutrients for plant growth. Heavy metal content in plant leaves in all treatments (TWW and FW) was nearly similar and below EPA standards, indicating high quality of plants. Soil analysis showed great changes in soil properties due to irrigation with TWW. The interesting outcome of this study is that TWW is an effective source for plant nutrients. It is encouraging to reuse TWW in agricultural system after full treatment. Keywords: TWW; FW; Corn; Chinese Cabbage; Heavy Metals 1. Introduction The quantity of treated wastewater (TWW) in Gaza is about 111,900 m3/day [1]. This quantity is expected to increase during the coming years due to population growth. Guidelines for safe and effective reuse of TWW for agricultural purposes are not yet approved by the Palestinian Authority, or any Research Institute. Regard- less of this fact, this high quantity of TWW should be reused in the agricultural or industrial sectors to solve the problem of water quality in Gaza Strip Palestine. Al- though TWW in Gaza did not meet the international standards, several trials have been made by international institutions in Gaza for the reuse of TWW in agriculture. For instance, effluent from the existing Gaza waste water treatment plants (WWTP) is currently being used by farmers through pilot projects funded by the Spanish and French governments. In the Spanish project the trial in- cludes irrigation of citrus and olive trees in Gaza area (Stawi Farm in Al Zeitoon area, 100 dunums), and in the French project the trial includes irrigation of forage crops in North area ( beit Lahia, 40 dunums). Obviously, these trials are not based on scientific research. They used the TWW without looking into the quality of the products or the effect of TWW in soil properties. Nevertheless, elsewhere several investigations have been made to evaluate the quality of TWW for possible reuse in agricultural sectors. For instance, Evett et al. [2] evaluated the feasibility of using TWW irrigation strate- gies based on 1) water use of different tree species, 2) weather conditions in different climate zones of Egypt, 3) soil types and available irrigation systems, and 4) the re- quirement to avoid deep percolation losses that could lead to groundwater contamination. They concluded that drip irrigation systems are preferred to achieve several small irrigations per day in order to avoid deep percola- tion losses. Mendoza-Espinosa et al. [3] evaluated the effect of treated wastewater on the growth of cabernet sauvignon and merlot grapes from the Guadalupe Valley, *Corresponding author. Copyright © 2013 SciRes. AJPS  Effect of Treated Waste Water Irrigation on Plant Growth and Soil Properties in Gaza Strip, Palestine 1737 Mexico. They reported that the number of leaves per shoot and the overall biomass increased in plants irri- gated with wastewater and grape production per plant was 20% higher and the concentration of carbohydrates, organic acids and pH were similar in grapes from vines irrigated with wastewater to those irrigated with ground- water. Oron et al. [4] evaluated the influence of TWW on sustainable agricultural production and safe groundwater recharge using filed experiment. They reported that ul- trafiltration stage is efficient in the removal of the pa- thogens and suspended organic matter while the succes- sive Reverse Osmosis (RO) stage provides safe removal of the dissolved solids (salinity). Best agricultural yields were obtained when applying effluent had minimal con- tent of dissolved solids (after the RO stage) as compared with secondary effluent without any further treatment and extended storage. Mosse et al. [5] investigated the effect of application of winery wastewaters to physico- chemical properties of soils. They concluded that long- term application of winery wastewaters had significant impacts on soil respiration, nitrogen cycling and micro- bial community structure, but the treated wastewater ap- plication showed no significant differences in wetting alone. Singh et al. [6] investigated the effect of land ap- plication of sewage sludge on the physicochemical pro- perties of soils. They concluded that amending soil with sewage sludge modified the physicochemical properties of soils, and might contaminate ground water, stock ponds, or produce food chain contamination from eating food grown in sludge-treated land. Castro et al. [7] stud- ied the effects of wastewater irrigation on turfgrass growth, and reported that plants irrigated with treated wastewater had the highest sodium content. Pritchard et al. [8] investigated the risks of the environment and food crops that may come from land application of sewage sludge in Australia. They reported that the attention was given to researches related to plant nutrient uptake, par- ticularly nitrogen and phosphorus (including reduced phosphorus uptake in alum sludge-amended soil); the risk of heavy metal uptake by plants, specifically cad- mium, copper and zinc; the risk of pathogen contamina- tion in soil and grain products; change of soil pH. Bel- yaeva et al. [9] investigated the effects of adding biosol- ids to a green waste feedstock (100% green waste, 25% v/v biosolids or 50% biosolids) on the properties of com- posted products. They found that addition of biosolids to the feedstock increased total N, EC, extractable NH(4), NO(3) and P but lowered pH, macroporosity, water hold- ing capacity, microbial biomass C and basal respiration in composts. This paper investigates the effect of TWW irrigation on Chinese cabbage and corn growth and qual- ity and on soil properties in Gaza Soil. 2. Materials and Methods 2.1. Environmental Background of the Study Area Gaza Strip is a semi-arid region of roughly 365 km2 which lies on the Mediterranean Sea. On this narrow strip, almost 1.625 million of the Palestinian people live and work [10]. The ground water is used for irrigation, industrial and domestic purposes. A “Catastrophic” water shortage, water pollution with high salinity and micro- pollutants, lack of sewage and solid waste treatment, ma- ritime pollution, overcrowding, poverty and uncontrolled use of pesticides are the most pressing environmental problems in the Gaza Strip. Internationally suspended, banned and canceled pesticides which considered muta- genic and carcinogenic are still used in the agricultural environment. The wastewater sector in the Gaza Strip is characterized by poor sanitation, insufficient treatment and unsafe disposal. Currently, there are four wastewater treatment plants in operation in the Gaza Strip namely: Beit Lahia, Gaza, Khan Younis and Rafah Wastewater Treatment Plants (WWTP’s) receiving about 24 Million m3 of raw sewage per year. 2.2. Experimental Design The experimental site was selected as sandy soil in the north zone of the Gaza Strip. Two treatments were se- lected: one irrigated with TWW and the other with fresh water ( FW). Each treatment contains 4 replicates (plots). Plot dimensions are 5 × 4 m. Each plot is divided into 5 rows for planting (12 plants in each row). The experi- mental design was established as a randomized complete block design. Chinese cabbage seedlings were planted for first season on 28/11/2010 and harvested on 9/3/2011 and for the 2nd season on 11/11/2011 and harvested on 21/2/2012. Corn seeds were sown for the 1st season on 21/3/2011 and harvested on 25/6/2011 and for 2nd sea- son 21/3/2012 and harvested on 25/6/2012. 2.3. Soil Analysis Soil samples from depths of 0.0 - 30, 30 - 60, 60 - 90 and 90 - 120 cm depth were collected from eight soil profiles dug in all plots. The soil samples were air dried, sieved through 2 mm mesh and kept in plastic bags in the labo- ratory for pH, EC and nutrient contents using the stan- dard methods. 2.4. Irrigation Water and Analysis Treated wastewater (TWW) from Beit Lahia wastewater treatment plant and fresh water (FW) from local well were used for irrigation. The irrigated plants are Chinese cabbage as winter crop and corn (Zea maiz, Variety Copyright © 2013 SciRes. AJPS  Effect of Treated Waste Water Irrigation on Plant Growth and Soil Properties in Gaza Strip, Palestine 1738 Merit) as summer crop was grown on a sandy soil. Irri- gation was managed by a drip irrigation system with discharge of 4 L/plant/h according to the standard water requirements [11]. Samples of TWW and FW were analyzed for physico- chemical properties following the procedure described in the standard method [12]. 2.5. Harvesting, Plant Sampling and Preparation Plants were harvested after four months of planting day or by the end of each season. The biomass of Chinese cabbage and corn were collected and weighed and used as growth indicator. Chinese cabbage and corn leaves were sampled ran- domly from several plants of each plot on the harvesting day at the end of winter season, whereas, corn leaves were sampled at the end of summer season. Leave sam- ples were collected from several plants of each plot. The samples were washed with tap water to remove atmos- pheric dust sand and then washed with distilled water. Leave samples were then oven dried at 65˚C for 48 hours, ground and kept in well sealed plastic bags and stored at room temperature for elemental analysis. 2.6. Elemental Analysis About 0.5 g of oven dried leave sample as mentioned above was digested with concentrated nitric acid in glass tube at 80˚C for 48 - 72 h then heated up to 120˚C for 4 - 8 h to have clear solution as previously described [13]. Samples then were cooled and diluted with distilled wa- ter up to 25 ml, filtered using small glass or plastic fun- nels pre-washed with sulfuric acid. Elements concentra- tion in the filtrate was determined using ICP. Two de- terminations were conducted per replicate 2.7. Data Analysis The data were statistically analyzed using mean and standard deviations. Analysis of variance between treat- ments was conducted using T-Test. P-values associated with T-test were taken as an indicator of significant dif- ferences among the treatments. P-values are presented below Tables. P-values less than 0.05 are considered sig- nificant. 3. Results and Discussion 3.1. Soil Analysis Soil components and soil texture of the field plots are shown in Table 1. It can be seen the clay fraction of soil ranged between 2% - 5% in different depths of the soil profiles. Accordingly soil can be classified as sandy soil. Furthermore, the sand fraction of soils in all depths ranged between 91% - 94% indicating sand texture of soil. Biological, physical and chemical properties of irriga- tion water are shown in Tables 2. BOD, COD, TSS, and EC stand for: biological oxygen demand, chemical oxygen demand, total suspended sol- ids and electric conductivity, respectively. It can be seen that BOD, COD and TSS are nil in FW whereas high values are observed in TWW. In addition, nitrate level in FW is higher than in TWW. The explana- tion of these results is that FW is nitrogen phosphorus Table 1. Soil fractions and texture. Depth (cm) Sand % Silt % Clay % Soil Texture 0 - 30 94 4 2 Sandy 30 - 60 92 5 3 Sandy 60 - 90 91 4 5 Sandy 90 - 120 92 4 4 Sandy Table 2. biological and chemical properties of irrigation water, 2011. Properties FW TWW BOD (mg/L) - 95.8 COD (mg/L) - 242.3 TSS (mg/L) - 108.7 pH 8.22 8.41 EC (dsim/m) 2.39 2.2 N-NO3 (mg/L) 38.9 1.6 N-NH4 (mg/L) - 51.6 K mg/l 3.8 21.7 Na (mg/L) 115 159 Ca mg/L 215 112 Mg 36 41 SAR 1.9 3.3 S mg/L 34 20 P mg/L 0.07 4.89 B (ppm) 0.07 0.17 Cl (ppm) 505 351 Cr (ppm) 0.005 0.001 Cu (ppm) 0.002 0.003 Fe (ppm) 0.002 0.009 Mn (ppm) 0.001 0.002 Ni (ppm) 0.016 0.018 Copyright © 2013 SciRes. AJPS  Effect of Treated Waste Water Irrigation on Plant Growth and Soil Properties in Gaza Strip, Palestine 1739 potassium (NPK) fortified whereas in TWW the nitrate level is being reduced to ammonium hydroxide due to an aerobic condition. Accordingly low level of nitrate is available in TWW. Sodium and Potassium are several times higher in TWW than in FW. Calcium concentration is higher in FW than in TWW whereas Magnesium has opposite direction. Sulfur concentration is higher in FW than TWW due to possible transformation of sulfate to hydrogen sulfide in TWW due to an aerobic conditions. Phosphorus and Barium are higher in TWW than in FW. Chloride is higher in FW than in TWW due to chlorine- tion process in drinking water. Heavy metal contents ranged from 0.001 to 0.018 ppm in FW and TWW indi- cating low contents. Comparison with EPA standards shows that the properties of the used water are within the range. Accordingly, the current water situation may be used for agricultural irrigation. The following: Ag, As, Bi, Cd, Co, Hg, Mo, Pb, Se and Sn were not detected in the used water. Table 3 shows pH and EC values for the soil profiles. It is obvious that pH values ranged between 7.69 ± 0.21 to 8.05 ± 0.15 in FW and from 7.75 ± 0.1 to 8.1 ± 0.01 in TWW plots. It is obvious that soil is more acidic at the top layers 0.0 - 30 cm depth and less acidic at deeper depths in FW and TWW plots. EC values are high in the top soil layers (Table 3) and several times lower in deeper depths (90 - 120 cm) in both FW and TWW plots. This may be due to accumulation of less soluble salts in the tope soil layer and possible formation of organic acids due to biodegra- dation of organic compounds in soils. These results are in accord with Belyaeva et al. [9] who found lower pH in the top soil due to addition of biosolids. Statistical analysis for comparison between pH, and EC values in soil profiles of 2011 does not show signifi- cant differences in pH and EC values in TWW and FW. P-values are 0.18 and 0.43 respectively. Our results agree with Castro et al. [7] who investi- gated the effects of wastewater irrigation on soil proper- ties and turfgrass growth and concluded that there were no negative effects with respect to changes in soil pH but a significant increase in electrical conductivity and so- dium content was observed in wastewater-irrigated soil. Table 3. pH, and EC (dS/m) of soil profile, 2011. FW TWW Depth (cm) pH EC (dS/m) pH EC (dS/m) 0 - 30 7.69 0.21 0.57 0.25 7.73 0.1 0.52 0.21 30 - 60 7.88 0.21 0.27 0.06 8.08 0.14 0.27 0.07 60 - 90 7.89 0.12 0.18 (0.02) 8.05 0.16 0.15 0.02 90 - 120 8.05 0.15 0.15 0.01 8.10 0.14 0.14 0.02 Nitrate concentrations (Table 4) decreased from the top 0 - 30 to deeper depths in both treatments (TWW and FW). Nitrate concentration of the soil 0 - 30 of FW-pro- file is lower than TWW-profile as well as higher than other depths. Chloride concentrations of soil profile are higher in the FW-samples than in the TWW-treated samples. Statistical analysis for comparison between N-NO3, and Cl− values in soil profiles of 2011 does not show significant differ- ences in N-NO3, and Cl− values in TWW and FW. P- values are 0.2 and 0.34 respectively. Our results agree with Boruah and Hazarika [14] who concluded that avai- lable N, K, S and exchangeable and water soluble Na, K, Ca, Mg were highest in effluent irrigated soil. Regardless to the highest values of organic matter that found at depth 30 - 60 cm (Table 5), the mount of or- ganic carbon decreased from the top to deeper depths in both treatments (FW and TWW). Statistical analysis shows no differences between treatments, P-value equals to 0.45. Our results agree with Adrover et al. [15] who inves- tigated the chemical properties and biological activity in soils of Mallorca following twenty years of treated waste- water irrigation and did not observe negative effects on cation exchange capacity, pH, calcium carbonate equiva- lent, and soil organic matter. Macronutrients, micronutrients and heavy metal con- centrations in soil profiles are presented in Tables 6-8. It can be seen that the concentrations of P (Table 6) are ranged between 0.19 - 0.58 ppm in all depths of FW and TWW treatments. This low value is due to low solu- bility of P in soil solution due to high soil pH (Table 3). These results agree with Metson et al. [16] who found Table 4. N-NO3 and Cl− concentrations (mmol) in soil water extract (1:1). FW TWW Depth (cm) N-NO3 Cl− N-NO3 Cl− 0 - 30 0.76 0.223.0 1.78 1.01 0.43 2.8 1.35 30 - 60 0.46 0.261.09 0.56 0.64 0.38 1.1 0.44 60 - 90 0.41 0.050.62 0.26 0.49 0.15 0.34 0.21 90 - 120 0.32 0.020.43’ 0.35 0.41 0.23 0.39 0.11 Table 5. Total organic carbon (ppm) of soil profile, 2011. Depth (cm) FW TWW 0 - 30 26.2 2.75 27.7 10.9 30 - 60 32.1 23.7 27.5 13.6 60 - 90 15.6 3.48 14.76 4.33 90 - 120 12.0 1.23 12.61 2.95 Copyright © 2013 SciRes. AJPS 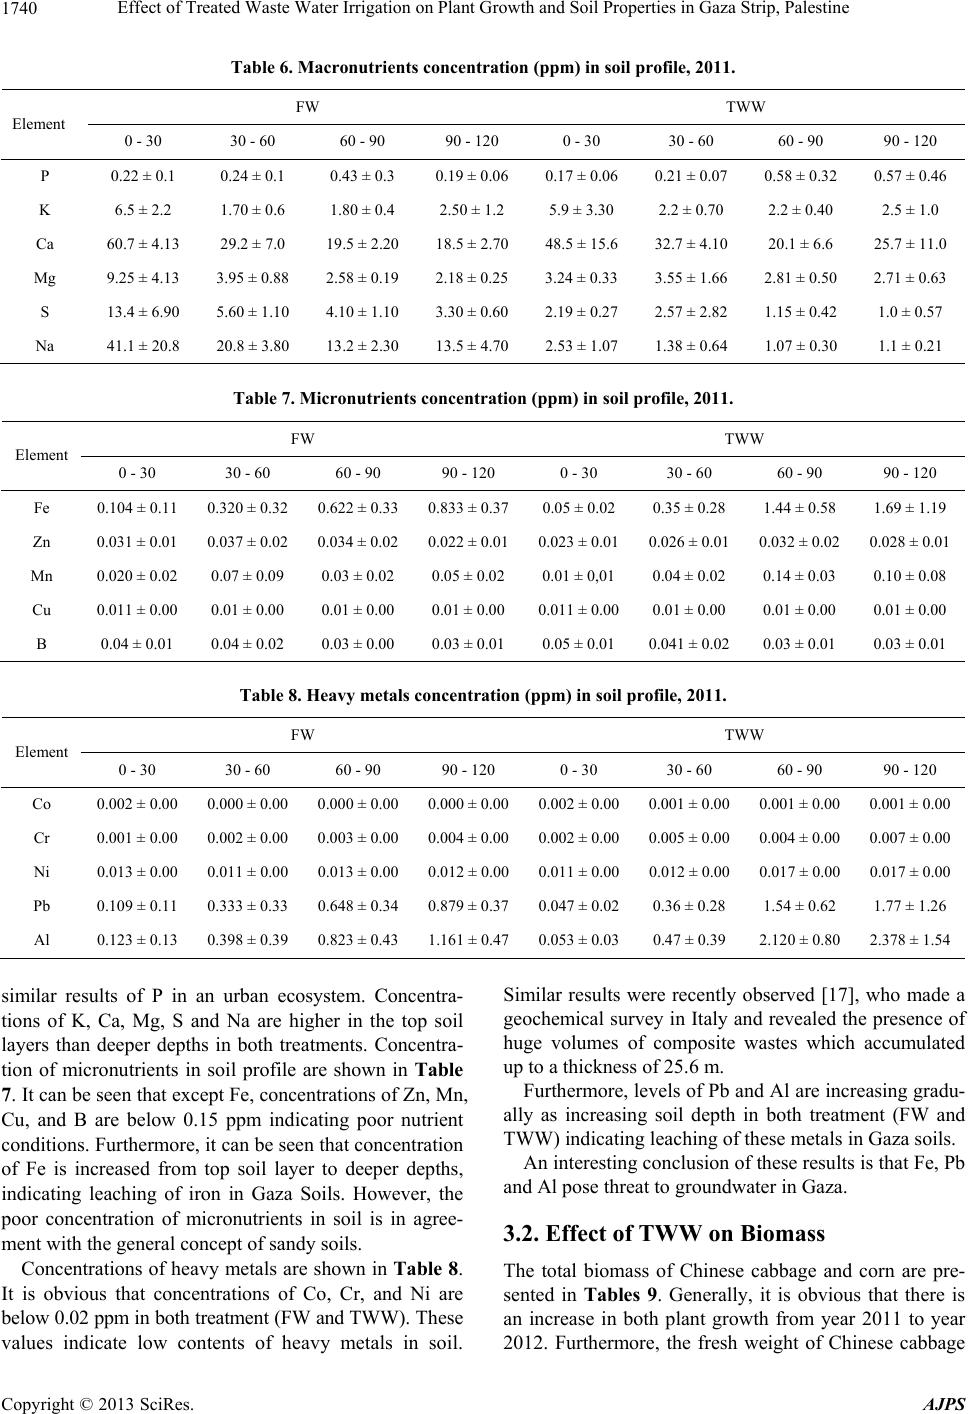 Effect of Treated Waste Water Irrigation on Plant Growth and Soil Properties in Gaza Strip, Palestine Copyright © 2013 SciRes. AJPS 1740 Table 6. Macronutrients concentration (ppm) in soil profile, 2011. FW TWW Element 0 - 30 30 - 60 60 - 90 90 - 120 0 - 30 30 - 60 60 - 90 90 - 120 P 0.22 ± 0.1 0.24 ± 0.1 0.43 ± 0.3 0.19 ± 0.06 0.17 ± 0.06 0.21 ± 0.07 0.58 ± 0.32 0.57 ± 0.46 K 6.5 ± 2.2 1.70 ± 0.6 1.80 ± 0.4 2.50 ± 1.2 5.9 ± 3.30 2.2 ± 0.70 2.2 ± 0.40 2.5 ± 1.0 Ca 60.7 ± 4.13 29.2 ± 7.0 19.5 ± 2.20 18.5 ± 2.70 48.5 ± 15.6 32.7 ± 4.10 20.1 ± 6.6 25.7 ± 11.0 Mg 9.25 ± 4.13 3.95 ± 0.88 2.58 ± 0.19 2.18 ± 0.25 3.24 ± 0.33 3.55 ± 1.66 2.81 ± 0.50 2.71 ± 0.63 S 13.4 ± 6.90 5.60 ± 1.10 4.10 ± 1.10 3.30 ± 0.60 2.19 ± 0.27 2.57 ± 2.82 1.15 ± 0.42 1.0 ± 0.57 Na 41.1 ± 20.8 20.8 ± 3.80 13.2 ± 2.30 13.5 ± 4.70 2.53 ± 1.07 1.38 ± 0.64 1.07 ± 0.30 1.1 ± 0.21 Table 7. Micronutrients concentration (ppm) in soil profile, 2011. FW TWW Element 0 - 30 30 - 60 60 - 90 90 - 120 0 - 30 30 - 60 60 - 90 90 - 120 Fe 0.104 ± 0.11 0.320 ± 0.32 0.622 ± 0.330.833 ± 0.370.05 ± 0.02 0.35 ± 0.28 1.44 ± 0.58 1.69 ± 1.19 Zn 0.031 ± 0.01 0.037 ± 0.02 0.034 ± 0.020.022 ± 0.010.023 ± 0.010.026 ± 0.01 0.032 ± 0.02 0.028 ± 0.01 Mn 0.020 ± 0.02 0.07 ± 0.09 0.03 ± 0.02 0.05 ± 0.02 0.01 ± 0,01 0.04 ± 0.02 0.14 ± 0.03 0.10 ± 0.08 Cu 0.011 ± 0.00 0.01 ± 0.00 0.01 ± 0.00 0.01 ± 0.00 0.011 ± 0.000.01 ± 0.00 0.01 ± 0.00 0.01 ± 0.00 B 0.04 ± 0.01 0.04 ± 0.02 0.03 ± 0.00 0.03 ± 0.01 0.05 ± 0.01 0.041 ± 0.02 0.03 ± 0.01 0.03 ± 0.01 Table 8. Heavy metals concentration (ppm) in soil profile, 2011. FW TWW Element 0 - 30 30 - 60 60 - 90 90 - 120 0 - 30 30 - 60 60 - 90 90 - 120 Co 0.002 ± 0.00 0.000 ± 0.00 0.000 ± 0.000.000 ± 0.000.002 ± 0.000.001 ± 0.00 0.001 ± 0.00 0.001 ± 0.00 Cr 0.001 ± 0.00 0.002 ± 0.00 0.003 ± 0.000.004 ± 0.000.002 ± 0.000.005 ± 0.00 0.004 ± 0.00 0.007 ± 0.00 Ni 0.013 ± 0.00 0.011 ± 0.00 0.013 ± 0.000.012 ± 0.000.011 ± 0.000.012 ± 0.00 0.017 ± 0.00 0.017 ± 0.00 Pb 0.109 ± 0.11 0.333 ± 0.33 0.648 ± 0.340.879 ± 0.370.047 ± 0.020.36 ± 0.28 1.54 ± 0.62 1.77 ± 1.26 Al 0.123 ± 0.13 0.398 ± 0.39 0.823 ± 0.431.161 ± 0.470.053 ± 0.030.47 ± 0.39 2.120 ± 0.80 2.378 ± 1.54 similar results of P in an urban ecosystem. Concentra- tions of K, Ca, Mg, S and Na are higher in the top soil layers than deeper depths in both treatments. Concentra- tion of micronutrients in soil profile are shown in Table 7. It can be seen that except Fe, concentrations of Zn, Mn, Cu, and B are below 0.15 ppm indicating poor nutrient conditions. Furthermore, it can be seen that concentration of Fe is increased from top soil layer to deeper depths, indicating leaching of iron in Gaza Soils. However, the poor concentration of micronutrients in soil is in agree- ment with the general concept of sandy soils. Concentrations of heavy metals are shown in Table 8. It is obvious that concentrations of Co, Cr, and Ni are below 0.02 ppm in both treatment (FW and TWW). These values indicate low contents of heavy metals in soil. Similar results were recently observed [17], who made a geochemical survey in Italy and revealed the presence of huge volumes of composite wastes which accumulated up to a thickness of 25.6 m. Furthermore, levels of Pb and Al are increasing gradu- ally as increasing soil depth in both treatment (FW and TWW) indicating leaching of these metals in Gaza soils. An interesting conclusion of these results is that Fe, Pb and Al pose threat to groundwater in Gaza. 3.2. Effect of TWW on Biomass The total biomass of Chinese cabbage and corn are pre- sented in Tables 9. Generally, it is obvious that there is an increase in both plant growth from year 2011 to year 2012. Furthermore, the fresh weight of Chinese cabbage 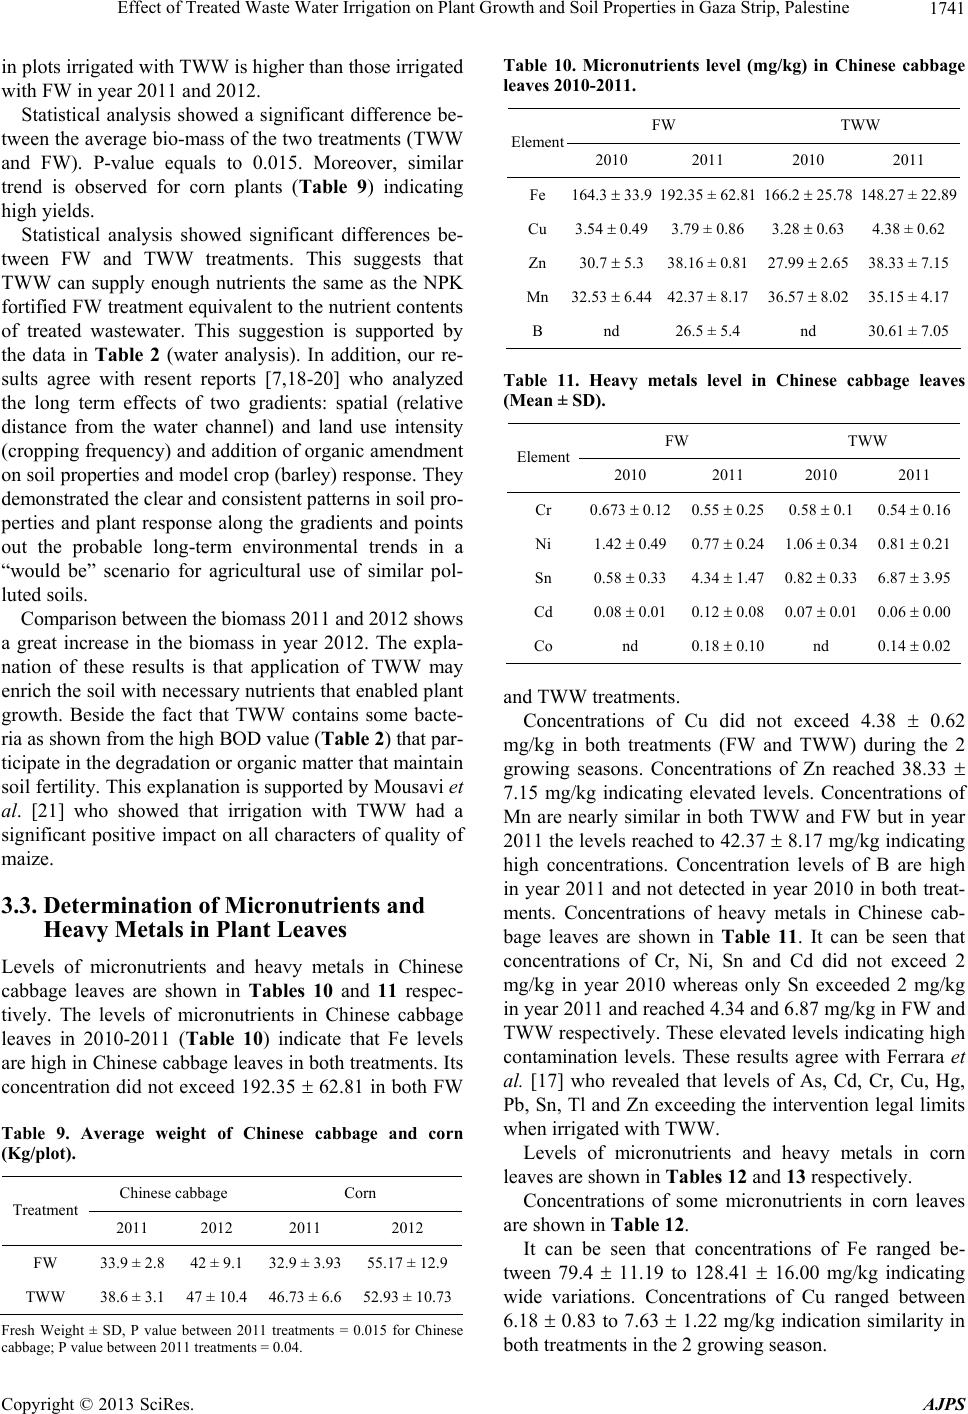 Effect of Treated Waste Water Irrigation on Plant Growth and Soil Properties in Gaza Strip, Palestine 1741 in plots irrigated with TWW is higher than those irrigated with FW in year 2011 and 2012. Statistical analysis showed a significant difference be- tween the average bio-mass of the two treatments (TWW and FW). P-value equals to 0.015. Moreover, similar trend is observed for corn plants (Table 9) indicating high yields. Statistical analysis showed significant differences be- tween FW and TWW treatments. This suggests that TWW can supply enough nutrients the same as the NPK fortified FW treatment equivalent to the nutrient contents of treated wastewater. This suggestion is supported by the data in Table 2 (water analysis). In addition, our re- sults agree with resent reports [7,18-20] who analyzed the long term effects of two gradients: spatial (relative distance from the water channel) and land use intensity (cropping frequency) and addition of organic amendment on soil properties and model crop (barley) response. They demonstrated the clear and consistent patterns in soil pro- perties and plant response along the gradients and points out the probable long-term environmental trends in a “would be” scenario for agricultural use of similar pol- luted soils. Comparison between the biomass 2011 and 2012 shows a great increase in the biomass in year 2012. The expla- nation of these results is that application of TWW may enrich the soil with necessary nutrients that enabled plant growth. Beside the fact that TWW contains some bacte- ria as shown from the high BOD value (Table 2) that par- ticipate in the degradation or organic matter that maintain soil fertility. This explanation is supported by Mousavi et al. [21] who showed that irrigation with TWW had a significant positive impact on all characters of quality of maize. 3.3. Determination of Micronutrients and Heavy Metals in Plant Leaves Levels of micronutrients and heavy metals in Chinese cabbage leaves are shown in Tables 10 and 11 respec- tively. The levels of micronutrients in Chinese cabbage leaves in 2010-2011 (Table 10) indicate that Fe levels are high in Chinese cabbage leaves in both treatments. Its concentration did not exceed 192.35 62.81 in both FW Table 9. Average weight of Chinese cabbage and corn (Kg/plot). Chinese cabbage Corn Treatment 2011 2012 2011 2012 FW 33.9 ± 2.8 42 ± 9.132.9 ± 3.93 55.17 ± 12.9 TWW 38.6 ± 3.1 47 ± 10.446.73 ± 6.6 52.93 ± 10.73 Fresh Weight ± SD, P value between 2011 treatments = 0.015 for Chinese cabbage; P value between 2011 treatments = 0.04. Table 10. Micronutrients level (mg/kg) in Chinese cabbage leaves 2010-2011. FW TWW Element 2010 2011 2010 2011 Fe 164.3 33.9192.35 ± 62.81 166.2 25.78 148.27 ± 22.89 Cu 3.54 0.493.79 ± 0.86 3.28 0.63 4.38 ± 0.62 Zn 30.7 5.338.16 ± 0.81 27.99 2.65 38.33 ± 7.15 Mn 32.53 6.4442.37 ± 8.17 36.57 8.02 35.15 ± 4.17 B nd 26.5 ± 5.4 nd 30.61 ± 7.05 Table 11. Heavy metals level in Chinese cabbage leaves (Mean ± SD). FW TWW Element 2010 2011 2010 2011 Cr 0.673 0.120.55 0.25 0.58 0.1 0.54 0.16 Ni 1.42 0.490.77 0.24 1.06 0.34 0.81 0.21 Sn 0.58 0.334.34 1.47 0.82 0.33 6.87 3.95 Cd 0.08 0.010.12 0.08 0.07 0.01 0.06 0.00 Co nd 0.18 0.10 nd 0.14 0.02 and TWW treatments. Concentrations of Cu did not exceed 4.38 0.62 mg/kg in both treatments (FW and TWW) during the 2 growing seasons. Concentrations of Zn reached 38.33 7.15 mg/kg indicating elevated levels. Concentrations of Mn are nearly similar in both TWW and FW but in year 2011 the levels reached to 42.37 8.17 mg/kg indicating high concentrations. Concentration levels of B are high in year 2011 and not detected in year 2010 in both treat- ments. Concentrations of heavy metals in Chinese cab- bage leaves are shown in Table 11. It can be seen that concentrations of Cr, Ni, Sn and Cd did not exceed 2 mg/kg in year 2010 whereas only Sn exceeded 2 mg/kg in year 2011 and reached 4.34 and 6.87 mg/kg in FW and TWW respectively. These elevated levels indicating high contamination levels. These results agree with Ferrara et al. [17] who revealed that levels of As, Cd, Cr, Cu, Hg, Pb, Sn, Tl and Zn exceeding the intervention legal limits when irrigated with TWW. Levels of micronutrients and heavy metals in corn leaves are shown in Tables 12 and 13 respectively. Concentrations of some micronutrients in corn leaves are shown in Table 12. It can be seen that concentrations of Fe ranged be- tween 79.4 11.19 to 128.41 16.00 mg/kg indicating wide variations. Concentrations of Cu ranged between 6.18 0.83 to 7.63 1.22 mg/kg indication similarity in both treatments in the 2 growing season. Copyright © 2013 SciRes. AJPS 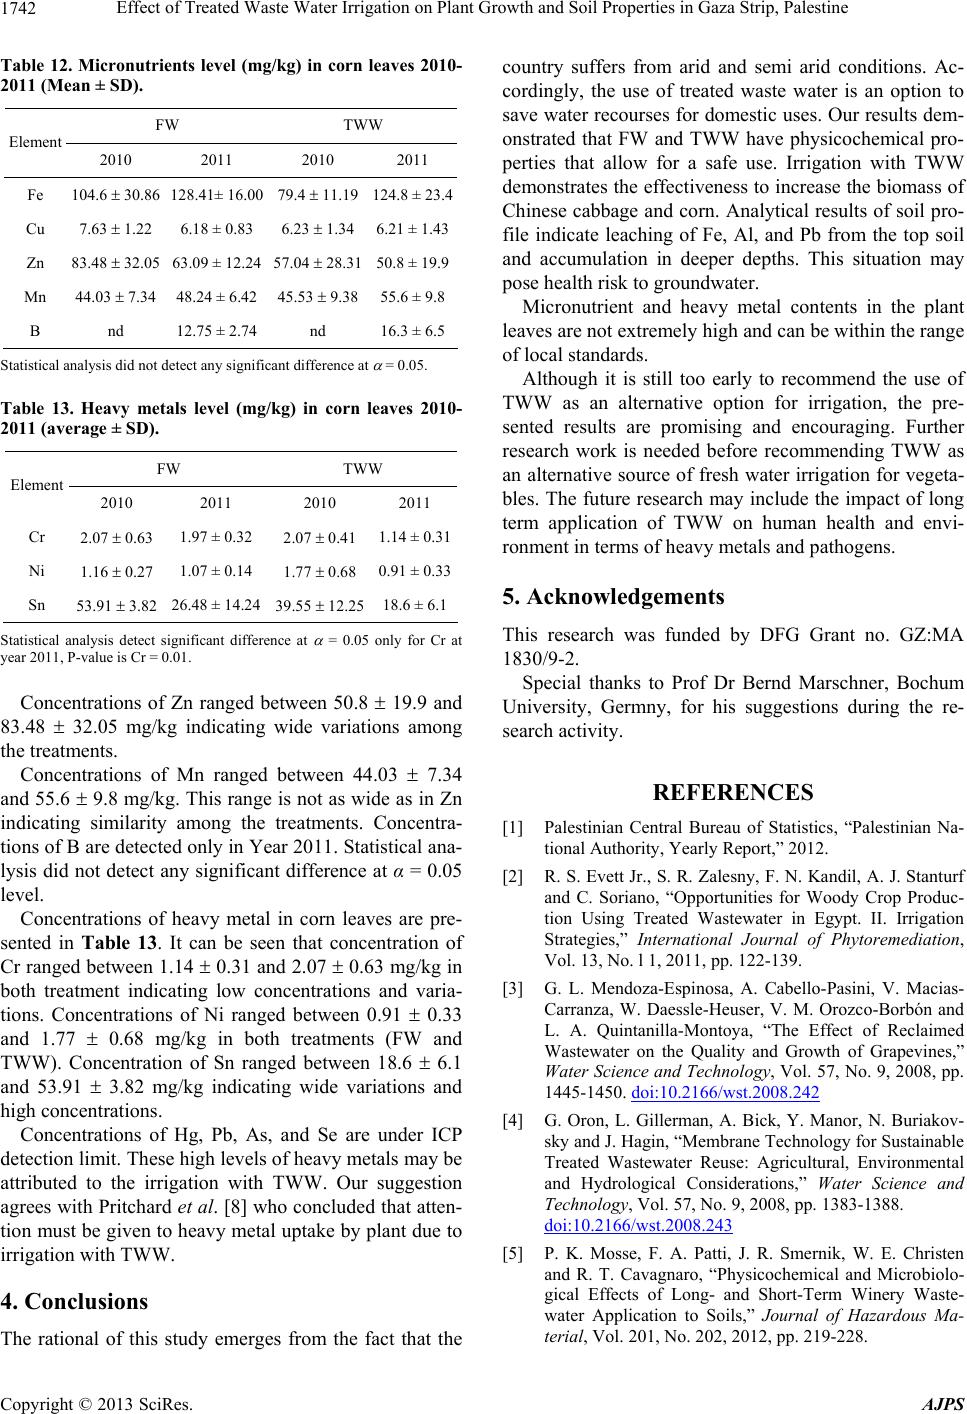 Effect of Treated Waste Water Irrigation on Plant Growth and Soil Properties in Gaza Strip, Palestine 1742 Table 12. Micronutrients level (mg/kg) in corn leaves 2010- 2011 (Mean ± SD). FW TWW Element 2010 2011 2010 2011 Fe 104.6 30.86 128.41± 16.00 79.4 11.19 124.8 ± 23.4 Cu 7.63 1.22 6.18 ± 0.836.23 1.34 6.21 ± 1.43 Zn 83.48 32.05 63.09 ± 12.24 57.04 28.31 50.8 ± 19.9 Mn 44.03 7.34 48.24 ± 6.42 45.53 9.38 55.6 ± 9.8 B nd 12.75 ± 2.74 nd 16.3 ± 6.5 Statistical analysis did not detect any significant difference at = 0.05. Table 13. Heavy metals level (mg/kg) in corn leaves 2010- 2011 (average ± SD). FW TWW Element 2010 2011 2010 2011 Cr 2.07 0.63 1.97 ± 0.322.07 0.41 1.14 ± 0.31 Ni 1.16 0.27 1.07 ± 0.141.77 0.68 0.91 ± 0.33 Sn 53.91 3.82 26.48 ± 14.24 39.55 12.25 18.6 ± 6.1 Statistical analysis detect significant difference at = 0.05 only for Cr at year 2011, P-value is Cr = 0.01. Concentrations of Zn ranged between 50.8 19.9 and 83.48 32.05 mg/kg indicating wide variations among the treatments. Concentrations of Mn ranged between 44.03 7.34 and 55.6 9.8 mg/kg. This range is not as wide as in Zn indicating similarity among the treatments. Concentra- tions of B are detected only in Year 2011. Statistical ana- lysis did not detect any significant difference at α = 0.05 level. Concentrations of heavy metal in corn leaves are pre- sented in Table 13. It can be seen that concentration of Cr ranged between 1.14 0.31 and 2.07 0.63 mg/kg in both treatment indicating low concentrations and varia- tions. Concentrations of Ni ranged between 0.91 0.33 and 1.77 0.68 mg/kg in both treatments (FW and TWW). Concentration of Sn ranged between 18.6 6.1 and 53.91 3.82 mg/kg indicating wide variations and high concentrations. Concentrations of Hg, Pb, As, and Se are under ICP detection limit. These high levels of heavy metals may be attributed to the irrigation with TWW. Our suggestion agrees with Pritchard et al. [8] who concluded that atten- tion must be given to heavy metal uptake by plant due to irrigation with TWW. 4. Conclusions The rational of this study emerges from the fact that the country suffers from arid and semi arid conditions. Ac- cordingly, the use of treated waste water is an option to save water recourses for domestic uses. Our results dem- onstrated that FW and TWW have physicochemical pro- perties that allow for a safe use. Irrigation with TWW demonstrates the effectiveness to increase the biomass of Chinese cabbage and corn. Analytical results of soil pro- file indicate leaching of Fe, Al, and Pb from the top soil and accumulation in deeper depths. This situation may pose health risk to groundwater. Micronutrient and heavy metal contents in the plant leaves are not extremely high and can be within the range of local standards. Although it is still too early to recommend the use of TWW as an alternative option for irrigation, the pre- sented results are promising and encouraging. Further research work is needed before recommending TWW as an alternative source of fresh water irrigation for vegeta- bles. The future research may include the impact of long term application of TWW on human health and envi- ronment in terms of heavy metals and pathogens. 5. Acknowledgements This research was funded by DFG Grant no. GZ:MA 1830/9-2. Special thanks to Prof Dr Bernd Marschner, Bochum University, Germny, for his suggestions during the re- search activity. REFERENCES [1] Palestinian Central Bureau of Statistics, “Palestinian Na- tional Authority, Yearly Report,” 2012. [2] R. S. Evett Jr., S. R. Zalesny, F. N. Kandil, A. J. Stanturf and C. Soriano, “Opportunities for Woody Crop Produc- tion Using Treated Wastewater in Egypt. II. Irrigation Strategies,” International Journal of Phytoremediation, Vol. 13, No. l 1, 2011, pp. 122-139. [3] G. L. Mendoza-Espinosa, A. Cabello-Pasini, V. Macias- Carranza, W. Daessle-Heuser, V. M. Orozco-Borbón and L. A. Quintanilla-Montoya, “The Effect of Reclaimed Wastewater on the Quality and Growth of Grapevines,” Water Science and Technology, Vol. 57, No. 9, 2008, pp. 1445-1450. doi:10.2166/wst.2008.242 [4] G. Oron, L. Gillerman, A. Bick, Y. Manor, N. Buriakov- sky and J. Hagin, “Membrane Technology for Sustainable Treated Wastewater Reuse: Agricultural, Environmental and Hydrological Considerations,” Water Science and Technology, Vol. 57, No. 9, 2008, pp. 1383-1388. doi:10.2166/wst.2008.243 [5] P. K. Mosse, F. A. Patti, J. R. Smernik, W. E. Christen and R. T. Cavagnaro, “Physicochemical and Microbiolo- gical Effects of Long- and Short-Term Winery Waste- water Application to Soils,” Journal of Hazardous Ma- terial, Vol. 201, No. 202, 2012, pp. 219-228. Copyright © 2013 SciRes. AJPS  Effect of Treated Waste Water Irrigation on Plant Growth and Soil Properties in Gaza Strip, Palestine Copyright © 2013 SciRes. AJPS 1743 doi:10.1016/j.jhazmat.2011.11.071 [6] P. R. Singh, P. Singh, H. M. Ibrahim and R. Hashim, “Land Application of Sewage Sludge: Physicochemical and Microbial Response,” Review of Environmental Con- tamination and Toxicology, Vol. 214, 2011, pp. 41-61. doi:10.1007/978-1-4614-0668-6_3 [7] E. Castro, P. M. Mañas and J. De Las Heras, “Effects of Wastewater Irrigation on Soil Properties and Turfgrass Growth,” Water Science and Technology, Vol. 63, No. 8, 2011, pp. 1678-1688. doi:10.2166/wst.2011.335 [8] L. D. Pritchard, N. Penney, J. M. McLaughlin, H. Rigby and K. Schwarz, “Land Application of Sewage Sludge (Biosolids) in Australia: Risks to the Environment and Food Crops,” Water Science and Technology, Vol. 62, No. 1, 2010, pp. 48-57. doi:10.2166/wst.2010.274 [9] N. O. Belyaeva, J. R. Haynes and C. E. Sturm, “Chemical, Physical and Microbial Properties and Microbial Diver- sity in Manufactured Soils Produced from Co-Compost- ing Green Waste and Biosolids,” Waste Management, 2012, in Press. doi:10.1016/j.wasman.2012.05.034 [10] Palestinian Central Bureau of Statistics, “Palestinian Na- tional Authority, Yearly Report,” 2007. [11] FAW, CROP WAT, VERSION 8, Food Agriculture Or- ganization, Rome, 2007. [12] A. D. Eaton, L. S. Clesceri and A. E. Greenberg, “Stan- dard Methods for Wastewater Analysis,” American Pub- lic Health Association, Washington DC, 20005. [13] B. J. Jones and V. W. Case, “Sampling, Handling and Analyzing Plant Tissue Samples,” In: R. L. Westerman, Ed., Soil Testing and Plant Analysis, 3rd Edition, Soil Science Society of America, Madison, 1990, pp. 389-427. [14] D. Boruah and S. Hazarika, “Normal Water Irrigation as an Alternative to Effluent Irrigation in Improving Rice Grain Yield and Properties of a Paper Mill Effluent Af- fected Soil,” Journal of Environmental Science and En- gineering, Vol. 52, No. 3, 2010, pp. 221-228. [15] M. Adrover, E. Farrús, G. Moyà and J. Vadell, “Chemical Properties and Biological Activity in Soils of Mallorca Following Twenty Years of Treated Wastewater Irriga- tion,” Journal of Environmental Management, Vol. 95, 2012, pp. 188-192. doi:10.1016/j.jenvman.2010.08.017 [16] S. G. Metson, L. R. Hale, M. D. Iwaniec, M. E. Cook, R. J. Corman, S. C. Galletti and L. D. Childers, “Phosphorus in Phoenix: A Budget and Spatial Representation of Phos- phorus in an Urban Ecosystem,” Ecological Applications, Vol. 22, No. 2, 2012, pp. 705-721. doi:10.1890/11-0865.1 [17] L. Ferrara, M. Iannace, M. A. Patelli and M. Arienzo, “Geochemical Survey of an Illegal Waste Disposal Site under a Waste Emergency Scenario (Northwest Naples, Italy),” Environmental Monitoring and Assessment, 2012, in Press. [18] A. S. Hashemi, “The Investigation of Irrigation with Wastewater on Trees (Populus deltoids L.),” Toxicology and Industrial Health, 2012, in Press. doi:10.1177/0748233712442738 [19] N. Nikolic and M. Nikolic, “Gradient Analysis Reveals a Copper Paradox on Floodplain Soils under Long-Term Pollution by Mining Waste,” Science of the Total En- vironment, Vol. 15, No. 425, 2012, pp. 146-154. doi:10.1016/j.scitotenv.2012.02.076 [20] E. B. Jones, J. R. Haynes and R. I. Phillips, “Addition of an Organic Amendment and/or Residue Mud to Bauxite Residue Sand in Order to Improve Its Properties as a Growth Medium,” Journal of Environmental Manage- ment, Vol. 95, No. 1, 2012, pp. 29-38. [21] R. S. Mousavi, M. Galavi and H. Eskandari, “Effects of Treated Municipal Wastewater on Fluctuation Trend of Leaf Area Index and Quality of Maize (Zea mays),” Wa- ter Science and Technology, Vol. 67, No. 4, 2013, pp. 797-802. doi:10.2166/wst.2012.624
|