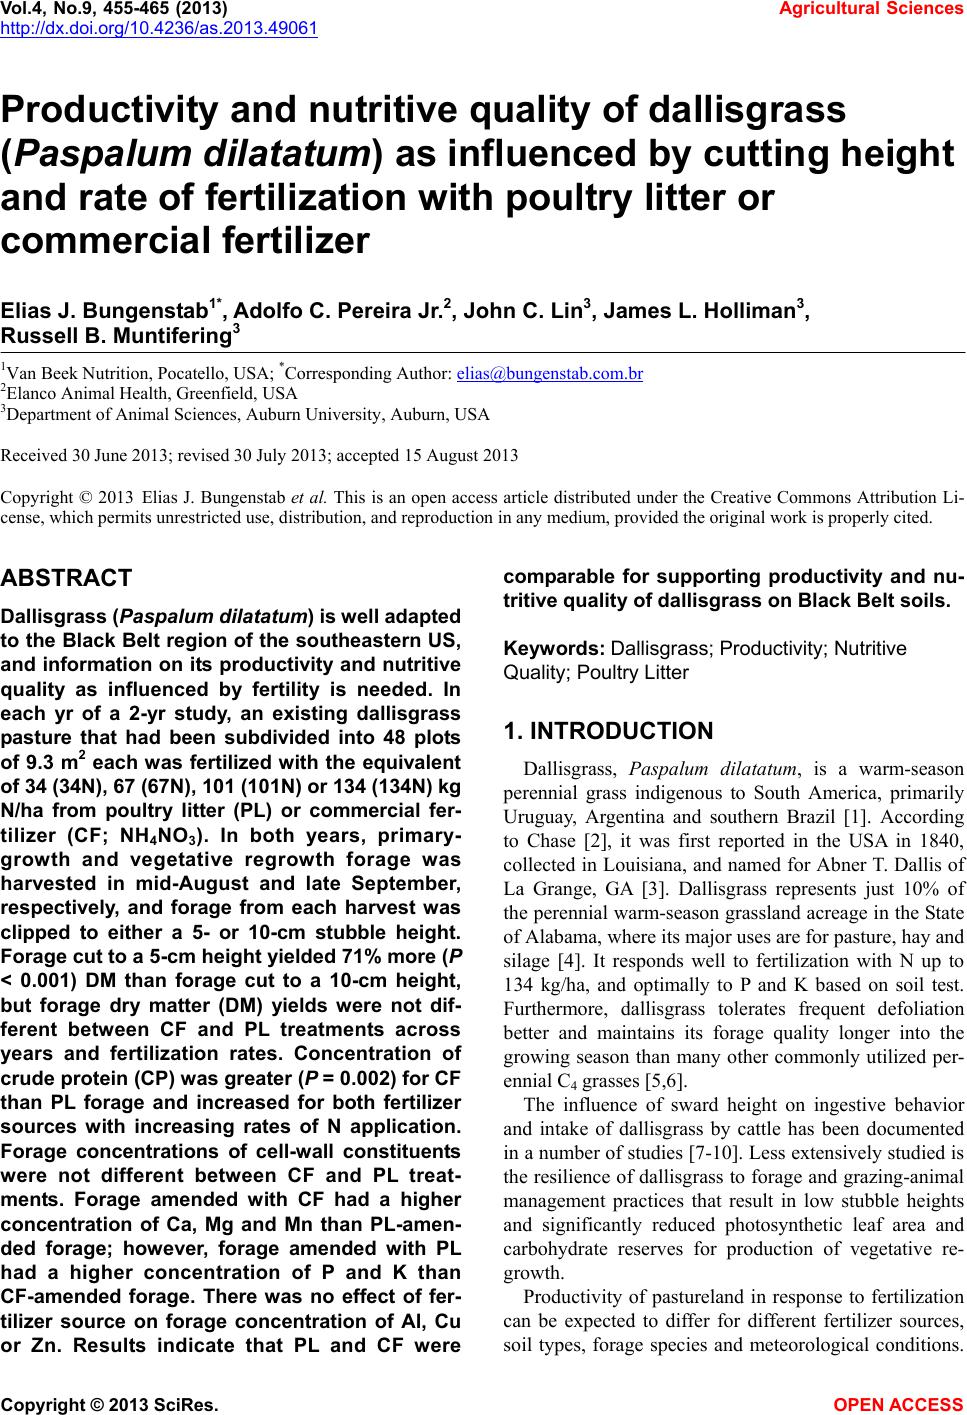
 Vol.4, No.9, 455-465 (2013) Agricultural Sciences http://dx.doi.org/10.4236/as.2013.49061 Productivity and nutritive quality of dallisgrass (Paspalum dilatatum) as influenced by cutting height and rate of fertilization with poultry litter or commercial fertilizer Elias J. Bungenstab1*, Adolfo C. Pereira Jr.2, John C. Lin3, James L. Holliman3, Russell B. Muntifering3 1Van Beek Nutrition, Pocatello, USA; *Corresponding Author: elias@bungenstab.com.br 2Elanco Animal Health, Greenfield, USA 3Department of Animal Sciences, Auburn University, Auburn, USA Received 30 June 2013; revised 30 July 2013; accepted 15 August 2013 Copyright © 2013 Elias J. Bungenstab et al. This is an open access article distributed under the Creative Commons Attribution Li- cense, which permits unrestricted use, distribution, and reproduction in any medium, provided the original work is properly cited. ABSTRACT Dallisgrass (Paspalum dilatatum) is well adapted to the Black Belt region of the southeastern US, and information on its productivity and nutritive quality as influenced by fertility is needed. In each yr of a 2-yr study, an existing dallisgrass pasture that had been subdivided into 48 plots of 9.3 m2 each was fertilized with the equivalent of 34 (34N ), 67 (6 7 N), 10 1 (101 N ) or 13 4 (134N) kg N/ha from poultry litter (PL) or commercial fer- tilizer (CF; NH4NO3). In both years, primary- growth and vegetative regrowth forage was harvested in mid-August and late September, respectively, and forage from each harvest was clipped to either a 5- or 10-cm stubble height. Forage cut to a 5-cm height yielded 71% more (P < 0.001) DM than forage cut to a 10-cm height, but forage dry matter (DM) yields were not dif- ferent between CF and PL treatments across years and fertilization rates. Concentration of crude protein (CP) was greater (P = 0.002) for CF than PL forage and increased for both fertilizer sources with increasing rates of N application. Forage concentrations of cell-wall constituents were not different between CF and PL treat- ments. Forage amended with CF had a higher concentration of Ca, Mg and Mn than PL-amen- ded forage; however, forage amended with PL had a higher concentration of P and K than CF-amended forage. There was no effect of fer- tilizer source on forage concentration of Al, Cu or Zn. Results indicate that PL and CF were comparable for supporting productivity and nu- tritive quality of dallisgrass on Black Belt soils. Keywords: Dallisgrass; Productivity; Nutritive Quality; Poultry Litter 1. INTRODUCTION Dallisgrass, Paspalum dilatatum, is a warm-season perennial grass indigenous to South America, primarily Uruguay, Argentina and southern Brazil [1]. According to Chase [2], it was first reported in the USA in 1840, collected in Louisiana, and named for Abner T. Dallis of La Grange, GA [3]. Dallisgrass represents just 10% of the perennial warm-season grassland acreage in the State of Alabama, where its major uses are for pasture, hay and silage [4]. It responds well to fertilization with N up to 134 kg/ha, and optimally to P and K based on soil test. Furthermore, dallisgrass tolerates frequent defoliation better and maintains its forage quality longer into the growing season than many other commonly utilized per- ennial C4 grasses [5,6]. The influence of sward height on ingestive behavior and intake of dallisgrass by cattle has been documented in a number of studies [7-10]. Less extensively studied is the resilience of dallisgrass to forage and grazing-animal management practices that result in low stubble heights and significantly reduced photosynthetic leaf area and carbohydrate reserves for production of vegetative re- growth. Productivity of pastureland in response to fertilization can be expected to differ for different fertilizer sources, soil types, forage species and meteorological conditions. Copyright © 2013 SciRes. OPEN A CCESS  E. J. Bungenstab et al. / Agricultural Sciences 4 (2013) 455-465 456 In the case of poultry litter, there is currently a very li- mited body of systems-level knowledge that producers can use in management decisions, litter application rate adjustments, and prescription techniques for controlling and maximizing nutrient-use efficiency in forage-based beef cattle production systems. In the Black Belt region of Alabama, depressed agricultural economies stem in part from oftentimes poor soil fertility in pasture, hay- fields and row crops. Economical transportation of poul- try litter could enable export of litter from areas of inten- sive poultry production to the Black Belt region for use as a cost-effective alternative to commercial fertilizer on pasturelands. For these reasons, we conducted a field- plot study to determine the primary productivity and nu- tritive quality of dallisgrass as influenced by rates of fer- tilization with poultry litter or commercial fertilizer. 2. MATERIALS AND METHODS 2.1. Site Characteristics The experimental site was an existing dallisgrass pas- ture located at the Black Belt Research and Extension Center in Marion Junction, AL (32.5˚ lat., 87.2˚ long., 61 m elev.). The pasture had been utilized for grazing prior to 1990, and since 1990 it has been utilized for hay pro- duction. In 2001 to 2004, the pasture was over-seeded in the fall with oats and received 67 kg of N/ha in the spring and early summer of each yr prior to the experi- ment. The soil beneath the pasture is a clayey loam with a mean pH of 7.9. Mean annual temperature at the site is 17.6˚C, and mean annual precipitation is 1400 mm. Pre- cipitation and temperature were recorded daily through- out the experiment. 2.2. Treatments Forage in the pasture was clipped to a height of 10 cm on July 17, 2006, and the study area was subdivided into 48 plots of 9.3 m2 each (1.5 m × 6.1 m). Each plot re- ceived the equivalent of 34 (34N), 67 (67N), 101 (101N) or 134 (134N) kg N/ha from either poultry litter (PL; 2.75% N, air-dry basis) or commercial fertilizer (CF; 35% N as NH4NO3). Commercial fertilizer was applied to half of the plots utilizing a tractor and spreader, and PL was applied manually to the remaining half of the plots. The PL consisted of wood shavings and manure collected from chicken houses in North Alabama. Prior to transport to the research site, PL was ground to pass a 5-mm screen in a hammer mill and stored in a sealed container under refrigeration. In order to facilitate its transportation to the research site and application to field plots, PL was pre-weighed into paper bags in quantities of 1.14, 2.27, 3.41 and 4.54 kg that corresponded to 1222 (34N), 2443 (67N), 3665 (101N), and 4887 (134N) kg poultry litter/ha, respectively. Half of the plots within each fertilizer source × appli- cation-rate treatment (n = 3) were assigned to above- ground clipping heights of either 5 or 10 cm that simu- lated different intensities of grazing management. In or- der to minimize the influence of environmental condi- tions external to the study area, 12 border plots were maintained around the experimental plots. Border plots received 34N from CF and were clipped to the same height as the study plots to which they were contiguous. 2.3. Forage Harvesting, Sampling and Laboratory Analyses Forage was clipped with a flail-chopping mower when it achieved a mean target height of 20 cm on August 21, and then again on September 25. Harvested forage was collected into plastic baskets and immediately weighed on a portable field scale. Samples of forage from each plot were placed into tared paper bags, weighed, dried at 55˚C for 72 hr and ground to pass a 1-mm screen in a Wiley mill. Forage concentrations of crude protein (CP = N × 6.25) and dry matter (DM) were determined accord- ing to procedures of AOAC [11], and concentrations of neutral detergent fiber (NDF), acid detergent fiber (ADF) and acid detergent lignin (ADL) were determined se- quentially according to the procedures of Van Soest et al. [12]. Concentrations of P, K, Ca, Mg, Al, Cu, Fe, Mn and Zn were measured using inductively coupled argon plasma (ICAP) spectroscopy according to the procedures of Olsen and Sommers [13]. The experiment was repeated in 2007, at which time forage in each plot was clipped to a height of 10 cm on April 23, amended with the same fertilization treatments as those applied in 2006, and harvested on August 16 and then again on September 27 at the same clipping heights as those assigned in 2006. 2.4. Statistical Analyses Data were analyzed by analysis of variance for a com- pletely randomized design with a 2 × 2 × 4 factorial ar- rangement of treatments (3 replicates/treatment) in which harvest was treated as a repeated measure using the PROC MIXED procedures of SAS and standard leastsquares model fit [14]. Components of the statistical model in- cluded clipping height, fertilizer source, fertilizer appli- cation rate and their two- and three-way interactions treated as fixed effects, and year treated as a random ef- fect. Plot was considered the experimental unit. All data are reported as least squares means ± SE, and the sig- nificance level was preset at P < 0.10 for all analyses. 3. RESULTS 3.1. Temperature and Precipitation Monthly mean air temperatures (Table 1) approxi- Copyright © 2013 SciRes. OPEN A CCESS  E. J. Bungenstab et al. / Agricultural Sciences 4 (2013) 455-465 457 mated or were slightly higher than 30-yr averages for Marion Junction, AL in July, August and September of 2006 and 2007, but monthly total precipitation was 42%, 69% and 26% of average for July, August and September, respectively, in 2006, and was 55%, 75% and 67% of average, respectively, for the these three months in 2007. 3.2. Dry Matter Yield Forage cut to a 5-cm height yielded 71% more (P < 0.001) DM than forage cut to a 10-cm height (Ta b le 2). There was no difference in DM yield between fertil- izer-source treatments; however, the 134N treatment yielded one-third more DM than the 34N (P = 0.015) and 67N (P = 0.012) treatments. 3.3. Crude Protein There was no difference (P = 0.71) in forage concen- Table 1. Monthly mean air temperatures for 2006 and 2007, and 30-yr averages at Marion Junction, AL. Mean, ˚C Avg. Precipitation, mm Month 2006 2007 30-yr 2006 200730-yr Jan 11 8 7 105 93 149 Feb 8 7 9 136 54 119 Mar 14 16 13 60 39 163 Apr 21 16 17 23 34 123 May 22 23 22 90 3 104 Jun 26 27 26 28 101 113 Jul 29 27 27 54 70 129 Aug 29 30 27 58 64 85 Sep 24 25 24 26 67 100 Oct 18 20 18 85 66 75 Nov 12 12 13 173 39 111 Dec 9 11 8 124 58 128 Table 2. Forage DM yield (kg/ha) from dallisgrass amended with commercial fertilizer (CF) or poultry litter (PL) at 4 rates of N application and clipped to a 5- or 10-cm height. Clipping height 5 cm 10 cm N application rate, kg/ha CF PL CF PL Mean 34 934 785 450 386640a 67 846 804 452 408627a 101 907 898 639 491734ab 134 957 1,031 682 676836b Mean 911 879 556 490 Clipping-height mean 895c 523d a,bWithin a column, means without a common superscript differ (P = 0.04; SEM = 126; n = 48). c,dWithin a row, means without a common superscript differ (P < 0.001; SEM = 119; n = 96). tration of CP between clipping-height treatments (Table 3). However, forage amended with CF had 0.8 percen- tage unit higher (P = 0.002) concentration of CP than PL-amended forage. Forage receiving 134N had 1.2 and 0.8 percentage units higher concentration of CP than the 34N (P = 0.001) and 67N (P = 0.035) treatments, respec- tively, but was not different (P = 0.21) from the 101N treatment. Forage receiving 101N had 0.7 percentage unit higher (P = 0.039) CP concentration than 34N, but was not different (P = 0.37) from the 67N treatment. 3.4. Neutral Detergent Fiber Clipping forage to a 10-cm height resulted in a 0.9 percentage-unit increase (P = 0.02) in NDF concentra- tion compared with clipping to a 5-cm height (Ta ble 4). A clipping height × fertilizer source interaction (P = 0.06) was observed such that forage amended with PL and clipped to a 10-cm height had 1.0 and 1.7 percentage units higher NDF concentration than forage clipped to a 5-cm height and amended with CF (P = 0.06) and PL (P = 0.003), respectively. Table 3. Concentration of CP (%, DM basis) in dallisgrass amended with commercial fertilizer (CF) or poultry litter (PL) at 4 rates of N application and clipped to a 5- or 10-cm height. Fertilizer source CF PL N application rate, kg/ha5 cm10 cm 5 cm 10 cm Mean 34 9.8 9.2 8.7 9.0 9.2a 67 10.39.7 9.2 9.2 09.6ab 101 10.610.1 9.3 9.7 09.9bc 134 10.810.9 9.9 9.9 10.4c Mean 10.410.0 9.3 9.4 Fertilizer-source mean10.2d 9.4e a,b,cWithin a column, means without a common superscript differ (P = 0.009; SEM = 0.3; n = 48). d,eWithin a row, means without a common superscript differ (P = 0.002; SEM = 0.2; n = 96). Table 4. Concentration of NDF (%, DM basis) in dallisgrass amended with commercial fertilizer (CF) or poultry litter (PL) at 4 rates of N application and clipped to a 5- or 10-cm height. Clipping height 5 cm 10 cm N application rate, kg/haCF PL CF PL Mean 34 67.166.3 67.3 68.767.4 67 66.666.4 67.4 66.966.8 101 65.967.0 66.8 67.666.8 134 67.164.5 65.9 67.866.3 Mean 66.7a66.0a 66.8ab 67.7b Clipping-height mean 66.4c 67.3d a,bWithin a row, means without a common superscript differ (P = 0.06; SEM = 1.7; n = 48). c,dWithin a row, means without a common superscript differ (P = 0.02; SEM = 1.7; n = 96). Copyright © 2013 SciRes. OPEN A CCESS  E. J. Bungenstab et al. / Agricultural Sciences 4 (2013) 455-465 458 3.5. Acid Detergent Fiber Forage clipped to a 10-cm height had 0.8 percentage unit higher (P = 0.002) concentration of ADF than forage clipped to a 5-cm height (Table 5). Forage receiving 134N had 1.1 and 0.7 percentage units lower ADF con- centration than the 34N (P = 0.001) and 67N (P = 0.06) treatments, respectively. Forage receiving 101N had 0.6 percentage unit lower (P = 0.09) ADF concentration than the 34N treatment, but was not different from the 67N (P = 0.66) or 134N (P = 0.13) treatments. 3.6. Acid Detergent Lignin Clipping forage to a 5-cm height resulted in a 0.2 per- centage-unit increase (P = 0.08) in ADL concentration compared with clipping to a 10-cm height (Ta ble 6). A clipping height × fertilizer source interaction (P = 0.08) was observed such that forage amended with CF and clipped to a 5-cm height had 0.4, 0.5 and 0.4 percentage units higher ADL concentration than PL-amended forage clipped to a 5-cm height (P = 0.04), CF-amended forage clipped to a 10-cm height (P = 0.02), and PL-amended forage clipped to a 10-cm height (P = 0.04), respectively. Table 5. Concentration of ADF (%, DM basis) in dallisgrass amended with commercial fertilizer (CF) or poultry litter (PL) at 4 rates of N application and clipped to a 5- or 10-cm height. Clipping height 5 cm 10 cm N application rate, kg/ha CF PL CF PL Mean 34 33.8 33.9 34.4 35.034.3a 67 33.8 33.7 34.1 33.8 33.9ab 101 33.0 33.7 34.0 34.1 33.7bc 134 33.2 31.8 33.6 34.133.2c Mean 33.5 33.3 34.0 34.3 Clipping-height mean 33.4d 34.2e a,b,cWithin a column, means without a common superscript differ (P = 0.015; SEM = 0.3; n = 48). d,eWithin a row, means without a common superscript differ (P = 0.002; SEM = 0.2; n = 96). Table 6. Concentration of ADL (%, DM basis) in dallisgrass amended with commercial fertilizer (CF) or poultry litter (PL) at 4 rates of N application and clipped to a 5- or 10-cm height. Clipping height 5 cm 10 cm N application rate, kg/ha CF PL CF PL Mean 34 4.2 3.9 3.7 3.83.9 67 4.2 3.8 3.8 3.73.9 101 4.3 3.7 3.6 3.93.9 134 4.2 3.8 3.9 3.83.9 Mean 4.2a 3.8b 3.7b 3.8b Clipping-height mean 4.0c 3.8d a,bWithin a row, means without a common superscript differ (P = 0.08; SEM = 0.1; n = 48). c,dWithin a row, means without a common superscript differ (P = 0.08; SEM = 0.1; n = 96). 3.7. Calcium Forage clipped to a 10-cm height had 0.05 percentage unit lower (P < 0.001) concentration of Ca than forage clipped to a 5-cm height (Table 7). There was a 0.03 percentage unit higher (P = 0.003) concentration of Ca in forage amended with CF (0.49%) than PL (0.46%), but there were no differences (P = 0.63) in forage concentra- tion of Ca among N application-rate treatments. 3.8. Phosphorus Forage clipped to a 5-cm height had 0.01 percentage unit higher (P = 0.01) concentration of P than forage clipped to a 10-cm height (Table 8). There was a 0.01 percentage unit higher (P < 0.001) concentration of P in forage amended with PL (0.18%) than CF (0.17%), but forage concentrations of P were not different (P = 0.68) among N application-rate treatments. A clipping height × fertilizer source interaction (P = 0.06) was observed such that forage amended with PL and clipped to a 5-cm height had 0.02, 0.03 and 0.02 percentage unit higher concentration of P than CF-amended forage clipped to a 5-cm height (P < 0.001), CF-amended forage clipped to a Table 7. Concentration of Ca (%, DM basis) in dallisgrass amended with commercial fertilizer (CF) or poultry litter (PL) at 4 rates of N application and clipped to a 5- or 10-cm height. Clipping height 5 cm 10 cm N application rate, kg/haCF PL CF PL Mean 34 0.50 0.51 0.46 0.430.48 67 0.52 0.50 0.46 0.440.48 101 0.51 0.48 0.47 0.420.47 134 0.49 0.47 0.48 0.420.46 Mean 0.51 0.49 0.47 0.43 Clipping-height mean 0.50a 0.45b a,bWithin a row, means without a common superscript differ (P < 0.001; SEM = 0.01; n = 96). Table 8. Concentration of P (%, DM basis) in dallisgrass amended with commercial fertilizer (CF) or poultry litter (PL) at 4 rates of N application and clipped to a 5- or 10-cm height. Clipping height 5 cm 10 cm N application rate, kg/haCF PL CF PL Mean 34 0.180.18 0.17 0.170.18 67 0.170.19 0.16 0.170.17 101 0.160.19 0.16 0.170.17 134 0.160.18 0.17 0.180.17 Mean 0.17ab 0.19c 0.16a 0.17b Clipping-height mean 0.18d 0.17e a,b,cWithin a row, means without a common superscript differ (P = 0.06; SEM = 0.01; n = 48). d,eWithin a row, means without a common superscript differ (P = 0.01; SEM = 0.01; n = 96). Copyright © 2013 SciRes. OPEN A CCESS 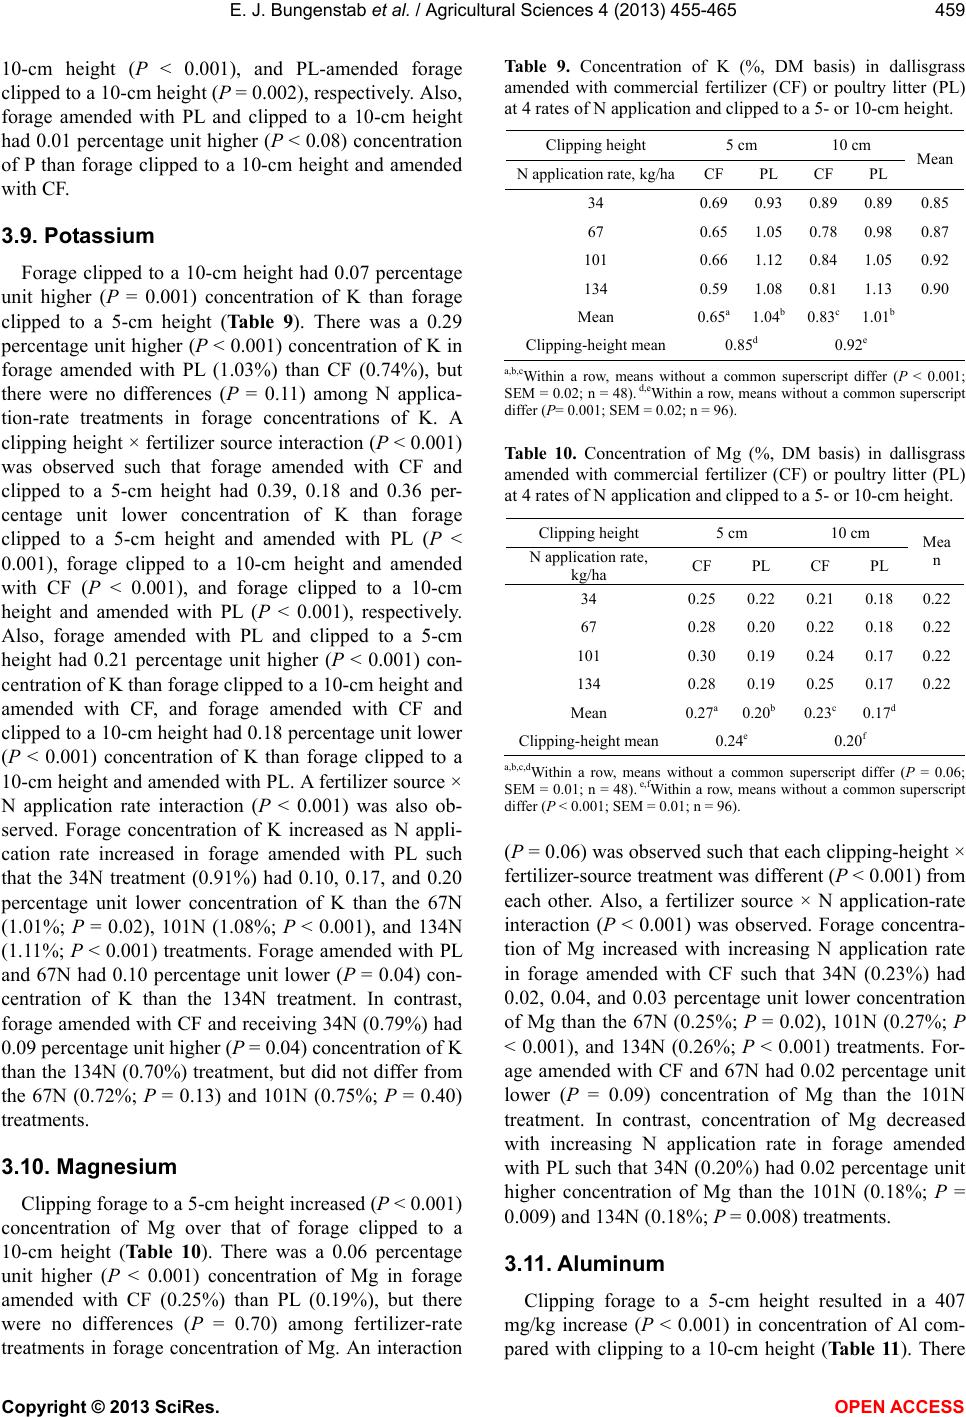 E. J. Bungenstab et al. / Agricultural Sciences 4 (2013) 455-465 459 10-cm height (P < 0.001), and PL-amended forage clipped to a 10-cm height (P = 0.002), respectively. Also, forage amended with PL and clipped to a 10-cm height had 0.01 percentage unit higher (P < 0.08) concentration of P than forage clipped to a 10-cm height and amended with CF. 3.9. Potassium Forage clipped to a 10-cm height had 0.07 percentage unit higher (P = 0.001) concentration of K than forage clipped to a 5-cm height (Table 9). There was a 0.29 percentage unit higher (P < 0.001) concentration of K in forage amended with PL (1.03%) than CF (0.74%), but there were no differences (P = 0.11) among N applica- tion-rate treatments in forage concentrations of K. A clipping height × fertilizer source interaction (P < 0.001) was observed such that forage amended with CF and clipped to a 5-cm height had 0.39, 0.18 and 0.36 per- centage unit lower concentration of K than forage clipped to a 5-cm height and amended with PL (P < 0.001), forage clipped to a 10-cm height and amended with CF (P < 0.001), and forage clipped to a 10-cm height and amended with PL (P < 0.001), respectively. Also, forage amended with PL and clipped to a 5-cm height had 0.21 percentage unit higher (P < 0.001) con- centration of K than forage clipped to a 10-cm height and amended with CF, and forage amended with CF and clipped to a 10-cm height had 0.18 percentage unit lower (P < 0.001) concentration of K than forage clipped to a 10-cm height and amended with PL. A fertilizer source × N application rate interaction (P < 0.001) was also ob- served. Forage concentration of K increased as N appli- cation rate increased in forage amended with PL such that the 34N treatment (0.91%) had 0.10, 0.17, and 0.20 percentage unit lower concentration of K than the 67N (1.01%; P = 0.02), 101N (1.08%; P < 0.001), and 134N (1.11%; P < 0.001) treatments. Forage amended with PL and 67N had 0.10 percentage unit lower (P = 0.04) con- centration of K than the 134N treatment. In contrast, forage amended with CF and receiving 34N (0.79%) had 0.09 percentage unit higher (P = 0.04) concentration of K than the 134N (0.70%) treatment, but did not differ from the 67N (0.72%; P = 0.13) and 101N (0.75%; P = 0.40) treatments. 3.10. Magnesium Clipping forage to a 5-cm height increased (P < 0.001) concentration of Mg over that of forage clipped to a 10-cm height (Table 10). There was a 0.06 percentage unit higher (P < 0.001) concentration of Mg in forage amended with CF (0.25%) than PL (0.19%), but there were no differences (P = 0.70) among fertilizer-rate treatments in forage concentration of Mg. An interaction Table 9. Concentration of K (%, DM basis) in dallisgrass amended with commercial fertilizer (CF) or poultry litter (PL) at 4 rates of N application and clipped to a 5- or 10-cm height. Clipping height 5 cm 10 cm N application rate, kg/haCF PL CF PL Mean 34 0.69 0.93 0.89 0.890.85 67 0.65 1.05 0.78 0.980.87 101 0.66 1.12 0.84 1.050.92 134 0.59 1.08 0.81 1.130.90 Mean 0.65a 1.04b 0.83c 1.01b Clipping-height mean 0.85d 0.92e a,b,cWithin a row, means without a common superscript differ (P < 0.001; SEM = 0.02; n = 48). d,eWithin a row, means without a common superscript differ (P= 0.001; SEM = 0.02; n = 96). Table 10. Concentration of Mg (%, DM basis) in dallisgrass amended with commercial fertilizer (CF) or poultry litter (PL) at 4 rates of N application and clipped to a 5- or 10-cm height. Clipping height 5 cm 10 cm N application rate, kg/ha CF PL CF PL Mea n 34 0.250.22 0.21 0.18 0.22 67 0.280.20 0.22 0.18 0.22 101 0.300.19 0.24 0.17 0.22 134 0.280.19 0.25 0.17 0.22 Mean 0.27a0.20b 0.23c 0.17d Clipping-height mean0.24e 0.20f a,b,c,dWithin a row, means without a common superscript differ (P = 0.06; SEM = 0.01; n = 48). e,fWithin a row, means without a common superscript differ (P < 0.001; SEM = 0.01; n = 96). (P = 0.06) was observed such that each clipping-height × fertilizer-source treatment was different (P < 0.001) from each other. Also, a fertilizer source × N application-rate interaction (P < 0.001) was observed. Forage concentra- tion of Mg increased with increasing N application rate in forage amended with CF such that 34N (0.23%) had 0.02, 0.04, and 0.03 percentage unit lower concentration of Mg than the 67N (0.25%; P = 0.02), 101N (0.27%; P < 0.001), and 134N (0.26%; P < 0.001) treatments. For- age amended with CF and 67N had 0.02 percentage unit lower (P = 0.09) concentration of Mg than the 101N treatment. In contrast, concentration of Mg decreased with increasing N application rate in forage amended with PL such that 34N (0.20%) had 0.02 percentage unit higher concentration of Mg than the 101N (0.18%; P = 0.009) and 134N (0.18%; P = 0.008) treatments. 3.1 1. Alu minum Clipping forage to a 5-cm height resulted in a 407 mg/kg increase (P < 0.001) in concentration of Al com- pared with clipping to a 10-cm height (Ta b le 1 1 ). There Copyright © 2013 SciRes. OPEN A CCESS 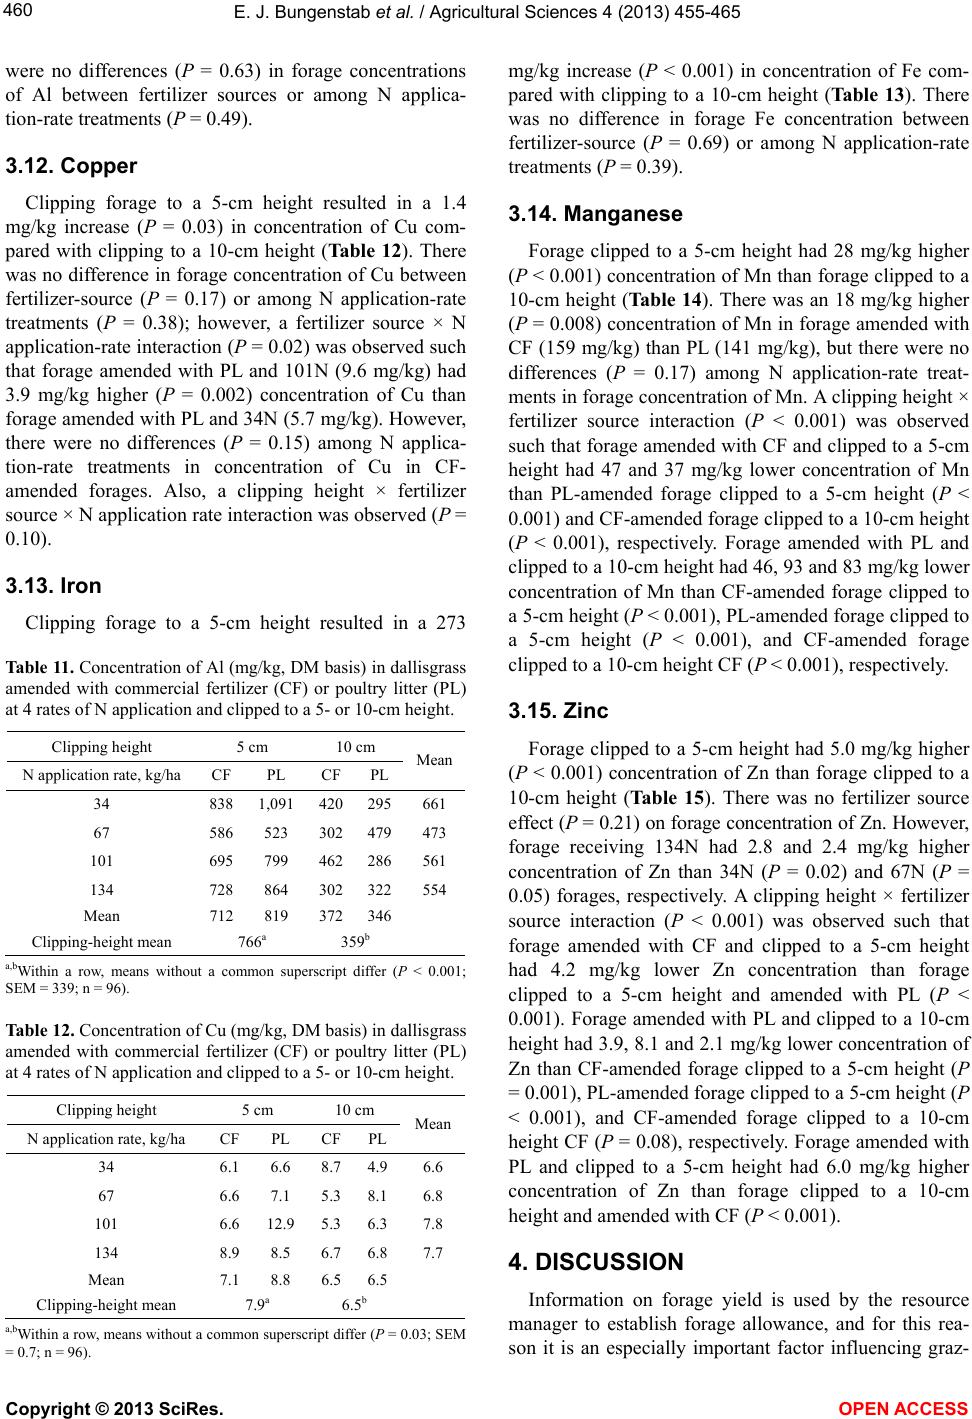 E. J. Bungenstab et al. / Agricultural Sciences 4 (2013) 455-465 460 were no differences (P = 0.63) in forage concentrations of Al between fertilizer sources or among N applica- tion-rate treatments (P = 0.49). 3.12. Copper Clipping forage to a 5-cm height resulted in a 1.4 mg/kg increase (P = 0.03) in concentration of Cu com- pared with clipping to a 10-cm height (Ta ble 12). There was no difference in forage concentration of Cu between fertilizer-source (P = 0.17) or among N application-rate treatments (P = 0.38); however, a fertilizer source × N application-rate interaction (P = 0.02) was observed such that forage amended with PL and 101N (9.6 mg/kg) had 3.9 mg/kg higher (P = 0.002) concentration of Cu than forage amended with PL and 34N (5.7 mg/kg). However, there were no differences (P = 0.15) among N applica- tion-rate treatments in concentration of Cu in CF- amended forages. Also, a clipping height × fertilizer source × N application rate interaction was observed (P = 0.10). 3.13. Iron Clipping forage to a 5-cm height resulted in a 273 Table 11. Concentration of Al (mg/kg, DM basis) in dallisgrass amended with commercial fertilizer (CF) or poultry litter (PL) at 4 rates of N application and clipped to a 5- or 10-cm height. Clipping height 5 cm 10 cm N application rate, kg/ha CF PL CF PL Mean 34 838 1,091 420 295661 67 586 523 302 479 473 101 695 799 462 286 561 134 728 864 302 322 554 Mean 712 819 372 346 Clipping-height mean 766a 359b a,bWithin a row, means without a common superscript differ (P < 0.001; SEM = 339; n = 96). Table 12. Concentration of Cu (mg/kg, DM basis) in dallisgrass amended with commercial fertilizer (CF) or poultry litter (PL) at 4 rates of N application and clipped to a 5- or 10-cm height. Clipping height 5 cm 10 cm N application rate, kg/ha CF PL CF PL Mean 34 6.1 6.6 8.7 4.96.6 67 6.6 7.1 5.3 8.16.8 101 6.6 12.9 5.3 6.37.8 134 8.9 8.5 6.7 6.87.7 Mean 7.1 8.8 6.5 6.5 Clipping-height mean 7.9a 6.5b a,bWithin a row, means without a common superscript differ (P = 0.03; SEM = 0.7; n = 96). mg/kg increase (P < 0.001) in concentration of Fe com- pared with clipping to a 10-cm height (Ta ble 13). There was no difference in forage Fe concentration between fertilizer-source (P = 0.69) or among N application-rate treatments (P = 0.39). 3.14. Manganese Forage clipped to a 5-cm height had 28 mg/kg higher (P < 0.001) concentration of Mn than forage clipped to a 10-cm height (Tab le 14). There was an 18 mg/kg higher (P = 0.008) concentration of Mn in forage amended with CF (159 mg/kg) than PL (141 mg/kg), but there were no differences (P = 0.17) among N application-rate treat- ments in forage concentration of Mn. A clipping height × fertilizer source interaction (P < 0.001) was observed such that forage amended with CF and clipped to a 5-cm height had 47 and 37 mg/kg lower concentration of Mn than PL-amended forage clipped to a 5-cm height (P < 0.001) and CF-amended forage clipped to a 10-cm height (P < 0.001), respectively. Forage amended with PL and clipped to a 10-cm height had 46, 93 and 83 mg/kg lower concentration of Mn than CF-amended forage clipped to a 5-cm height (P < 0.001), PL-amended forage clipped to a 5-cm height (P < 0.001), and CF-amended forage clipped to a 10-cm height CF (P < 0.001), respectively. 3.15. Zinc Forage clipped to a 5-cm height had 5.0 mg/kg higher (P < 0.001) concentration of Zn than forage clipped to a 10-cm height (Ta ble 15). There was no fertilizer source effect (P = 0.21) on forage concentration of Zn. However, forage receiving 134N had 2.8 and 2.4 mg/kg higher concentration of Zn than 34N (P = 0.02) and 67N (P = 0.05) forages, respectively. A clipping height × fertilizer source interaction (P < 0.001) was observed such that forage amended with CF and clipped to a 5-cm height had 4.2 mg/kg lower Zn concentration than forage clipped to a 5-cm height and amended with PL (P < 0.001). Forage amended with PL and clipped to a 10-cm height had 3.9, 8.1 and 2.1 mg/kg lower concentration of Zn than CF-amended forage clipped to a 5-cm height (P = 0.001), PL-amended forage clipped to a 5-cm height (P < 0.001), and CF-amended forage clipped to a 10-cm height CF (P = 0.08), respectively. Forage amended with PL and clipped to a 5-cm height had 6.0 mg/kg higher concentration of Zn than forage clipped to a 10-cm height and amended with CF (P < 0.001). 4. DISCUSSION Information on forage yield is used by the resource manager to establish forage allowance, and for this rea- son it is an especially important factor influencing graz- Copyright © 2013 SciRes. OPEN A CCESS  E. J. Bungenstab et al. / Agricultural Sciences 4 (2013) 455-465 461 Table 13. Concentration of Fe (mg/kg, DM basis) in dallisgrass amended with commercial fertilizer (CF) or poultry litter (PL) at 4 rates of N application and clipped to a 5- or 10-cm height. Clipping height 5 cm 10 cm N application rate, kg/ha CF PL CF PL Mean 34 522 770 290 198445 67 362 363 198 294304 101 488 539 346 173387 134 495 568 220 197370 Mean 467 560 264 216 Clipping-height mean 513a 240b a,bWithin a row, means without a common superscript differ (P < 0.001; SEM = 215; n = 96). ing-animal performance [15]. Also, yield is directly re- lated to sward density, structure and height, all of which have been shown to be key determinants of grazing be- havior and voluntary forage intake by cattle [7,9,10]. Because of the truncated experimental period utilized in each year of the present study, cumulative production of dallisgrass was somewhat less than more typical seasonal production reported by other investigators [1,16-18]. Also, dallisgrass is best adapted to regions that receive more than 900 mm of annual rainfall [19], and lack of rainfall may partially explain why forage in the present study did not develop to its full production potential, especially in 2007. The influence of sward height on ingestive behavior and intake of dallisgrass by cattle has been documented in a number of studies [7-10]. In general, these authors have reported that cattle modify their bite mass, defolia- tion area and depth of grazing in the forage canopy in response to changes in sward height, forage density, and relative proportions of leaf and stem tissue. Less exten- sively studied is the resilience of dallisgrass to forage and grazing-animal management practices that result in low stubble heights and significantly reduced photosyn- thetic leaf area and carbohydrate reserves for production of vegetative regrowth. Clipping dallisgrass to a 5-cm height resulted in an increase of more than 70% in DM yield over clipping to a 10-cm height, which is consid- erably greater than the 11.5% increase in DM yield re- ported by Holt and McDaniel [17] for dallisgrass clipped to a 5-cm compared with a 15-cm height. Dallisgrass clipped to a 5-cm height yielded 1239 and 552 kg DM/ha for first and second harvests, respectively, across both years of the study; however, dallisgrass clipped to a 10-cm height yielded only 592 and 455 kg DM/ha for first and second harvests, respectively. Because regrowth DM yield compared favorably between the cutting- height treatments, cutting primary growth to the lower stubble height evidently did not compromise its regrowth potential compared with that of primary growth clipped Table 14. Concentration of Mn (mg/kg, DM basis) in dallis- grass amended with commercial fertilizer (CF) or poultry litter (PL) at 4 rates of N application and clipped to a 5- or 10-cm height. Clipping height 5 cm 10 cm N application rate, kg/haCF PL CF PL Mean 34 168 193 200 87 162 67 138 197 166 100150 101 137 205 169 84 149 134 121 156 178 109141 Mean 141a 188b 178b 95c Clipping-height mean 164d 136e a,b,cWithin a row, means without a common superscript differ (P < 0.001; SEM = 33; n = 48). d,eWithin a row, means without a common superscript differ (P < 0.001; SEM = 32; n = 96). to the higher stubble height. Watson and Ward [20] re- ported higher daily and total seasonal regrowth yields with reductions in clipping height, and suggested that dallisgrass could tolerate clipping to stubble heights as low as 2.5 cm as long as at least 10% of tillers were left intact. Yield of dallisgrass DM increased as a result of in- creasing N application from 34N and 67N to 134N. Similarly, Robinson et al. [18] reported an increase in dallisgrass DM yield from 5330 kg to 15,340 kg/ha when N fertilization rate was increased from 0 to 896 kg/ha. Likewise, Pizarro [1] reported increases in DM produc- tion from dallisgrass ranging from 2400 to 9000 kg/ha over a 5-yr period with increasing N fertilization from 0 to 500 kg/ha in increments of 100 kg/ha. Jones and Wat- son [21] reported increases in yield of dallisgrass-ber- mudagrass pasture with increasing rates of fertilization with N, but no yield response to fertilization with either P or K alone in the absence of added N. Brown and Rouse [22] also reported increases in yield of dallisgrass DM with increasing rates of N fertilization in a greenhouse study with white clover-dallisgrass cultures. Forage protein is an important source of N for ruminal microorganisms, and an important goal of forage man- agement is to derive as much of the N requirement as possible from forage in order to limit or eliminate the need for supplementation. The range of forage concen- trations of CP observed in the present study was similar to that observed by Venuto et al. [19], who reported con- centrations of CP in dallisgrass of 9.8% to 11%, and lower than that observed by Baréa et al. [23], who re- ported a wider range of concentrations of CP in dallis- grass of 10.7% to 18.6%. Using prediction equations of Linn and Marten [24], dallisgrass in the present study would be expected to have approximately 87% the rela- tive feed value (RFV) of a mature, medium-quality alfalfa Copyright © 2013 SciRes. OPEN A CCESS 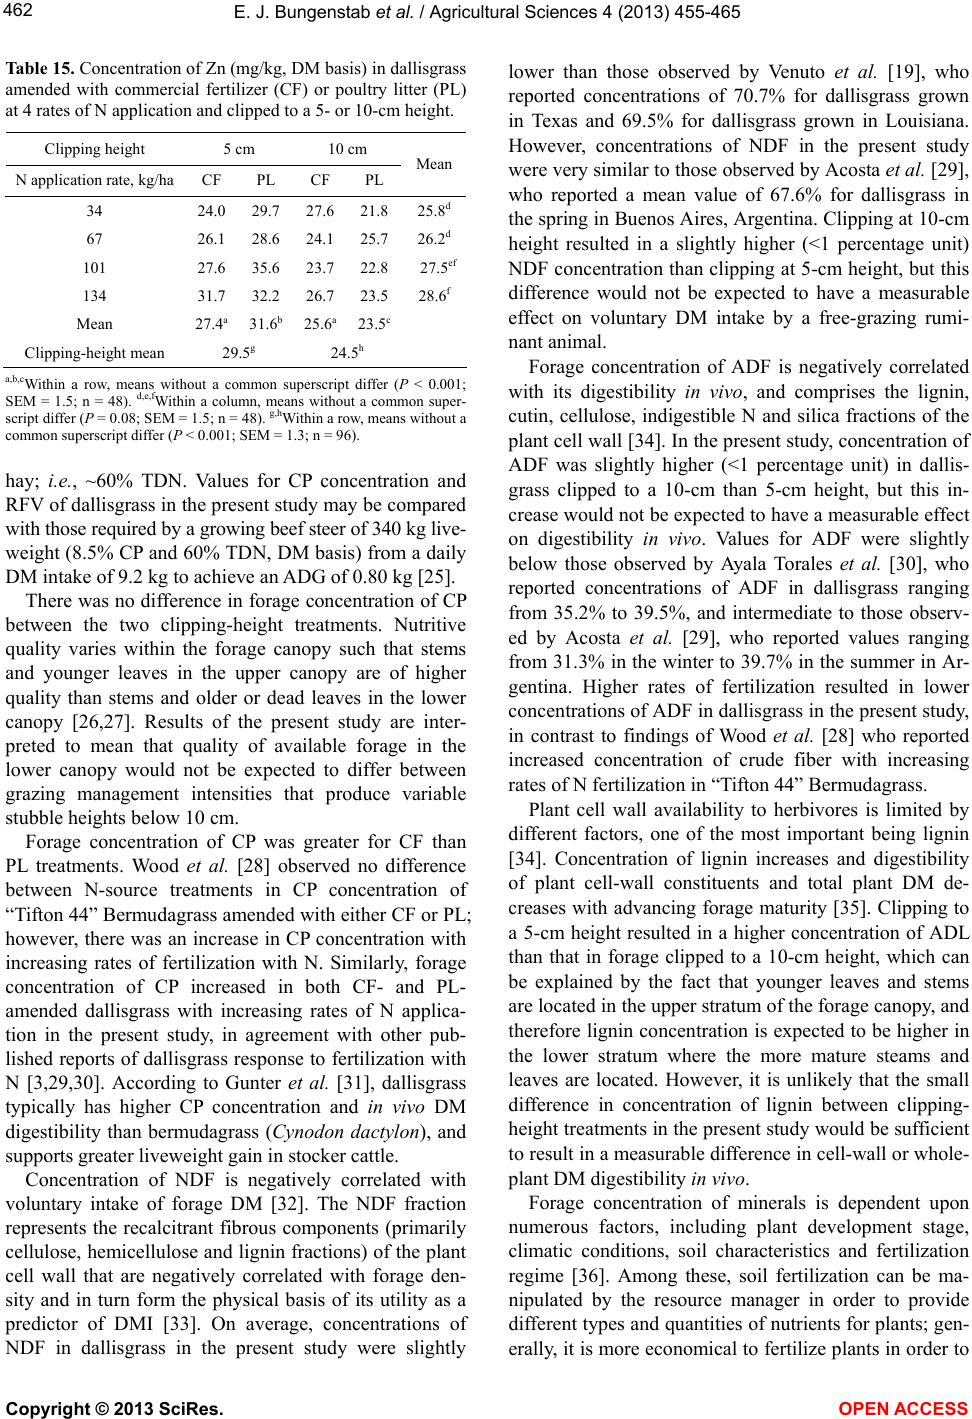 E. J. Bungenstab et al. / Agricultural Sciences 4 (2013) 455-465 462 Table 15. Concentration of Zn (mg/kg, DM basis) in dallisgrass amended with commercial fertilizer (CF) or poultry litter (PL) at 4 rates of N application and clipped to a 5- or 10-cm height. Clipping height 5 cm 10 cm N application rate, kg/ha CF PL CF PL Mean 34 24.0 29.7 27.6 21.825.8d 67 26.1 28.6 24.1 25.726.2d 101 27.6 35.6 23.7 22.8 27.5ef 134 31.7 32.2 26.7 23.528.6f Mean 27.4a 31.6b 25.6a 23.5c Clipping-height mean 29.5g 24.5h a,b,cWithin a row, means without a common superscript differ (P < 0.001; SEM = 1.5; n = 48). d,e,fWithin a column, means without a common super- script differ (P = 0.08; SEM = 1.5; n = 48). g,hWithin a row, means without a common superscript differ (P < 0.001; SEM = 1.3; n = 96). hay; i.e., ~60% TDN. Values for CP concentration and RFV of dallisgrass in the present study may be compared with those required by a growing beef steer of 340 kg live- weight (8.5% CP and 60% TDN, DM basis) from a daily DM intake of 9.2 kg to achieve an ADG of 0.80 kg [25]. There was no difference in forage concentration of CP between the two clipping-height treatments. Nutritive quality varies within the forage canopy such that stems and younger leaves in the upper canopy are of higher quality than stems and older or dead leaves in the lower canopy [26,27]. Results of the present study are inter- preted to mean that quality of available forage in the lower canopy would not be expected to differ between grazing management intensities that produce variable stubble heights below 10 cm. Forage concentration of CP was greater for CF than PL treatments. Wood et al. [28] observed no difference between N-source treatments in CP concentration of “Tifton 44” Bermudagrass amended with either CF or PL; however, there was an increase in CP concentration with increasing rates of fertilization with N. Similarly, forage concentration of CP increased in both CF- and PL- amended dallisgrass with increasing rates of N applica- tion in the present study, in agreement with other pub- lished reports of dallisgrass response to fertilization with N [3,29,30]. According to Gunter et al. [31], dallisgrass typically has higher CP concentration and in vivo DM digestibility than bermudagrass (Cynodon dactylon), and supports greater liveweight gain in stocker cattle. Concentration of NDF is negatively correlated with voluntary intake of forage DM [32]. The NDF fraction represents the recalcitrant fibrous components (primarily cellulose, hemicellulose and lignin fractions) of the plant cell wall that are negatively correlated with forage den- sity and in turn form the physical basis of its utility as a predictor of DMI [33]. On average, concentrations of NDF in dallisgrass in the present study were slightly lower than those observed by Venuto et al. [19], who reported concentrations of 70.7% for dallisgrass grown in Texas and 69.5% for dallisgrass grown in Louisiana. However, concentrations of NDF in the present study were very similar to those observed by Acosta et al. [29], who reported a mean value of 67.6% for dallisgrass in the spring in Buenos Aires, Argentina. Clipping at 10-cm height resulted in a slightly higher (<1 percentage unit) NDF concentration than clipping at 5-cm height, but this difference would not be expected to have a measurable effect on voluntary DM intake by a free-grazing rumi- nant animal. Forage concentration of ADF is negatively correlated with its digestibility in vivo, and comprises the lignin, cutin, cellulose, indigestible N and silica fractions of the plant cell wall [34]. In the present study, concentration of ADF was slightly higher (<1 percentage unit) in dallis- grass clipped to a 10-cm than 5-cm height, but this in- crease would not be expected to have a measurable effect on digestibility in vivo. Values for ADF were slightly below those observed by Ayala Torales et al. [30], who reported concentrations of ADF in dallisgrass ranging from 35.2% to 39.5%, and intermediate to those observ- ed by Acosta et al. [29], who reported values ranging from 31.3% in the winter to 39.7% in the summer in Ar- gentina. Higher rates of fertilization resulted in lower concentrations of ADF in dallisgrass in the present study, in contrast to findings of Wood et al. [28] who reported increased concentration of crude fiber with increasing rates of N fertilization in “Tifton 44” Bermudagrass. Plant cell wall availability to herbivores is limited by different factors, one of the most important being lignin [34]. Concentration of lignin increases and digestibility of plant cell-wall constituents and total plant DM de- creases with advancing forage maturity [35]. Clipping to a 5-cm height resulted in a higher concentration of ADL than that in forage clipped to a 10-cm height, which can be explained by the fact that younger leaves and stems are located in the upper stratum of the forage canopy, and therefore lignin concentration is expected to be higher in the lower stratum where the more mature steams and leaves are located. However, it is unlikely that the small difference in concentration of lignin between clipping- height treatments in the present study would be sufficient to result in a measurable difference in cell-wall or whole- plant DM digestibility in vivo. Forage concentration of minerals is dependent upon numerous factors, including plant development stage, climatic conditions, soil characteristics and fertilization regime [36]. Among these, soil fertilization can be ma- nipulated by the resource manager in order to provide different types and quantities of nutrients for plants; gen- erally, it is more economical to fertilize plants in order to Copyright © 2013 SciRes. OPEN A CCESS  E. J. Bungenstab et al. / Agricultural Sciences 4 (2013) 455-465 463 achieve maximum growth, and then supplement as nec- essary to meet requirements for animal production [36]. Forage concentrations of Ca in the present study were, on average, less than half of those reported by Brown and Rouse [22] for dallisgrass cultivated in a greenhouse in association with white clover. Concentrations of Ca were higher in dallisgrass amended with CF than PL in the present study, in contrast to the study by Wood et al. [28] in which Ca concentration in “Tifton 44” Bermuda- grass amended with PL was higher than in unfertilized forage or forage amended with ammonium nitrate. Re- sults of the present study are similar to those of Robinson et al. [18], who reported Ca concentration values for dal- lisgrass of 0.39% to 0.48%. Phosphorus is arguably the single mineral element that is most commonly deficient for meeting animal require- ments from grazed forages. Because of its importance in various metabolic processes in animals, notably energy metabolism, dietary P deficiency can very likely result in a deficiency of energy [36]. In the present study, concen- tration of P was higher in dallisgrass amended with PL than CF, in contrast to the study by Wood et al. [28] in which there was no difference in concentrations of P between “Tifton 44” Bermudagrass amended with CF or PL. Also, concentration of P was higher in dallisgrass clipped to a 5-cm than 10-cm height. In general, values were lower than the range of values (0.27% to 0.29%) re- ported by Robinson et al. [18]. Concentration of K was higher in forage amended with PL than CF, similar to results reported by Wood et al. [28] for “Tifton 44” Bermudagrass; however, there was an increase in K accumulation with increasing rate of N fertilization with PL and a decrease in K concentra- tion with increasing rate of N fertilization with CF in their study, in contrast to the present study in which rate of N application had no effect on K concentration in dal- lisgrass. Forages normally contain sufficient K for meet- ing grazing animals’ requirements; however, high (>2.5%) forage concentration of K may interfere with bioavailability of Mg [36]. Concentration of K in dallis- grass averaged 0.89% in the present study, well below the threshold at which it can potentially be problematic for Mg absorption, and less than half of that in the study by Robinson et al. [18], who reported concentrations of K in dallisgrass of 2.04% to 2.24%. Potassium concen- trations in this study, on average, were similar to those reported by Brown and Rouse [22] for dallisgrass grown in a greenhouse in association with white clover. Con- centration of Mg was higher in dallisgrass amended with CF than PL, and increased with increasing rate of N ap- plication from CF, in agreement with Robinson et al. [18] who reported an increase from 0.19% to 0.36% Mg when N application rate was increased from 0 to 896 kg/ha. Utilization of PL as a fertilizer source has an advan- tage over synthetic fertilizers of providing trace minerals that are important for plant and animal nutrition. How- ever, it is important to recognize the potential for toxicity to livestock that may result from repeated land-applica- tion of PL and possible accumulation of certain trace minerals in soil and grazed forage. Franzluebbers et al. [37] reported 4.1 and 7.8 mg/kg greater concentrations of extractable-soil Zn and Cu, respectively, in the upper 15-cm horizon of a Piedmont soil at the end of a 5-yr period of land-application of PL at a rate of 196 kg N·ha−1·yr−1. Gascho and Hubbard [38] reported a four- and five-fold increase in concentrations of Cu and Zn, respectively, in the surface of a Tifton soil in the Coastal Plain of Georgia following land-application of PL at a rate of 2812 kg N/ha over a 5-yr period. Iron concentration in forages grown in the US typi- cally meets or exceeds animal dietary requirements [36]. Concentration of Fe in dallisgrass in the present study was well above the dietary requirement (50 mg/kg DM) for beef cattle [25], and was higher in forage clipped to a 5- than 10-cm height. Some trace elements are not re- quired or may be required in small amounts, and if in- gested and absorbed in excessive amounts can be toxic to cattle. Aluminum is one such trace mineral for which the maximum tolerable concentration (MTC) for beef cattle is 1000 mg/kg DM [25]. Dallisgrass clipped to a 5-cm height had a higher concentration of Al than forage clipped to a 10-cm height and, with the exception of for- age amended with PL at the 34N application rate had concentrations of Al that were below the MTC for beef cattle. Suboptimal Cu status in ruminants may be caused by low forage concentration of Cu, high concentration of a Cu antagonist such as Fe, or a combination of both [36]. Concentration of Cu in the present study was higher for dallisgrass clipped to a 5- than 10-cm height, and on av- erage was below the concentration required (10 mg/kg DM) by beef cattle [25]. Concentration of Mn, which is normally higher in forage than required by the animal [36], was higher in dallisgrass amended with CF than PL in the present study. Zinc and Cu are often deficient in warm-season grasses, and normally are the most limiting trace minerals in both warm-season and cool-season for- ages [36]. Deficiencies of trace minerals in grazed forage require supplementation in order to meet animal re- quirements for maximum performance and optimal health. Zinc is one such trace mineral for which defi- ciency in forages is not uncommon in the US [36]. Con- centration of Zn in dallisgrass was below that required (30 mg/kg DM) by beef cattle [25], and was not different between clipping-height and fertilizer-source treatments or among N application-rate treatments in the present study. Copyright © 2013 SciRes. OPEN A CCESS  E. J. Bungenstab et al. / Agricultural Sciences 4 (2013) 455-465 464 5. IMPLICATIONS Results indicate that dallisgrass can withstand defolia- tion to a 5-cm stubble height, thereby increasing DM yield compared with defoliation to a 10-cm stubble height, without compromising forage quality or capacity for regrowth. Also, dallisgrass amended with PL or CF was comparable in productivity and nutritive quality as determined by laboratory analysis. Dallisgrass amended with PL had higher concentrations of P and K than CF-amended dallisgrass, but trace-mineral profiles were not markedly different between dallisgrass amended with PL or CF. Results are interpreted to mean that poultry litter may offer potential as a safe, cost-effective alterna- tive to commercial fertilizer for supporting productivity and nutritive quality of dallisgrass on Black Belt soils. REFERENCES [1] Pizarro, E.A. (2000) Potencial forrajero del género Pas- palum. Pasturas Tropicales, 22, 38-46. [2] Chase, A. (1929) The North American species of Pas- palum. Contributions from the United States National Herbarium, 28, 310. [3] Holt, E.C. (1956) Dallisgrass. Texas Agricultural Ex- perimental Station Bulletin, 829, 1-14. [4] AASS (1996) Alabama agricultural statistics service. Montgomery. [5] Davies, L.J. and Forde, B.J. (1991) Comparative re- sponses of three subtropical grasses to combined frost and prolonged chilling treatments simulating a New Zea- land winter. New Zealand Journal of Agricultural Re- search, 34, 249-256. doi:10.1080/00288233.1991.10417661 [6] Evers, G.W. and Burson, B.L. (2004) Dallisgrass and other Paspalum species. In: Moser, L.E. et al., Eds., Warm-Season (C4) Grasses, (pp 681-713), Madison, Agronomy Monographs, 45. [7] Lippke, H. (1981) Intake, digestibility, and sward charac- teristics of bermudagrass-dallisgrass pastures. Texas Ag- ricultural Experiment Station Progress Report, 3826, 173-174. [8] Ungar, E.D., Genizi, A. and Detriment, M.W. (1991) Bite dimensions and herbage intake by cattle grazing short hand-constructed swards. Ag ronomy Journal, 83, 973-978. doi:10.2134/agronj1991.00021962008300060010x [9] Laca, E.L., Ungar, E.D., Seligman, N. and Demment, M.W. (1992) Effect of sward height and bulk density on bite dimensions of cattle grazing homogeneous swards. Grass and Forage Science, 47, 91-102. doi:10.1111/j.1365-2494.1992.tb02251.x [10] Flores, E.R., Laca, E.A., Griggs, T.C. and Demment, M.W. (1993) Sward height and vertical morphological differentiation determine cattle bite dimensions. Agron- omy Journal, 85, 527-532. doi:10.2134/agronj1993.00021962008500030001x [11] AOAC (1995) Official methods of analysis. 16th Edition, Association of Official Analytical Chemists, Washington DC. [12] Van Soest, P.J., Robertson, J.B. and Lewis, B.A. (1991) Methods for dietary fiber, neutral detergent fiber, and nonstarch polysaccharides in relation to animal nutrition. Journal of Dairy Science, 74, 3583-3597. doi:10.3168/jds.S0022-0302(91)78551-2 [13] Olsen, S.R. and Sommers, L.E. (1982) Phosphorus. In: Page, A.L., Miller, R.H. and Keeney, D.R., Eds., Methods of Soil Analysis. Part 2: Chemical and Microbiological Properties, American Society of Agronomy, Inc., Madi- son, 403-427. [14] SAS Institute (2004) SAS/STAT user’s guide. Version 9.1. SAS Institute Inc., Cary. [15] Minson, D.J. and Wilson, J.R. (1994) Prediction of intake as an element of forage quality. In: Fahey Jr., G.C., et al., Eds., Forage Quality, Evaluation, and Utilization, Ameri- can Society of Agronomy, Inc., Madison, 533-563. [16] Lovvorn, R.L. (1944) The effects of fertilization, species competition, and cutting treatments on the behavior of dallisgrass, Paspalum dilatatum Poir., and carpetgrass, Axonopus affinis, Chase. Agronomy Journal, 36, 590-600. doi:10.2134/agronj1944.00021962003600070007x [17] Holt, E.C. and McDaniel, J.C. (1963) Influence of clip- ping on yield, regrowth, and root development of dallis- grass, Paspalum dilatatum Poir., and kleingrass, Panicum coloratum L. Agronomy Journal, 55, 561-564. doi:10.2134/agronj1963.00021962005500060018x [18] Robinson, D.L., Wheat, K.G., Hubbert, N.L., Henderson, M.S. and Savoy Jr., H.J. (1988) Dallisgrass yield, quality and nitrogen recovery response to nitrogen and phospho- rus fertilizers. Communications in Soil Science and Plant Analysis, 19, 529-542. doi:10.1080/00103628809367957 [19] Venuto, B.C., Burson, B.L., Hussey, M.A., Redfearn, D.D., Wyatt, W.E. and Brown, L.P. (2003) Forage yield, nutritive value, and grazing tolerance of dallisgrass bio- types. Crop Science, 43, 295-301. doi:10.2135/cropsci2003.0295 [20] Watson, V.W. and Ward, C.Y. (1970) Influence of intact tillers and height of cut on regrowth and carbohydrate re- serves of dallisgrass (Paspalum dilatatum Poir.). Crop Science, 10, 474-476. doi:10.2135/cropsci1970.0011183X001000050004x [21] Jones, W.F. and Watson, V.H. (1991) Applied phosphorus and potassium effects on yield of dallisgrass-Bermuda- grass pastures. Journal of Plant Nutri t io n, 14, 585-597. doi:10.1080/01904169109364226 [22] Brown, J.M. and Rouse, R.D. (1953) Fertilizer effects on botanical and chemical composition of white clover-dal- lisgrass associations grown on Sumter clay. Agronomy Journal, 45, 279-282. doi:10.2134/agronj1953.00021962004500070002x [23] Baréa, K., Scheffer-Basso, S.M., Dall’Agnol, M. and de Oliveira, B.N. (2007) Management of Paspalum dila- tatum Poir. biotype Virasoro. 1. Production, chemical composition and persistence. Revista Brasileira de Zo- otecnia, 36, 992-999. doi:10.1590/S1516-35982007000500002 Copyright © 2013 SciRes. OPEN A CCESS  E. J. Bungenstab et al. / Agricultural Sciences 4 (2013) 455-465 Copyright © 2013 SciRes. OPEN A CCESS 465 [24] Linn, J.G. and Martin, N.P. (1989) Forage quality tests and interpretation. University of Minnesota Extension Service Publication, St. Paul. [25] NRC (1996) Nutrient requirements of beef cattle. 7th Edition, National Academy Press, Washington DC. [26] Brisibe, E.A., Umoren, U.E., Brisibe, F., Magalhäes, P.M., Ferreira, J.F.S., Luthria, D., Wuh, X. and Prior, R.L. (2009) Nutritional characterization and antioxidant ca- pacity of different tissues of Artemisia annua L. Food Chemistry, 115, 1240-1246. doi:10.1016/j.foodchem.2009.01.033 [27] Nordheim-Viken, H., Volden, H. and Jørgensen, M. (2009) Effects of maturity stage, temperature and photoperiod on growth and nutritive value of timothy (Phleum pratense L.). Animal Feed Science and Technology, 152, 204-218. doi:10.1016/j.anifeedsci.2009.04.012 [28] Wood, C.W., Torbert, H.A. and Delaney, D.P. (1993) Poultry litter as a fertilizer for bermudagrass: Effects on yield and quality. Journal of Sustainable Agriculture, 3, 21-36. doi:10.1300/J064v03n02_05 [29] Acosta, G., Deregibusand, V.A. and Hammar, R. (1996) Inclusión de pasto miel (Paspalum dilatatum, Poir) en pasturas. 2. Efecto sobre el valor nutritivo. Revista Argen- tina de Producción Animal, 16, 157-167. [30] Ayala Torales, A.T., Acosta, G.L., Deregibus, V.A. and Moauro, P.M. (2000)Effects of grazing frequency on the production, nutritive value, herbage utilization, and struc- ture of a Paspalum dilatatum sward. New Zealand Jour- nal of Agricultural Research, 43, 467-472. doi:10.1080/00288233.2000.9513443 [31] Gunter, S.A., Beck, P.A., Hutchison, S. and Phillips, J.M. (2005) Effects of stocking and nitrogen fertilization rates on steers grazing dallisgrass-dominated pasture. Journal of Animal Science, 83, 2235-2242. [32] Paterson, J.A., Belyea, R.L., Bowman, J.P., Kerley, M.S. and Williams, J.E. (1994) The impact of forage quality and supplementation regimen on ruminant animal intake and performance. In: Fahey Jr., G.C., et al., Eds., Forage Quality, Evaluation, and Utilization, American Society of Agronomy, Inc., Madison, 59-114. [33] Mertens, D.R. (1987) Predicting intake and digestibility using mathematical models of ruminal function. Journal of Animal Science, 64, 1548-1558. [34] Van Soest, P.J. (1994) Nutritional ecology of the ruminant. 2nd Edition, Cornell University Press, Ithaca. [35] Jung, H.G. and Fahey Jr., G.C. (1983) Nutritional implica- tions of phenolic monomers and lignin: A review. Journal of Animal Science, 57, 206-219. [36] Greene, L.W. (2000) Designing mineral supplementation of forage programs for beef cattle. Journal of Animal Science, 77, 1-9. [37] Franzluebbers, A.J., Wilkinson, S.R. and Stuedemann, J.A. (2004) Bermudagrass management in the southern piedmont USA: VIII. Soil pH and nutrient cations. Agro- nomy Journal, 96, 1390-1399. doi:10.2134/agronj2004.1390 [38] Gascho, G.J. and Hubbard, R.K. (2006) Long-term impact of broiler litter on chemical properties of a Coastal Plain soil. Journal of Soil and Water Conservation, 61, 65-74.
|