Paper Menu >>
Journal Menu >>
 Low Carbon Economy, 2010, 1, 86-91 doi:10.4236/lce.2010.12011 Published Online December 2010 (http://www.SciRP.org/journal/lce) Copyright © 2010 SciRes. LCE Environmental Sustainability Assessment of Electricity from Fossil Fuel Combustion: Carbon Footprint Jorge Cristóbal, Jonathan Albo, Angel Irabien Universidad de Cantabria, Ingeniería Química y Química Inorgánica, Santander, Spain. Email: irabienj@unican.es Received August 4th, 2010; revised September 10th, 2010; accepted October 8th, 2010. ABSTRACT Emissions of greenhouse gases from electricity production should be reduced since climate change has became a big concern in developed countries. Carbon footprint is used as environmental index measuring the emissions that have effect on global warming and shows that secondary footprint has an important relevance in the final emission factor. To achieve sustainability in electricity production is required the consideration and evaluation of all relevant environ- mental impacts at the same time. Reduction in CO 2 emissions is justified since clean combustion is achieved and global warming is the main contributor to global impacts. Keywords: Carbon Footprint, Environmental Sustainability Assessment, Fossil Fuels, Combustion, Environmental Burden 1. Introduction Climate change is a global problem that affects the whole planet as one. Emissions from different countries con- tribute the same to this environmental aspect defined as the effect of anthropogenic emissions which enhance the radioactive forcing of the atmosphere, causing the tem- perature at the earth’s surface to rise [1]. Several gases have influence in this impact, being carbon dioxide the main contributor and the reference to measure the effect of the rest gases. Developed countries are especially concerned about reducing greenhouse gas (GHG) emis- sions as it was established in the Kyoto protocol and fur- ther European policies for energy [2]. Energy demand and transport needs are the origin of the main amount of GHG. Reductions in these two ac- tivities are called to be the way to achieve the levels agreed internationally. 62% of the world electricity comes from hard coal (HC) and natural gas (NG) com- bustion and in the case of Spain 55% [3 ] so in this study both electricity generation technologies carbon footprint (CFP) are compared. Just environmental aspects would be taken into acco unt but the framework that justifies the comparison is much wider since the use of one raw ma- terial or another has social and economic implications. Last year trends in the Spanish electric mix show a growth in the use of natural gas and a decrease in the use of coal. This fact has clear social consequences due to the decrease in the employment of regional mining sector, very important in the north of Spain. Impacts of unem- ployment could be measured on society as a whole or on the individual persons as proposed by Jorgensen et al. [4]. Social life cycle assessment is still in his earlier phases and the trade-offs with the env ironmental dimensions are not clear enough. Furthermore European policies have the objective of supply security and in the case of Spain coal is an important so urce since it is the only raw mate- rial present in the country, being dependent from abroad for all other combustibles. Environmental sustainability concerns the environ- mental impact of inputs (resource usage) and outputs (emissions, effluents and waste) of the process under study and is evaluated by indexes to facilitate and sup- port decision making and policies. They can be used to compare different technologies because they reduce the complexity in the analysis taking into account an impor- tant number of chemical substances. CFP is a subset of the environmental sustainability indexes that measure all GHG produced (global warming potential impact cate- gory) and has units of tonnes (or kg) of carbon dioxide equivalent. It has been largely discussed the use of this index to decision making processes because it restricts the information and can lead to misleading interpretation of data. Is global warming (GW) the main global impact? 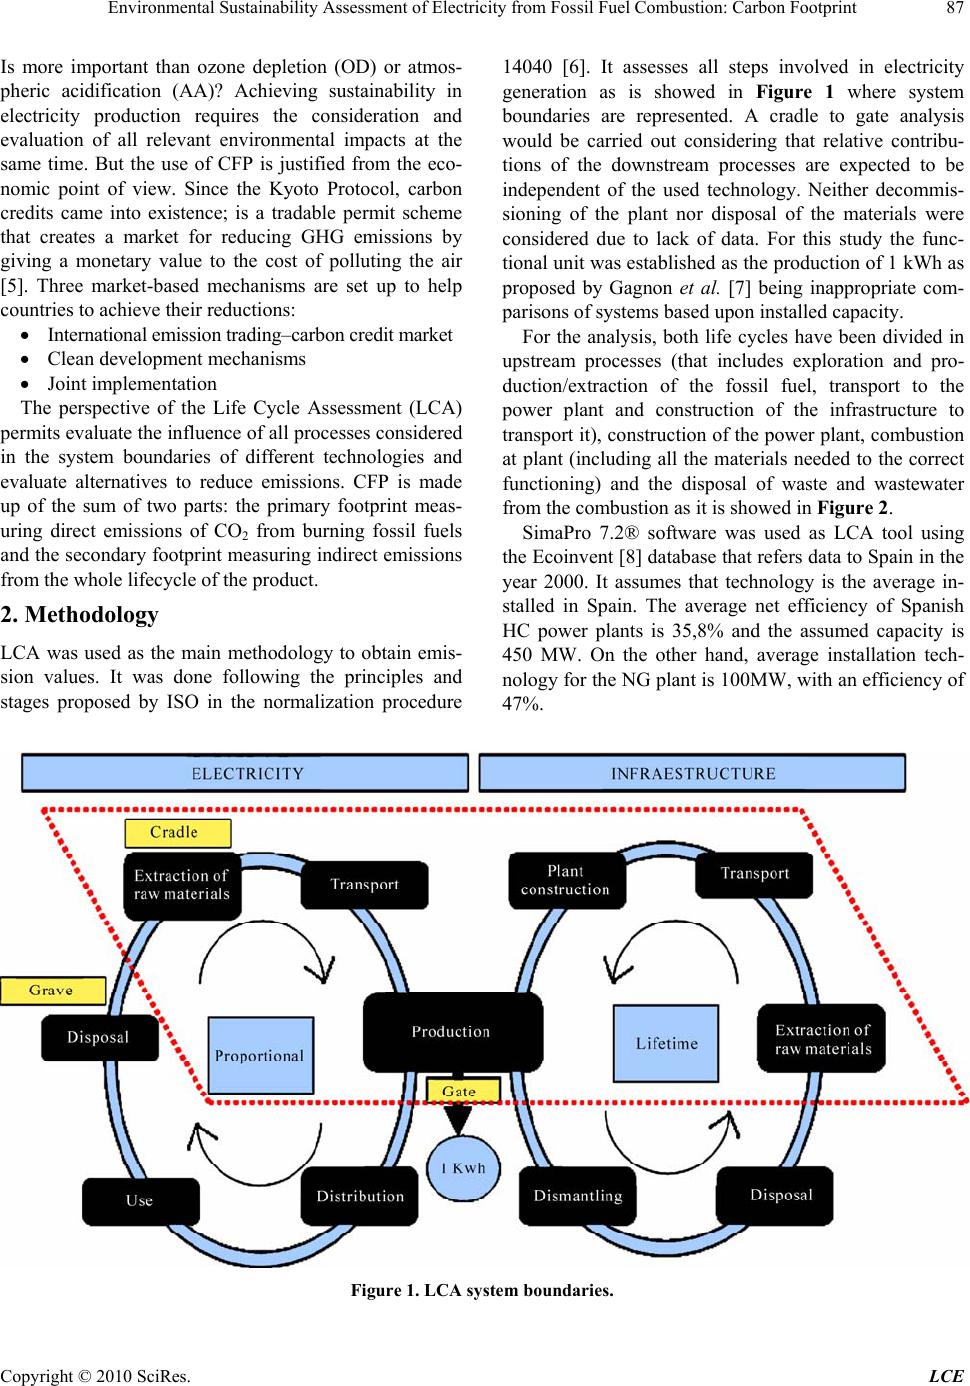 Environmental Sustainability Assessment of Electricity from Fossil Fuel Combustion: Carbon Footprint Copyright © 2010 SciRes. LCE 87 Is more important than ozone depletion (OD) or atmos- pheric acidification (AA)? Achieving sustainability in electricity production requires the consideration and evaluation of all relevant environmental impacts at the same time. But the use of CFP is justified from the eco- nomic point of view. Since the Kyoto Protocol, carbon credits came into existence; is a tradable permit scheme that creates a market for reducing GHG emissions by giving a monetary value to the cost of polluting the air [5]. Three market-based mechanisms are set up to help countries to achieve their reductions: International em issi on tradi ng–carbon credit ma rket Clean development mechanisms Joint implementation The perspective of the Life Cycle Assessment (LCA) permits evaluate the influence of all processes considered in the system boundaries of different technologies and evaluate alternatives to reduce emissions. CFP is made up of the sum of two parts: the primary footprint meas- uring direct emissions of CO2 from burning fossil fuels and the secondary footprint measuring indirect emissions from the whole lifecycle of the product. 2. Methodology LCA was used as the main methodology to obtain emis- sion values. It was done following the principles and stages proposed by ISO in the normalization procedure 14040 [6]. It assesses all steps involved in electricity generation as is showed in Figure 1 where system boundaries are represented. A cradle to gate analysis would be carried out considering that relative contribu- tions of the downstream processes are expected to be independent of the used technology. Neither decommis- sioning of the plant nor disposal of the materials were considered due to lack of data. For this study the func- tional unit was established as the production of 1 kWh as proposed by Gagnon et al. [7] being inappropriate com- parisons of systems based upon installed capacity . For the analysis, both life cycles have been divided in upstream processes (that includes exploration and pro- duction/extraction of the fossil fuel, transport to the power plant and construction of the infrastructure to transport it), constru ction of the power plant, combustion at plant (including all the materials needed to the correct functioning) and the disposal of waste and wastewater from the combustion as it is showed in Figure 2. SimaPro 7.2® software was used as LCA tool using the Ecoinven t [8] databa se that refers data to Sp ain in the year 2000. It assumes that technology is the average in- stalled in Spain. The average net efficiency of Spanish HC power plants is 35,8% and the assumed capacity is 450 MW. On the other hand, average installation tech- nology for the NG plant is 100MW, with an efficiency of 47%. Figure 1. LCA system boundar i es.  Environmental Sustainability Assessment of Electricity from Fossil Fuel Combustion: Carbon Footprint Copyright © 2010 SciRes. LCE 88 Figure 2. Carbon footprint. CFP is a sub-set of data covered by a more complete LCA, analysing just emissions that have an effect on global warming and climate change. At least 13 different methodologies for calculating the carbon footprint were operative or under development in 2009 [9]. In this study sustainability metrics proposed by IChemE are used. The potency factors showed in Table 1 are based on a 100- year integrated time horizons that transform the sub- stance to carbon dioxide equivalents. CFP can be divided in two parts. On the one hand the primary footprint that is a measure of direct emissions of CO2 from burning fossil fuels. These punctual emissions are more easily quantifiable because come from the stack of the plant and options to reduce them are focused on capturing substances before released to the atmosphere. On the other hand secondary footprint measures the in- direct CO2 emissions form the whole life cycle of the product being more difficult to control and quantify. Re- ducing options for diffuse emissions are focused on avoiding them controlling transport distances and extrac- tion practices. 3. Results As it was expected the primary footprint is the main con- tributor to the total emission. As Figure 2 shows the amount of carbon dioxide equivalents by HC combustion is two times the emitted in NG by kilowatt-hour pro- duced following th e results expressed in Gagnon et al. [7] and Evans et al. [10]. Secondary footprint has an impor- tant relevance in the final emission counting up to 16% and 12% in NG and HC respectively. Plant construction and waste/wastewater treatments are negligible. Using NG results a better option when CFP is assessed. But as it was said before, Spain is a country totally de- pendent of gas importation from Africa and Europe in contrast with hard coal where 33% is extracted from na- tional reserves [11]. When using national hard coal, the carbon footprint due to transport becomes negligible be- cause usually are installed mine mouth plants. The influ- ence of transport in GHG emissions is important and reduction in the secondary footprint could be achieved reducing or avoiding the long distance transport of raw materials. As it is showed in Figure 3 the use of NG im- ported from distances higher than 8200 kilometres would equal the emissions derived from the combustion of na- tional HC. To reduce the primary footprint several techniques are being under research, focused on the Carbon Capture and Storage (CCS) and the three most promising technologies to capture CO2 from combustion process are post-com- bustion capture, pre-combustion capture and oxy-fuel combustion, being post-combustion based on chemical absorption using monoethanolamine (MEA) as capture solvent the most referred [12]. 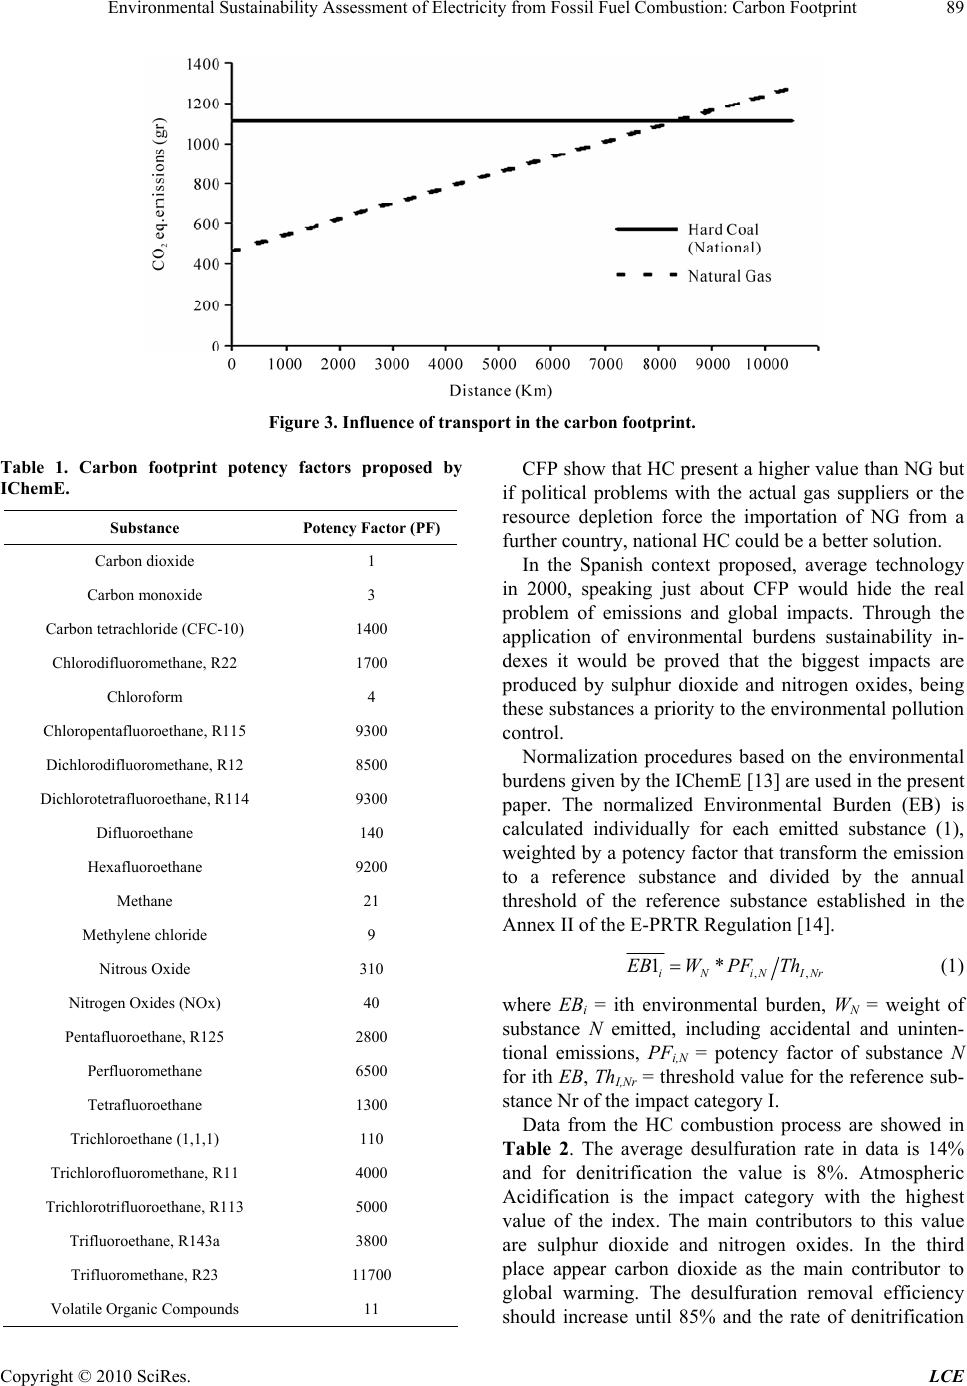 Environmental Sustainability Assessment of Electricity from Fossil Fuel Combustion: Carbon Footprint Copyright © 2010 SciRes. LCE 89 Figure 3. Influence of transport in the carbon footprint. Table 1. Carbon footprint potency factors proposed by IChemE. Substance Potency Factor (PF) Carbon dioxide 1 Carbon monoxide 3 Carbon tetrachloride (CFC-10) 1400 Chlorodifluoromethane, R22 1700 Chloroform 4 Chloropentafluoroethane, R115 9300 Dichlorodifluoromethane, R12 8500 Dichlorotetrafluoroethane, R114 9300 Difluoroethane 140 Hexafluoroethane 9200 Methane 21 Methylene chloride 9 Nitrous Oxide 310 Nitrogen Oxides (NOx) 40 Pentafluoroethane, R125 2800 Perfluoromethane 6500 Tetrafluoroethane 1300 Trichloroethane (1,1,1) 110 Trichlorofluoromethane, R11 4000 Trichlorotrifluoroethane, R113 5000 Trifluoroethane, R143a 3800 Trifluoromethane, R23 11700 Volatile Organic Compounds 11 CFP show that HC present a higher value than NG but if political problems with the actual gas suppliers or the resource depletion force the importation of NG from a further country, national HC could be a better solution. In the Spanish context proposed, average technology in 2000, speaking just about CFP would hide the real problem of emissions and global impacts. Through the application of environmental burdens sustainability in- dexes it would be proved that the biggest impacts are produced by sulphur dioxide and nitrogen oxides, being these substances a priority to the env ironmental pollution control. Normalization procedures based on the environmental burdens given by the IChemE [13] are used in the present paper. The normalized Environmental Burden (EB) is calculated individually for each emitted substance (1), weighted by a potency factor that transform the emission to a reference substance and divided by the annual threshold of the reference substance established in the Annex II of the E-PRTR Regulation [14]. ,, 1* iN iNINr EBW PF Th (1) where EBi = ith environmental burden, WN = weight of substance N emitted, including accidental and uninten- tional emissions, PFi,N = potency factor of substance N for ith EB, ThI,Nr = threshold value for the reference sub- stance Nr of the impact category I. Data from the HC combustion process are showed in Table 2. The average desulfuration rate in data is 14% and for denitrification the value is 8%. Atmospheric Acidification is the impact category with the highest value of the index. The main contributors to this value are sulphur dioxide and nitrogen oxides. In the third place appear carbon dioxide as the main contributor to global warming. The desulfuration removal efficiency should increase until 85% and the rate of denitrification  Environmental Sustainability Assessment of Electricity from Fossil Fuel Combustion: Carbon Footprint Copyright © 2010 SciRes. LCE 90 Table 2. Environmental impact assessment for global impacts. Substance Reference substance Emission Ton/TWhPF Th (Ton/year) EB Sulfur dioxide 7.31E + 03 1 48,74 Nitrogen oxides 3.62E + 03 0,7 16,89 Hydrogen chloride 131 0.88 0.77 Hydrogen fluoride 42.30 1.6 0.45 Ammonia Sulfur dioxide 0.94 1.88 1.18E – 02 AA TOTAL SO2 eq. 1E + 04 1 150 66.86 Carbon dioxide 9.61E + 05 1 9.61 Nitrogen oxides 3.62E + 03 40 1,45 Dinitrogen monoxide 8.90 310 2.76E – 02 Carbon monoxide 81.3 3 2.44E – 03 Methane Carbon dioxide 10.9 21 2.29E – 03 GW TOTAL CO2 eq. 1.11E + 06 1 100000 11.09 Methane, 4Cl, CFC-10 2.29E – 04 1,1 0,26 Methane, Br3F, Halon 1301 2.97E – 06 10 2.97E – 02 Methane, BrCl2F, Halon 1211 CFC 11 3.76E – 06 3 1.13E – 02 OD TOTAL CFC 11 eq. 2.93E – 04 1 0.001 0.29 until 50%, reducing EB under 9.61 to consider Global Warming as the mayor impact. Just then CO2 would be the next step in the reduction policy. 4. Conclusions Reduction in GHG is a priority for Europ ean countries as their strategies for energy show and quantitative indexes are needed to support decision making. CFP measures the emission of gases that a have an effect on global warming and is useful to compare different technologies. Results show that NG emits half of the GHG than HC to produce the same amount of energy when comparing the both life cycles. The importance of the upstream processes is showed in the analysis being transport a sig nificant contributor to the CFP of energy production. In the scenario of the study where all the HC burned in Spain would be na- tional, being transport influence negligible, emissions of GHG from NG tran sported 8200 Km would be compara- ble to HC. If actual importing countries couldn’t provide Spain with NG and other much further country should do it, national coal would provide same energy with same GHG emission. Then the social and economic implica- tions would be an important advantage for the national raw material. As this study is focused on the environmental dimen- sion, an assessment of all global atmospheric impacts, using HC combustion data, show that atmospheric acidi- fication has a higher impact index value due to the emis- sion factor of SO2 and NOx being those substances a pri- ority in a reduction policy. Carbon capture is justified since clean combustion (denitrification and desulfuration) is achieved and CO2 is the main contributor to global impacts. CFP was co mpared for both technolog ies and then ex- panded on global atmospheric impacts for the HC case but environmental sustainability can be assess through many different indexes. The difficult issue is the election of the correct index for the scope and boundaries of the study. 5. Acknowledgements This research was funded by the Spanish Ministry of Science and Technology (Project C-CTM2006-00317 ). REFERENCES [1] A. Korre, Z. Nie and S. Durucan, “Life Cycle Modeling of Fossil Fuel Power Generation with Post-combustion  Environmental Sustainability Assessment of Electricity from Fossil Fuel Combustion: Carbon Footprint Copyright © 2010 SciRes. LCE 91 CO2 Capture,” International Journal of Greenhouse Gas Control, 2010, pp. 289-300. [2] CEC–Commission of the European Communities, Green Paper: A European Strategy for Sustainable, Competitive and Secure Energy, Brussels, 2006. [3] IEA–International Energy Agency, Key World Energy Statistics, 2009. [4] A. Jorgensen, M. Finkbeiner, M. S. Jorgensen and M. Z. Hauschild, “Defining the Baseline in Social Life Cycle Assessment,” International Journal of Life Cycle Assess, 2010, pp. 376-384. [5] T. H. Oh and S. C. Chua, “Energy Efficiency and Carbon Trading Potential in Malasya,” Renewable and Sustain- able Energy Reviews , 2010, pp. 2095-2103. [6] ISO, “ISO 14040-Environmental Management–Life Cy- cle Assessment–Principle and Framework,” International Standards Organization, Switzerland, Geneva, 2006. [7] L. Gagnon, C. Bélanger and Y. Uchiyama, “Life-cycle Assessment of Electricity Generation Options: The Status of Research in Year 2001,” Energy Policy, 2002, pp. 1267 - 1278. [8] Ecoinvent Data v2.1, Swiss Centre for Life Cycle Inven- tories, 2009. [9] K. Plassman, A. Norton, N. Attarzadeh, M. P. Jensen, P. Brenton and G. Edwards-Jones, “Methodological Com- plexities of Product Carbon Footprinting: A Sensitivity Analysis of Key Variables in a Developing Country Con- text,” Environmental science and policy. doi:10.1016/j. envsci. 2010.03.013. [10] A. Evans, V. Strezov and T. J. Evans, “Assessment of Sustainability Indicators for Renewable Energy Tech- nologies,” Renewable and Sustainable Energy Reviews, 2009, pp. 1082-1088. [11] CNE-Resolución MINECO 15/07/02 y 15/12/08. Datos Enero-Julio 2009 (in Spanish). [12] B. Praetorius and K. Schumacher, “Greenhouse Gas Miti- gation in a Carbon Constrained World: The Role of Car- bon Capture and Storage,” Energy Policy, doi:10.1016/ j.enpol.2009.07.018. [13] IChemE-Institution of Chemical Engineers, “The Sus- tainability Metrics, Institution of Chemical Engineers Sustainable Development Progress Metrics Recom- mended for Use in the Process Industries,” 2002. [14] E-PRTR Regulation: Regulation (EC) Nº 166/2006 of the European Parliament and of the Council Concerning the Establishment of a European Pollutant Release and Transfer Register and Amending Council Directives 91/689/EEC and 96/61/EC. |