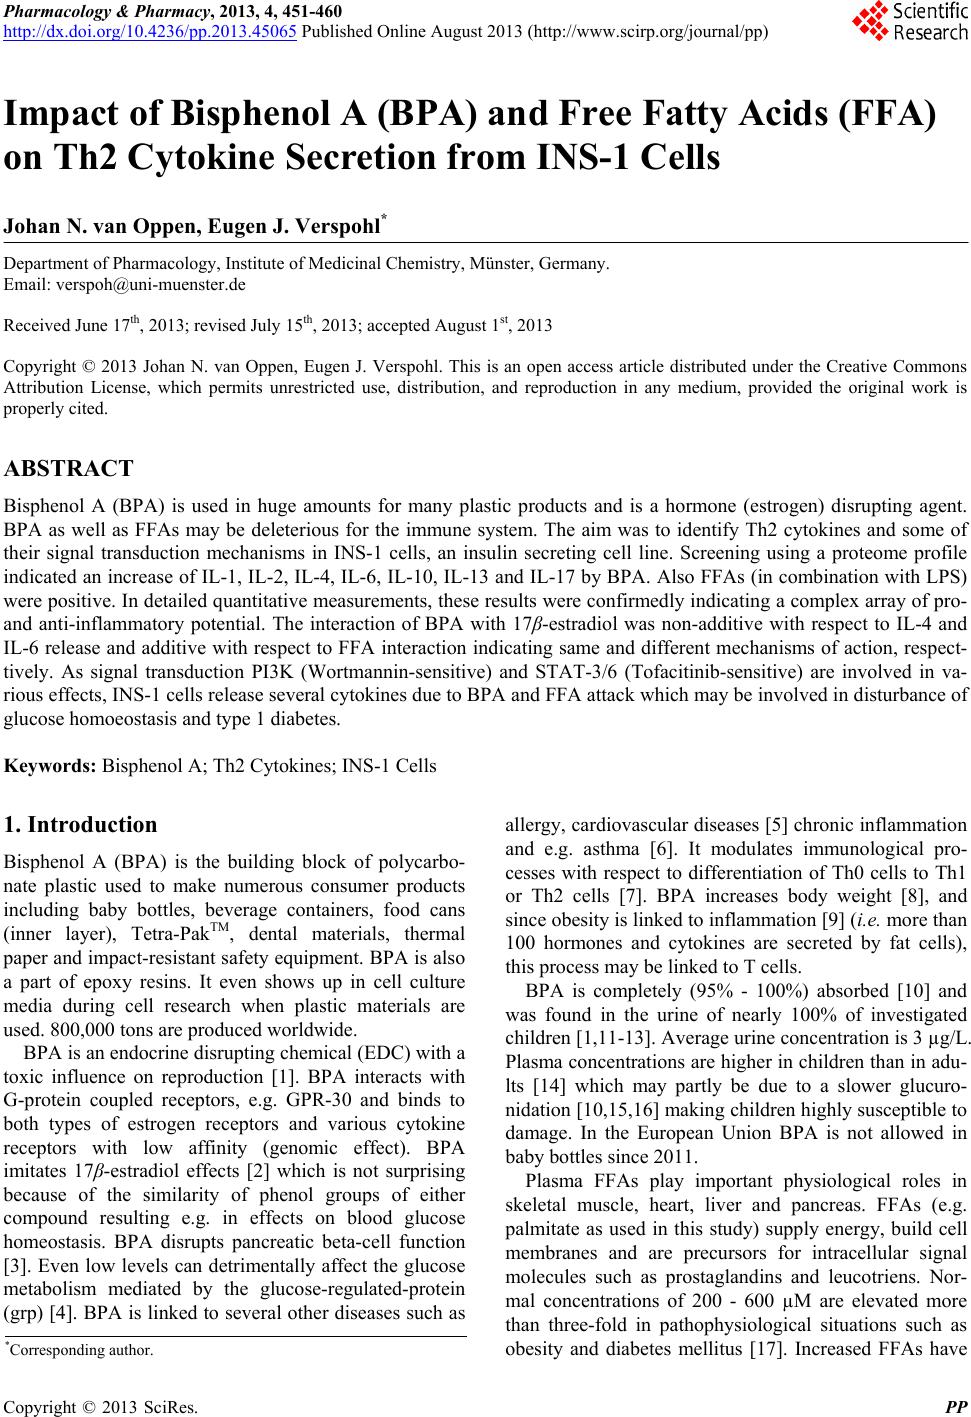
 Pharmacology & Pharmacy, 2013, 4, 451-460 http://dx.doi.org/10.4236/pp.2013.45065 Published Online August 2013 (http://www.scirp.org/journal/pp) 451 Impact of Bisphenol A (BPA) and Free Fatty Acids (FFA) on Th2 Cytokine Secretion from INS-1 Cells Johan N. van Oppen, Eugen J. Verspohl* Department of Pharmacology, Institute of Medicinal Chemistry, Münster, Germany. Email: verspoh@uni-muenster.de Received June 17th, 2013; revised July 15th, 2013; accepted August 1st, 2013 Copyright © 2013 Johan N. van Oppen, Eugen J. Verspohl. This is an open access article distributed under the Creative Commons Attribution License, which permits unrestricted use, distribution, and reproduction in any medium, provided the original work is properly cited. ABSTRACT Bisphenol A (BPA) is used in huge amounts for many plastic products and is a hormone (estrogen) disrupting agent. BPA as well as FFAs may be deleterious for the immune system. The aim was to identify Th2 cytokines and some of their signal transduction mechanisms in INS-1 cells, an insulin secreting cell line. Screening using a proteome profile indicated an increase of IL-1, IL-2, IL-4, IL-6, IL-10, IL-13 and IL-17 by BPA. Also FFAs (in combination with LPS) were positive. In detailed qu antitative measurements, these results were con firmedly indicating a co mplex array of pro- and anti-inflammatory potential. The interaction of BPA with 17β-estradiol was non-additive with respect to IL-4 and IL-6 release and additive with respect to FFA interaction indicating same and different mechanisms of action, respect- tively. As signal transduction PI3K (Wortmannin-sensitive) and STAT-3/6 (Tofacitinib-sensitive) are involved in va- rious effects, INS-1 cells release several cytokines due to BPA and FFA attack which may be involved in disturbance of glucose homoeostasis and type 1 diabetes. Keywords: Bisphenol A; Th2 Cytokines; INS-1 Cells 1. Introduction Bisphenol A (BPA) is the building block of polycarbo- nate plastic used to make numerous consumer products including baby bottles, beverage containers, food cans (inner layer), Tetra-PakTM, dental materials, thermal paper and impact-resistant safety equipment. BPA is also a part of epoxy resins. It even shows up in cell culture media during cell research when plastic materials are used. 800,000 tons are produced worldw ide. BPA is an endocrine disrupting chemical (EDC) with a toxic influence on reproduction [1]. BPA interacts with G-protein coupled receptors, e.g. GPR-30 and binds to both types of estrogen receptors and various cytokine receptors with low affinity (genomic effect). BPA imitates 17β-estradiol effects [2] which is not surprising because of the similarity of phenol groups of either compound resulting e.g. in effects on blood glucose homeostasis. BPA disrupts pancreatic beta-cell function [3]. Even low levels can detrimentally affect the glucose metabolism mediated by the glucose-regulated-protein (grp) [4]. BPA is linked to several other diseases such as allergy, cardiovascular diseases [5] chronic inflammation and e.g. asthma [6]. It modulates immunological pro- cesses with respect to differentiation of Th0 cells to Th1 or Th2 cells [7]. BPA increases body weight [8], and since obesity is linked to inflamma tion [9 ] ( i.e. mor e t han 100 hormones and cytokines are secreted by fat cells), this process may be linked to T cells. BPA is completely (95% - 100%) absorbed [10] and was found in the urine of nearly 100% of investigated children [1,11-13]. Average urine concentration is 3 µg/L. Plasma concentrations are higher in children th an in adu- lts [14] which may partly be due to a slower glucuro- nidation [10,15,16 ] making children high ly susceptib le to damage. In the European Union BPA is not allowed in baby bottles since 2011. Plasma FFAs play important physiological roles in skeletal muscle, heart, liver and pancreas. FFAs (e.g. palmitate as used in this study) supply energy, build cell membranes and are precursors for intracellular signal molecules such as prostaglandins and leucotriens. Nor- mal concentrations of 200 - 600 µM are elevated more than three-fold in pathophysiological situations such as obesity and diabetes mellitus [17]. Increased FFAs have *Corresponding a uthor. Copyright © 2013 SciRes. PP 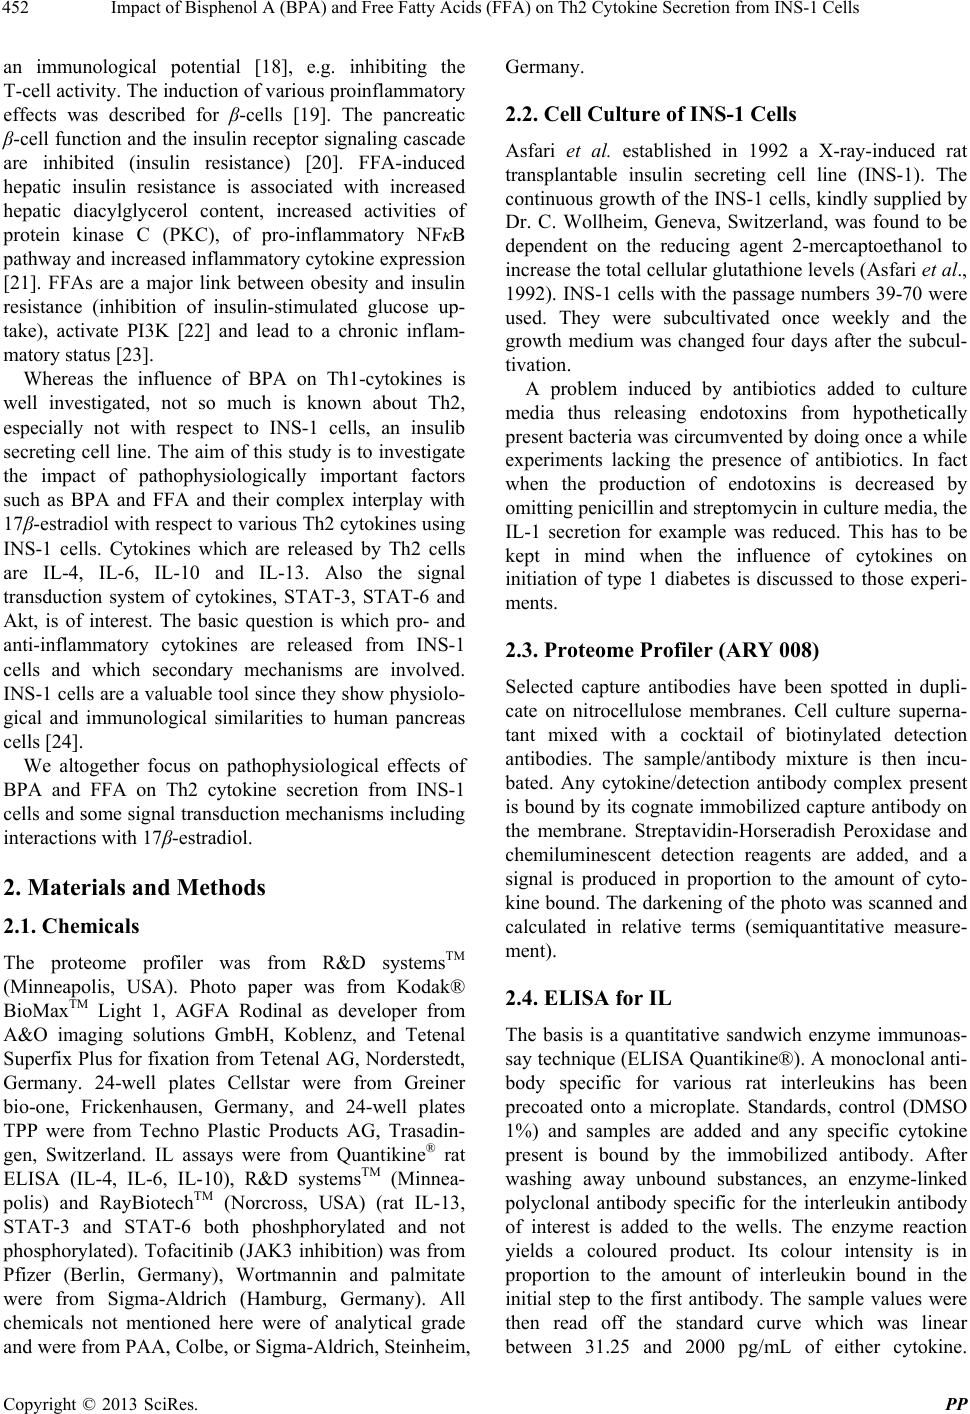 Impact of Bisphenol A (BPA) and Free Fatty Acids (FFA) on Th2 Cytokine Secretion from INS-1 Cells 452 an immunological potential [18], e.g. inhibiting the T-cell activity. The induction of various proinflammato ry effects was described for β-cells [19]. The pancreatic β-cell function and the insulin receptor signaling cascade are inhibited (insulin resistance) [20]. FFA-induced hepatic insulin resistance is associated with increased hepatic diacylglycerol content, increased activities of protein kinase C (PKC), of pro-inflammatory NFκB pathway and increased inflammatory cytokine expression [21]. FFAs are a major link between obesity and insulin resistance (inhibition of insulin-stimulated glucose up- take), activate PI3K [22] and lead to a chronic inflam- matory status [23]. Whereas the influence of BPA on Th1-cytokines is well investigated, not so much is known about Th2, especially not with respect to INS-1 cells, an insulib secreting cell line. The aim of this study is to investigate the impact of pathophysiologically important factors such as BPA and FFA and their complex interplay with 17β-estradiol with respect to various Th2 cytokines using INS-1 cells. Cytokines which are released by Th2 cells are IL-4, IL-6, IL-10 and IL-13. Also the signal transduction system of cytokines, STAT-3, STAT-6 and Akt, is of interest. The basic question is which pro- and anti-inflammatory cytokines are released from INS-1 cells and which secondary mechanisms are involved. INS-1 cells are a valuable to ol since they show physiolo- gical and immunological similarities to human pancreas cells [24]. We altogether focus on pathophysiological effects of BPA and FFA on Th2 cytokine secretion from INS-1 cells and some signal tran sduction mechanisms inclu ding interactions with 17β-estradiol. 2. Materials and Methods 2.1. Chemicals The proteome profiler was from R&D systemsTM (Minneapolis, USA). Photo paper was from Kodak® BioMaxTM Light 1, AGFA Rodinal as developer from A&O imaging solutions GmbH, Koblenz, and Tetenal Superfix Plus for fixation from Tetenal AG, Norderstedt, Germany. 24-well plates Cellstar were from Greiner bio-one, Frickenhausen, Germany, and 24-well plates TPP were from Techno Plastic Products AG, Trasadin- gen, Switzerland. IL assays were from Quantikine® rat ELISA (IL-4, IL-6, IL-10), R&D systemsTM (Minnea- polis) and RayBiotechTM (Norcross, USA) (rat IL-13, STAT-3 and STAT-6 both phoshphorylated and not phosphorylated). Tofacitinib (JAK3 inhibition) was from Pfizer (Berlin, Germany), Wortmannin and palmitate were from Sigma-Aldrich (Hamburg, Germany). All chemicals not mentioned here were of analytical grade and were from PAA, Colbe, or Sigma-Aldrich, Steinheim, Germany. 2.2. Cell Culture of INS-1 Cells Asfari et al. established in 1992 a X-ray-induced rat transplantable insulin secreting cell line (INS-1). The continuous growth of the INS-1 cells, kindly supplied by Dr. C. Wollheim, Geneva, Switzerland, was found to be dependent on the reducing agent 2-mercaptoethanol to increase the total cellular glutathione levels (Asfari et al., 1992). INS-1 cells with the passage numbers 39-70 were used. They were subcultivated once weekly and the growth medium was changed four days after the subcul- tivation. A problem induced by antibiotics added to culture media thus releasing endotoxins from hypothetically present bacteria was circumvented by doing once a while experiments lacking the presence of antibiotics. In fact when the production of endotoxins is decreased by omitting penicillin an d streptomycin in culture media, th e IL-1 secretion for example was reduced. This has to be kept in mind when the influence of cytokines on initiation of type 1 diabetes is discussed to those experi- ments. 2.3. Proteome Profiler (ARY 008) Selected capture antibodies have been spotted in dupli- cate on nitrocellulose membranes. Cell culture superna- tant mixed with a cocktail of biotinylated detection antibodies. The sample/antibody mixture is then incu- bated. Any cytokine/detection antibody complex present is bound by its cognate immobilized capture antibody on the membrane. Streptavidin-Horseradish Peroxidase and chemiluminescent detection reagents are added, and a signal is produced in proportion to the amount of cyto- kine bound. The darkening of the photo was scanned and calculated in relative terms (semiquantitative measure- ment). 2.4. ELISA for IL The basis is a quantitative sandwich enzyme immunoas- say technique (ELISA Quantikine®). A monoclonal anti- body specific for various rat interleukins has been precoated onto a microplate. Standards, control (DMSO 1%) and samples are added and any specific cytokine present is bound by the immobilized antibody. After washing away unbound substances, an enzyme-linked polyclonal antibody specific for the interleukin antibody of interest is added to the wells. The enzyme reaction yields a coloured product. Its colour intensity is in proportion to the amount of interleukin bound in the initial step to the first antibody. The sample values were then read off the standard curve which was linear between 31.25 and 2000 pg/mL of either cytokine. Copyright © 2013 SciRes. PP 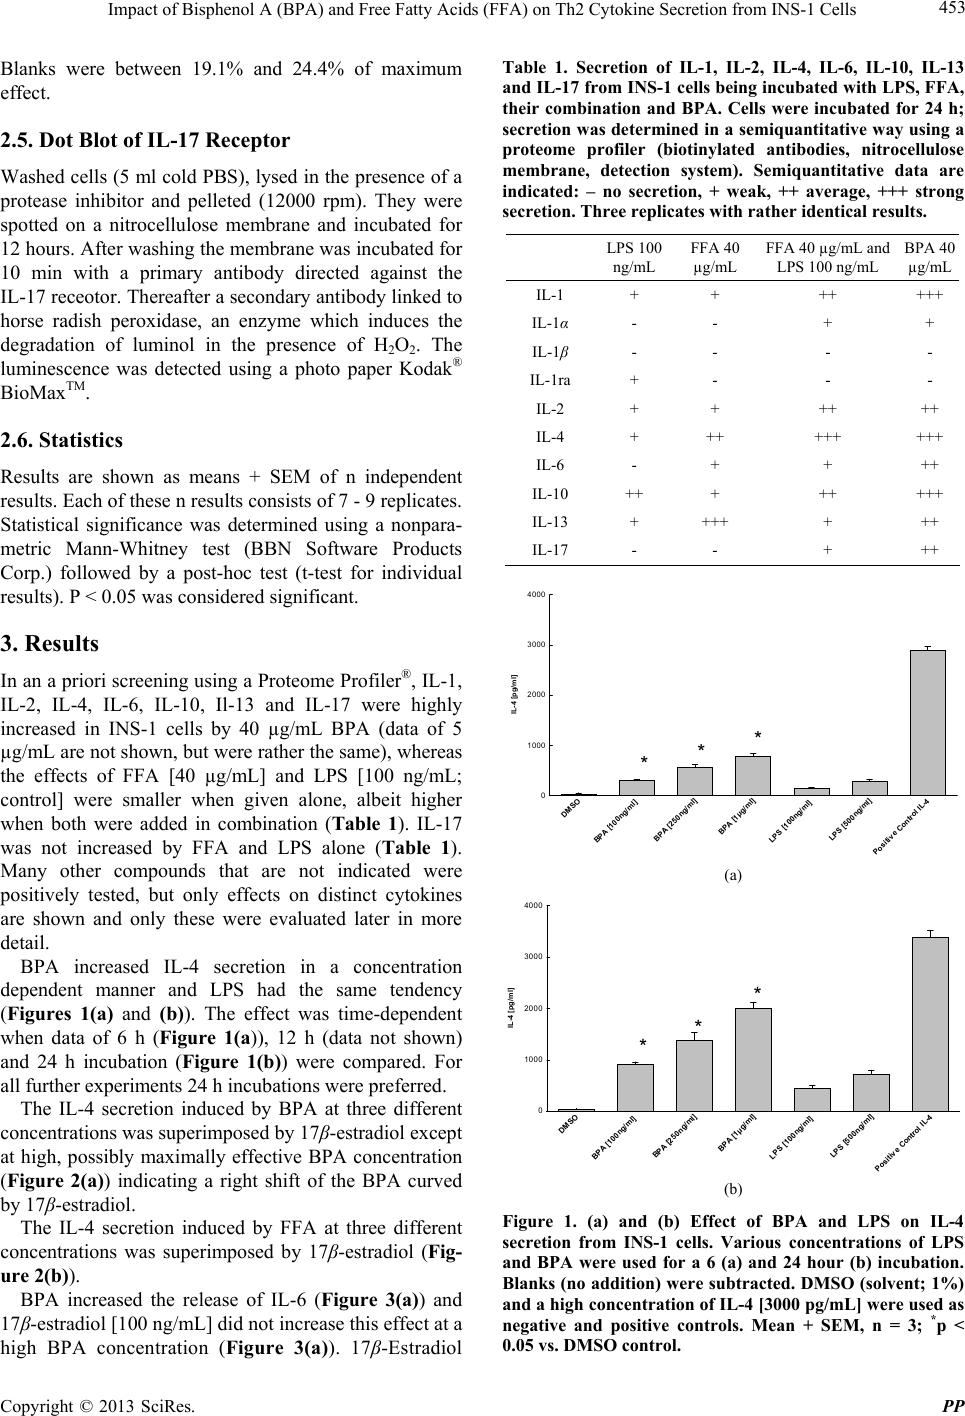 Impact of Bisphenol A (BPA) and Free Fatty Acids (FFA) on Th2 Cytokine Secretion from INS-1 Cells 453 Blanks were between 19.1% and 24.4% of maximum effect. 2.5. Dot Blot of IL-17 Receptor Washed cells (5 ml cold PBS), lysed in the presen ce of a protease inhibitor and pelleted (12000 rpm). They were spotted on a nitrocellulose membrane and incubated for 12 hours. After washing the membrane was incubated for 10 min with a primary antibody directed against the IL-17 receotor. Thereafter a secondary antibody linked to horse radish peroxidase, an enzyme which induces the degradation of luminol in the presence of H2O2. The luminescence was detected using a photo paper Kodak® BioMaxTM. 2.6. Statistics Results are shown as means + SEM of n independent results. Each of these n results consists of 7 - 9 replicates. Statistical significance was determined using a nonpara- metric Mann-Whitney test (BBN Software Products Corp.) followed by a post-hoc test (t-test for individual results). P < 0.05 was considered significan t. 3. Results In an a priori screening using a Proteome Profiler®, IL-1, IL-2, IL-4, IL-6, IL-10, Il-13 and IL-17 were highly increased in INS-1 cells by 40 µg/mL BPA (data of 5 µg/mL are not shown, but were rather the same), whereas the effects of FFA [40 µg/mL] and LPS [100 ng/mL; control] were smaller when given alone, albeit higher when both were added in combination (Table 1). IL-17 was not increased by FFA and LPS alone (Table 1). Many other compounds that are not indicated were positively tested, but only effects on distinct cytokines are shown and only these were evaluated later in more detail. BPA increased IL-4 secretion in a concentration dependent manner and LPS had the same tendency (Figures 1(a) and (b)). The effect was time-dependent when data of 6 h (Figure 1(a)), 12 h (data not shown) and 24 h incubation (Figure 1(b)) were compared. For all further experiments 24 h incubations were preferred. The IL-4 secretion induced by BPA at three different concentrations was superimposed by 17β-estradiol except at high, possibly maximally effective BPA concentration (Figure 2(a)) indicating a right shift of the BPA curved by 17β-estradiol. The IL-4 secretion induced by FFA at three different concentrations was superimposed by 17β-estradiol (Fig- ure 2(b)). BPA increased the release of IL-6 (Figure 3(a)) and 17β-estradiol [100 ng/mL] did not increase this effect at a high BPA concentration (Figure 3(a)). 17β-Estradiol Table 1. Secretion of IL-1, IL-2, IL-4, IL-6, IL-10, IL-13 and IL-17 from INS-1 cells being incubated with LPS, FFA, their combination and BPA. Cells were incubated for 24 h; secretion was determined in a semiquantitative way using a proteome profiler (biotinylated antibodies, nitrocellulose membrane, detection system). Semiquantitative data are indicated: – no secretion, + weak, ++ average, +++ strong secretion. Three replicates with rather identical results. LPS 100 ng/mL FFA 40 µg/mL FFA 40 µg/mL and LPS 100 ng/mL BPA 40 µg/mL IL-1 + + ++ +++ IL-1α - - + + IL-1β - - - - IL-1ra + - - - IL-2 + + ++ ++ IL-4 + ++ +++ +++ IL-6 - + + ++ IL-10 ++ + ++ +++ IL-13 + +++ + ++ IL-17 - - + ++ DM S O BPA [10 0ng/ml] BPA [250ng/ml] BPA [1µg/ml] LPS [100ng/ ml] LPS [500ng/ml] Positive Control IL-4 IL-4 [pg/ml] 0 1000 2000 3000 4000 ** * (a) DM SO BP A [100ng/ml] BPA [250ng/ml] BPA [1µg /ml] LPS [100ng/ml] LPS [500ng/ml] Positive Control IL-4 IL-4 [pg/ml] 0 1000 2000 3000 4000 * * * (b) Figure 1. (a) and (b) Effect of BPA and LPS on IL-4 secretion from INS-1 cells. Various concentrations of LPS and BPA were used for a 6 (a) and 24 hour (b) incubation. Blanks (no addition) were subtracted. DMSO (solvent; 1%) and a high concentration of IL-4 [3000 pg/mL] were used as negative and positive controls. Mean + SEM, n = 3; *p < 0.05 vs. DMSO control. Copyright © 2013 SciRes. PP  Impact of Bisphenol A (BPA) and Free Fatty Acids (FFA) on Th2 Cytokine Secretion from INS-1 Cells 454 DMSO BPA [100 ng/m]l BPA [100ng/ml ]+Estr a d io l [100ng/ml] BPA [250n g /ml] BPA [250ng/ml]+Estradiol [250ng/ml] BPA [1µg/ml] BPA [1µg/ml]+ Estradiol [1µg/ml] Posit ive Control IL-4 IL-4 pg/ml 0 1000 2000 3000 4000 ** + ** + * (a) DMSO FFA [100n g /ml] FFA [100ng /ml]+Estrad iol [1µg/ml] FFA [500n g/ml] FFA [500ng/ml]+Estr ad i ol [1µg/ml] FFA [1µg/ml] FFA [1µg/ml]+Estrad i ol [1µg/ml] Positive C ontrol IL-4 IL-4 [pg/ml] 0 1000 2000 3000 4000 ** + ** + (b) Figure 2. (a) and (b) Modulatory effect of 17β-Esradiol on BPA-induced (a) and FFA-induced (b) IL-4 secretion from INS-1 cells. Blanks (no addition) were subtracted. DMSO (solvent; 1%) and a high concentration of IL-4 [3000 pg/mL] were used as negative and positive co ntrols. Mean + SEM, n = 3: *p < 0.05 vs. DMSO control; +p < 0.05 vs. absence of 17β-estradiol. [100 ng/mL] increased the release of IL-6 (Figure 3(b)) which is superimposed by increasing concentrations of BPA until a maximum BPA concentration of 1.0 µg/mL indicating the same type of mechanism. Table 2 shows the effect of various concentrations of FFA and LPS on IL-6 secretion. Both compounds increa- sed IL-6 release in a concentration-dependent manner. 17β-Estradiol [100 ng/mL] was not able to increase the effect of FFA at 1 µg/mL. BPA, LPS and FFA increased IL-10 secretion (Figure 4(a)). This effect of BPA at 1 µg/mL was further DM S O BPA [250ng/ml ] BPA [500ng/ml] BPA [1µg/ml] BPA [2,5µg/ml] BPA [1µg/ml]+Estradiol [100ng/ ml] Positive Control IL-6 IL-6 [pg/ml] 0 200 400 600 800 1000 ** *** (a) DM SO Estra di ol [100ng/ml ] BPA [250ng/ml]+Estradiol [100ng/ml] BPA [500ng/ml]+Estradiol [100ng/ml] BP A [1µg/ml]+ Es tr adi ol [100ng/ml] BPA [2.5µg/ml]+Estr adiol [100ng/ml] Positive Control IL-6 I L -6 [p g /ml ] 0 200 400 600 800 1000 *** ** (b) Figure 3. Effect of various concentrations of BPA and a combination with 17β-estradiol on IL-6 secretion from INS-1 cells. 17β-estradiol [100 ng/mL] was combined with various concentrations of BPA [0 to 2.5 µg/mL]. Blanks (no addition) were subtracted. DMSO (solvent; 1%) and a high concentration of IL-6 [650 pg/mL] were used as negative and positive controls. Mean + SEM, n = 4; *p = 0.05 vs. DMSO control. Table 2. Effect of FFA and LPS on IL-6 release from INS-1 cells (24 h incubation). Details see in the legend of Figure 3. COMPOUND IL-6 [PG/ML] DMSO (0.1%) 14.3 ± 0.4 FFA [0.5 µg/mL] 99.7 ± 8 .3* FFA (1 µg/mL) 197.2 ± 22.4* FFA [2.5 µg/mL] 276.4 ± 35.6* FFA [2.5 µg/mL] + 17β-Estradiol [1 00 ng /mL] 262.6 ± 33.7* (N.S. vs. absence of 17β-estradiol) FFA [5.0 µg/ml] 296.9 ± 18.7* LPS [50 ng/mL] 186.3 ± 24.6* LPS [100 ng/ml ] 298.3 ± 16.7* Positive control: IL-6 [650 pg/mL] 639.2 ± 24.6 Copyright © 2013 SciRes. PP 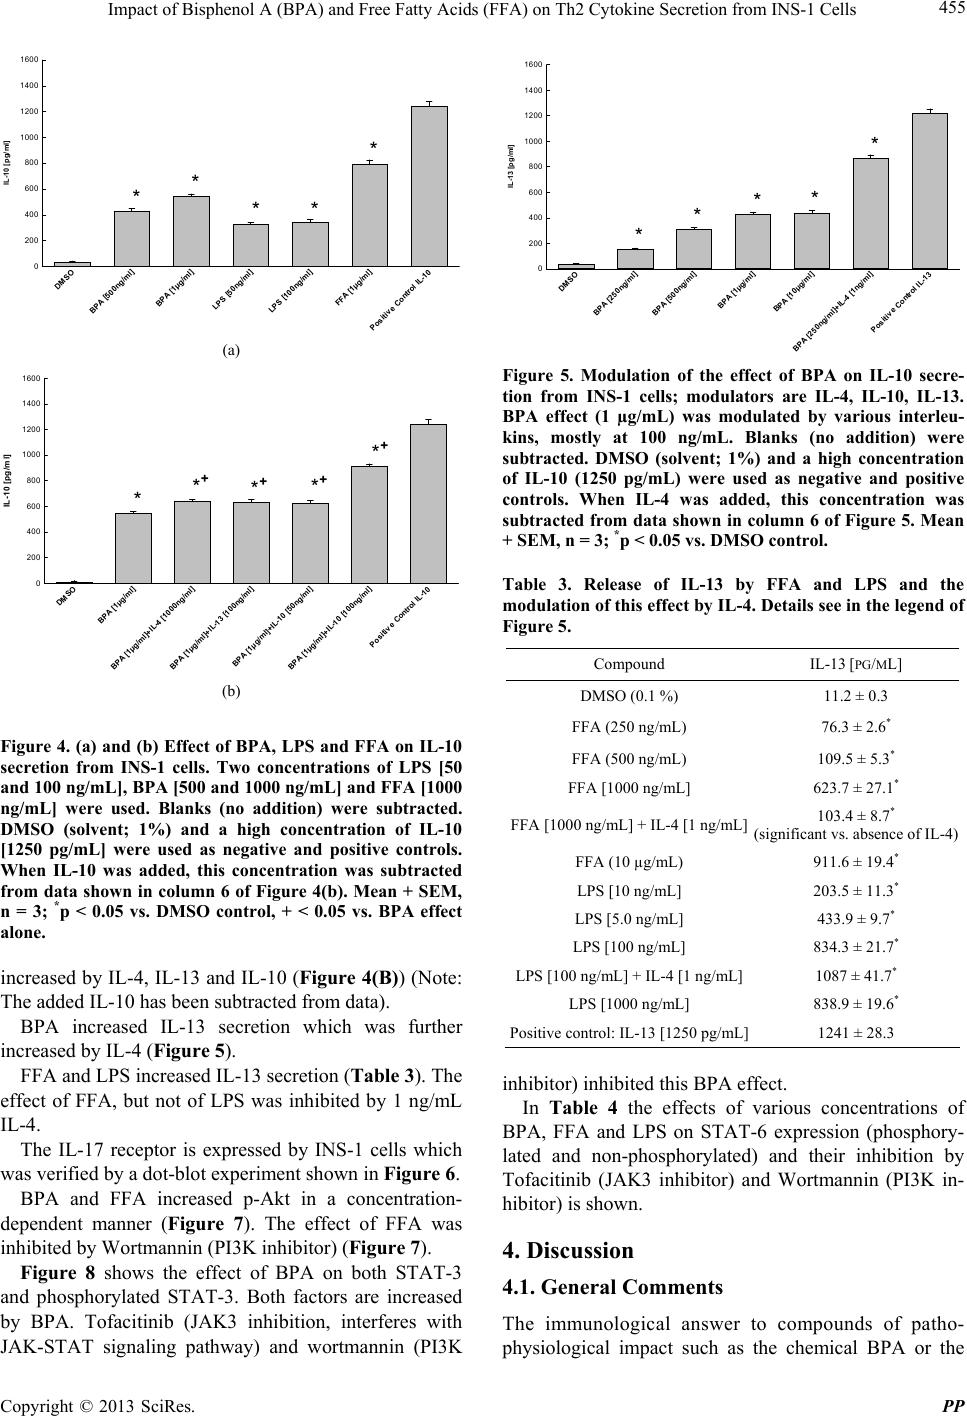 Impact of Bisphenol A (BPA) and Free Fatty Acids (FFA) on Th2 Cytokine Secretion from INS-1 Cells 455 DMSO BPA [500ng/ml] BPA [1µg/ml] LPS [50n g/ml] LPS [100ng/ml] FFA [1µg/ml] Positive Control IL-10 IL-10 [p g/ ml] 0 200 400 600 800 1000 1200 1400 1600 **** * (a) DMS O BPA [1µg/ml] BPA [1µg/ml]+IL-4 [1000ng/ml] BPA [1µg/ml]+IL-13 [100ng/ml] BPA [1 µg/ m l]+ I L-10 [50ng/ml] BPA [1µg/ml]+IL-10 [1 00n g/ml] Positive Control IL-10 IL-10 [pg/ml] 0 200 400 600 800 1000 1200 1400 1600 ** + * + * + * + (b) Figure 4. (a) and (b) Effect of BPA, LP S and FFA on IL-10 secretion from INS-1 cells. Two concentrations of LPS [50 and 100 ng/mL], BPA [500 and 1000 ng/mL] and FFA [1000 ng/mL] were used. Blanks (no addition) were subtracted. DMSO (solvent; 1%) and a high concentration of IL-10 [1250 pg/mL] were used as negative and positive controls. When IL-10 was added, this concentration was subtracted from data shown in column 6 of Figure 4(b). Mean + SEM, n = 3; *p < 0.05 vs. DMSO control, + < 0.05 vs. BPA effect alone. increased by IL-4, IL-13 and IL-10 (Figure 4(B)) (Note: The added IL-10 has been subtracted from data). BPA increased IL-13 secretion which was further increased by IL-4 (Figure 5). FFA and LPS increased IL-13 secretion (Table 3). The effect of FFA, but not of LPS was inhibited by 1 ng/mL IL-4. The IL-17 receptor is expressed by INS-1 cells which was verified by a dot-blot experiment shown in Figure 6. BPA and FFA increased p-Akt in a concentration- dependent manner (Figure 7). The effect of FFA was inhibited by Wortmannin (PI3K inhibitor) (Figure 7). Figure 8 shows the effect of BPA on both STAT-3 and phosphorylated STAT-3. Both factors are increased by BPA. Tofacitinib (JAK3 inhibition, interferes with JAK-STAT signaling pathway) and wortmannin (PI3K DMSO BPA [250ng/ml ] BPA [500ng/ml] BPA [1µg/ml] BPA [10µg/ml] BPA [250ng/ ml ]+IL-4 [1n g/ml] Positi ve Control IL-13 I L-13 [p g / ml ] 0 200 400 600 800 1000 1200 1400 1600 **** * Figure 5. Modulation of the effect of BPA on IL-10 secre- tion from INS-1 cells; modulators are IL-4, IL-10, IL-13. BPA effect (1 µg/mL) was modulated by various interleu- kins, mostly at 100 ng/mL. Blanks (no addition) were subtracted. DMSO (solvent; 1%) and a high concentration of IL-10 (1250 pg/mL) were used as negative and positive controls. When IL-4 was added, this concentration was subtracted from data shown in column 6 of Figure 5. Mean + SEM, n = 3; *p < 0.05 vs. DMSO control. Table 3. Release of IL-13 by FFA and LPS and the modulation of this effect by IL-4. Details see in the legend of Figure 5. Compound IL-13 [PG/ML] DMSO (0.1 %) 11.2 ± 0.3 FFA (250 ng/mL) 76.3 ± 2.6* FFA (500 ng/mL) 109.5 ± 5.3* FFA [1000 ng/mL] 623.7 ± 27.1* FFA [1000 ng/mL] + IL-4 [1 ng/mL] 103.4 ± 8.7* (significant vs. absence of IL-4) FFA (10 µg/mL) 911.6 ± 19.4* LPS [10 ng/mL] 203.5 ± 11.3* LPS [5.0 ng/mL] 433.9 ± 9.7* LPS [100 ng/mL] 834.3 ± 21.7* LPS [100 ng/mL] + IL-4 [1 ng/mL] 1087 ± 41.7* LPS [1000 ng/mL] 838.9 ± 19.6* Positive control: IL-13 [1250 pg/mL] 1241 ± 28.3 inhibitor) inhibited this BPA effect. In Table 4 the effects of various concentrations of BPA, FFA and LPS on STAT-6 expression (phosphory- lated and non-phosphorylated) and their inhibition by Tofacitinib (JAK3 inhibitor) and Wortmannin (PI3K in- hibitor) is shown. 4. Discussion 4.1. General Comments The immunological answer to compounds of patho- physiological impact such as the chemical BPA or the Copyright © 2013 SciRes. PP 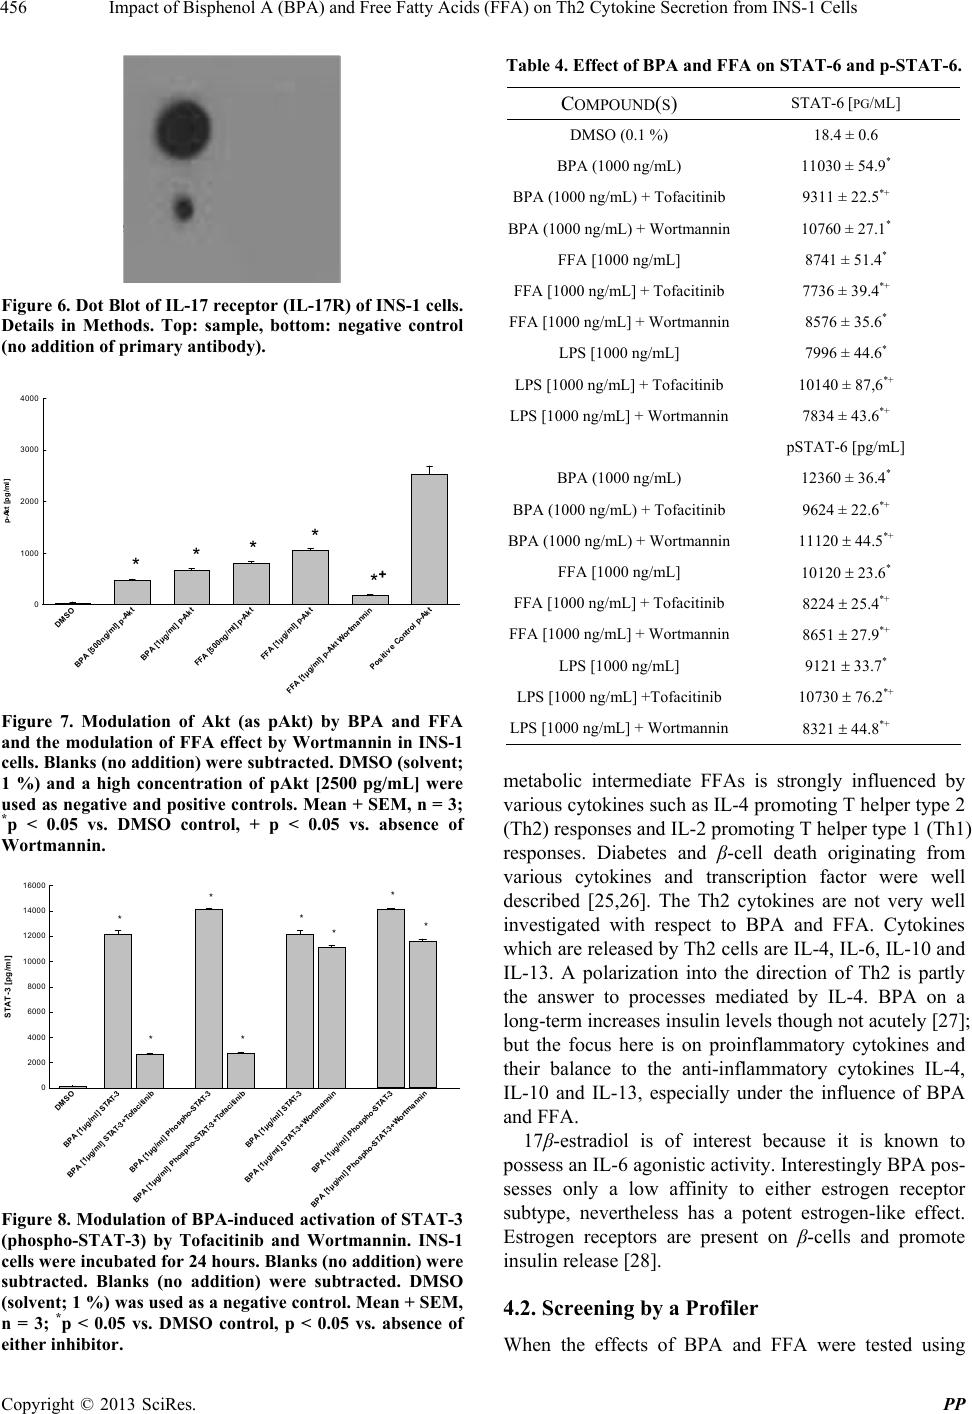 Impact of Bisphenol A (BPA) and Free Fatty Acids (FFA) on Th2 Cytokine Secretion from INS-1 Cells 456 Figure 6. Dot Blot of IL-17 receptor (IL-17R) of INS-1 cells. Details in Methods. Top: sample, bottom: negative control (no addition of primary antibody). DMSO BPA [500ng/ml] p-Akt BPA [1µg/ml] p-Akt FFA [500ng/m l] p-Akt FFA [1µg/ml] p-Akt FFA [1µg/ml] p-Akt Wor tmannin Positive Co n trol p-Akt p-Akt [pg/ml] 0 1000 2000 3000 4000 **** * + Figure 7. Modulation of Akt (as pAkt) by BPA and FFA and the modulation of FFA effect by Wortmannin in INS-1 cells. Blanks (no addition) were subtracted. DMSO (solvent; 1 %) and a high concentration of pAkt [2500 pg/mL] were used as negative and positive contr ols. Mean + SEM, n = 3; *p < 0.05 vs. DMSO control, + p < 0.05 vs. absence of Wortmannin. DM S O BPA [1µg/ml] STAT-3 BPA [1 µ g / ml] STAT-3+Tofacitinib BPA [1µ g /m l] Phospho-S TAT-3 BPA [1 µ g / ml] Phospho-STAT- 3+Tofacitinib BPA [1µ g /m l] S TAT-3 BPA [1µg/ml] STAT-3+Wortma nni n BPA [1 µ g / ml] Phos ph o-STAT-3 BPA [1µg/ml] P hos pho-STAT-3+Wortmannin STAT-3 [pg/ml] 0 2000 4000 6000 8000 10000 12000 14000 16000 * * * * * * * * Figure 8. Modulation of BPA-induced activation of STAT-3 (phospho-STAT-3) by Tofacitinib and Wortmannin. INS-1 cells were incubated for 24 hours. Blanks (no addition) w ere subtracted. Blanks (no addition) were subtracted. DMSO (solvent; 1 %) was used as a negative control. Mean + SEM, n = 3; *p < 0.05 vs. DMSO control, p < 0.05 vs. absence of either inhibitor. Table 4. Effect of BPA and FFA on STAT-6 and p-STAT-6. COMPOUND(S) STAT-6 [PG/ML] DMSO (0.1 %) 18.4 ± 0.6 BPA (1000 ng/mL) 11030 ± 54.9* BPA (1000 ng/mL) + Tofacitinib9311 ± 22.5*+ BPA (1000 ng/mL) + Wortmannin 10760 ± 27.1* FFA [1000 ng/mL] 8741 ± 51.4* FFA [1000 ng/mL] + Tofacitinib7736 ± 39.4*+ FFA [1000 ng/mL] + Wortmannin 8576 ± 35.6* LPS [1000 ng/mL] 7996 ± 44.6* LPS [1000 ng/mL] + Tofacitinib10140 ± 87,6*+ LPS [1000 ng/mL] + Wortmannin7834 ± 43.6*+ pSTAT-6 [pg/mL] BPA (1000 ng/mL) 12360 ± 36.4* BPA (1000 ng/mL) + Tofacitinib9624 ± 22.6*+ BPA (1000 ng/mL) + Wortmannin 11120 44.5*+ FFA [1000 ng/mL] 10120 23.6* FFA [1000 ng/mL] + Tofacitinib8224 25.4*+ FFA [1000 ng/mL] + Wortmannin 8651 27.9*+ LPS [1000 ng/mL] 9121 33.7* LPS [1000 ng/mL] +Tofacitinib10730 76.2*+ LPS [1000 ng/mL] + Wortmannin8321 44.8*+ metabolic intermediate FFAs is strongly influenced by various cytokines such as IL-4 promoting T helper type 2 (Th2) responses and IL-2 promoting T helper type 1 (Th1) responses. Diabetes and β-cell death originating from various cytokines and transcription factor were well described [25,26]. The Th2 cytokines are not very well investigated with respect to BPA and FFA. Cytokines which are released by Th2 cells are IL-4, IL-6, IL-10 and IL-13. A polarization into the direction of Th2 is partly the answer to processes mediated by IL-4. BPA on a long-term increases insulin levels thoug h not acutely [27]; but the focus here is on proinflammatory cytokines and their balance to the anti-inflammatory cytokines IL-4, IL-10 and IL-13, especially under the influence of BPA and FFA. 17β-estradiol is of interest because it is known to possess an IL-6 agonistic activ ity. Interesting ly BPA pos- sesses only a low affinity to either estrogen receptor subtype, nevertheless has a potent estrogen-like effect. Estrogen receptors are present on β-cells and promote insulin release [28]. 4.2. Screening by a Profiler When the effects of BPA and FFA were tested using Copyright © 2013 SciRes. PP 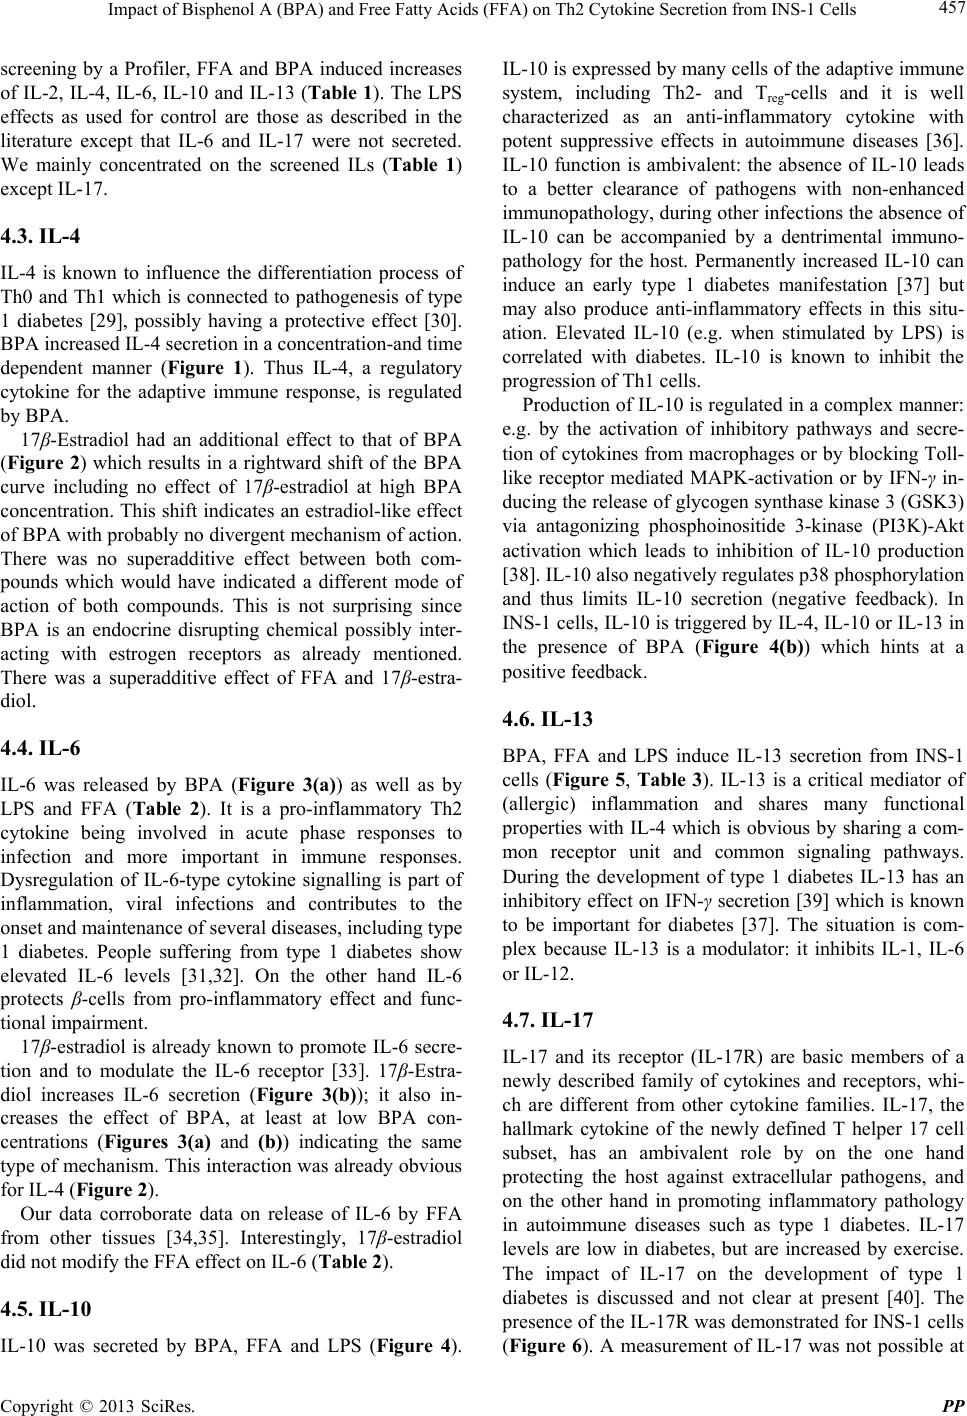 Impact of Bisphenol A (BPA) and Free Fatty Acids (FFA) on Th2 Cytokine Secretion from INS-1 Cells 457 screening by a Profiler, FFA and BPA induced increases of IL-2, IL-4, IL-6, IL-10 and IL-13 (Table 1). The LPS effects as used for control are those as described in the literature except that IL-6 and IL-17 were not secreted. We mainly concentrated on the screened ILs (Table 1) except IL-17. 4.3. IL-4 IL-4 is known to influence the differentiation process of Th0 and Th1 which is connected to pathogenesis of type 1 diabetes [29], possibly having a protective effect [30]. BPA increased IL-4 secretion in a concentration-and time dependent manner (Figure 1). Thus IL-4, a regulatory cytokine for the adaptive immune response, is regulated by BPA. 17β-Estradiol had an additional effect to that of BPA (Figure 2) which results in a rightward shift of the BPA curve including no effect of 17β-estradiol at high BPA concentration. This shift indi cates an estradiol-like effect of BPA with probably no divergent mechanism of action. There was no superadditive effect between both com- pounds which would have indicated a different mode of action of both compounds. This is not surprising since BPA is an endocrine disrupting chemical possibly inter- acting with estrogen receptors as already mentioned. There was a superadditive effect of FFA and 17β-estra- diol. 4.4. IL-6 IL-6 was released by BPA (Figure 3(a)) as well as by LPS and FFA (Table 2). It is a pro-inflammatory Th2 cytokine being involved in acute phase responses to infection and more important in immune responses. Dysregulation of IL-6-type cytokine signalling is part of inflammation, viral infections and contributes to the onset and maintenance of several diseases, including type 1 diabetes. People suffering from type 1 diabetes show elevated IL-6 levels [31,32]. On the other hand IL-6 protects β-cells from pro-inflammatory effect and func- tional impairment. 17β-estradiol is already known to promote IL-6 secre- tion and to modulate the IL-6 receptor [33]. 17β-Estra- diol increases IL-6 secretion (Figure 3(b)); it also in- creases the effect of BPA, at least at low BPA con- centrations (Figures 3(a) and (b)) indicating the same type of mechanism. This interaction was already obv ious for IL-4 (Figure 2). Our data corroborate data on release of IL-6 by FFA from other tissues [34,35]. Interestingly, 17β-estradiol did not modify the FFA effect on IL-6 (Table 2). 4.5. IL-10 IL-10 was secreted by BPA, FFA and LPS (Figure 4). IL-10 is expressed by many cells of the adaptive immune system, including Th2- and Treg-cells and it is well characterized as an anti-inflammatory cytokine with potent suppressive effects in autoimmune diseases [36]. IL-10 function is ambivalent: the absence of IL-10 leads to a better clearance of pathogens with non-enhanced immunopathology, during other infections the absence of IL-10 can be accompanied by a dentrimental immuno- pathology for the host. Permanently increased IL-10 can induce an early type 1 diabetes manifestation [37] but may also produce anti-inflammatory effects in this situ- ation. Elevated IL-10 (e.g. when stimulated by LPS) is correlated with diabetes. IL-10 is known to inhibit the progression of Th1 cells. Production of IL-10 is regulated in a complex manner: e.g. by the activation of inhibitory pathways and secre- tion of cytokines from macrophages or by blocking Toll- like receptor mediated MAPK-activation or by IFN-γ in- ducing the release of glycogen synthase kinase 3 (GSK3) via antagonizing phosphoinositide 3-kinase (PI3K)-Akt activation which leads to inhibition of IL-10 production [38]. IL-10 also nega tively regulates p38 phospho rylation and thus limits IL-10 secretion (negative feedback). In INS-1 cells, IL-10 is triggered by IL-4, IL-10 or IL-13 in the presence of BPA (Figure 4(b)) which hints at a positive feedback. 4.6. IL-13 BPA, FFA and LPS induce IL-13 secretion from INS-1 cells (Figure 5, Table 3). IL-13 is a critical mediator of (allergic) inflammation and shares many functional properties with IL-4 which is obvious by sharing a com- mon receptor unit and common signaling pathways. During the development of type 1 diabetes IL-13 has an inhibitory effect on IFN-γ secretion [39] which is known to be important for diabetes [37]. The situation is com- plex because IL-13 is a modulator: it inhibits IL-1, IL-6 or IL-12. 4.7. IL-17 IL-17 and its receptor (IL-17R) are basic members of a newly described family of cytokines and receptors, whi- ch are different from other cytokine families. IL-17, the hallmark cytokine of the newly defined T helper 17 cell subset, has an ambivalent role by on the one hand protecting the host against extracellular pathogens, and on the other hand in promoting inflammatory pathology in autoimmune diseases such as type 1 diabetes. IL-17 levels are low in diabetes, but are increased by exercise. The impact of IL-17 on the development of type 1 diabetes is discussed and not clear at present [40]. The presence of the IL-17R was demonstrated for INS-1 cells (Figure 6). A measurement of IL-17 was not possible at Copyright © 2013 SciRes. PP 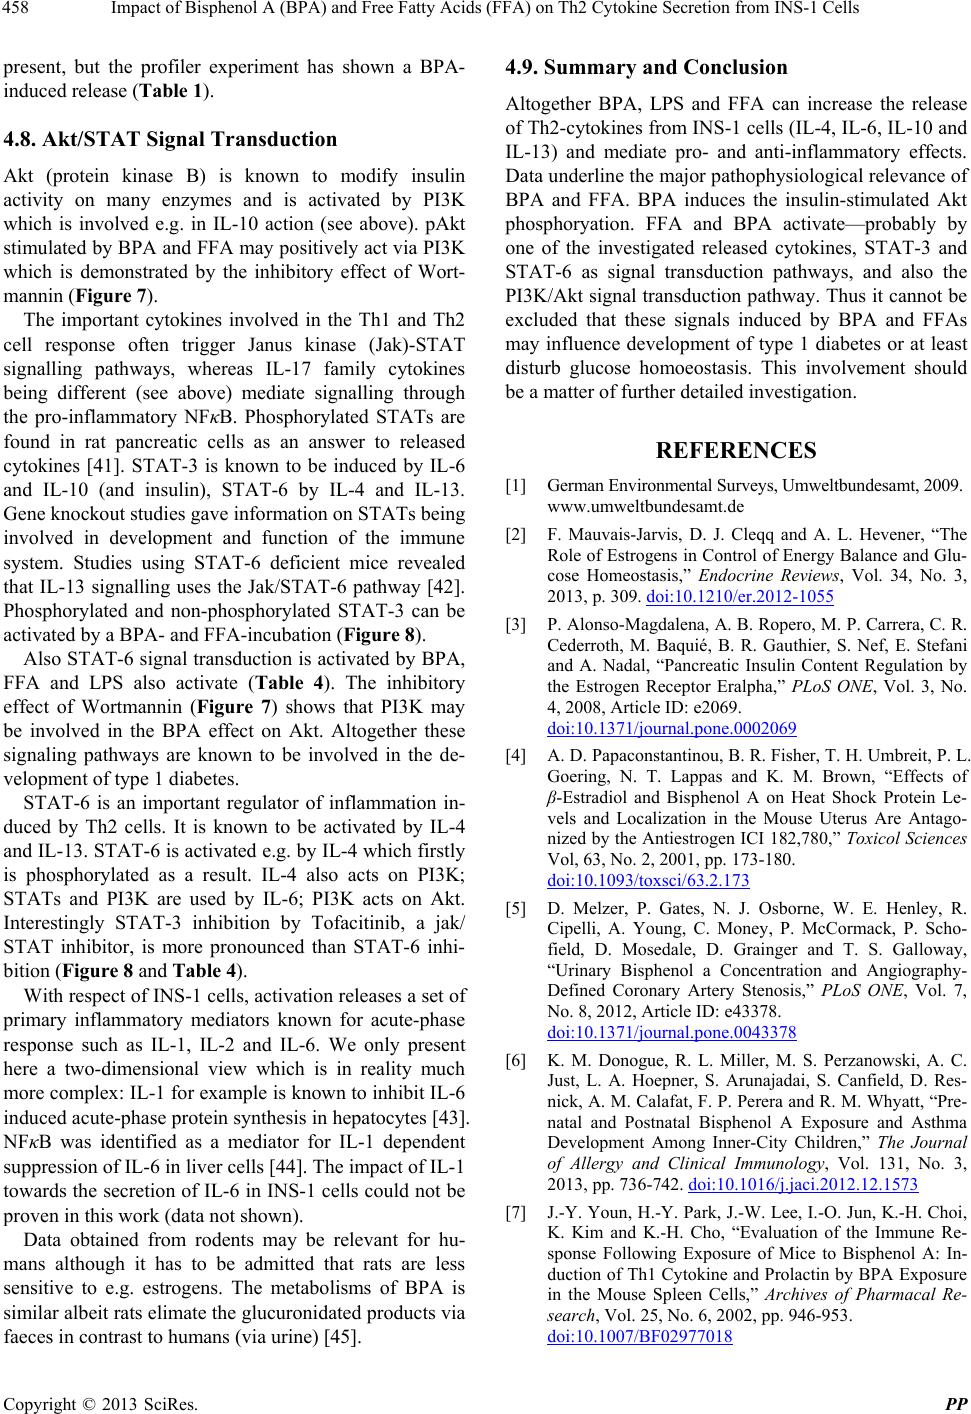 Impact of Bisphenol A (BPA) and Free Fatty Acids (FFA) on Th2 Cytokine Secretion from INS-1 Cells 458 present, but the profiler experiment has shown a BPA- induced release (Table 1). 4.8. Akt/STAT Signal Transduction Akt (protein kinase B) is known to modify insulin activity on many enzymes and is activated by PI3K which is involved e.g. in IL-10 action (see above). pAkt stimulated by BPA and FFA may positively act via PI3K which is demonstrated by the inhibitory effect of Wort- mannin (Figure 7). The important cytokines involved in the Th1 and Th2 cell response often trigger Janus kinase (Jak)-STAT signalling pathways, whereas IL-17 family cytokines being different (see above) mediate signalling through the pro-inflammatory NFκB. Phosphorylated STATs are found in rat pancreatic cells as an answer to released cytokines [41]. STAT-3 is known to be induced by IL-6 and IL-10 (and insulin), STAT-6 by IL-4 and IL-13. Gene knoc kout studies g av e information on STATs being involved in development and function of the immune system. Studies using STAT-6 deficient mice revealed that IL-13 signalling uses the Jak/STAT-6 pathway [42]. Phosphorylated and non-phosphorylated STAT-3 can be activated by a BPA- and FFA-incubatio n (Figure 8). Also STAT-6 signal transduction is activated by BPA, FFA and LPS also activate (Table 4). The inhibitory effect of Wortmannin (Figure 7) shows that PI3K may be involved in the BPA effect on Akt. Altogether these signaling pathways are known to be involved in the de- velopment of type 1 diabetes. STAT-6 is an important regulator of inflammation in- duced by Th2 cells. It is known to be activated by IL-4 and IL-13. STAT-6 is activated e.g. by IL-4 which firstly is phosphorylated as a result. IL-4 also acts on PI3K; STATs and PI3K are used by IL-6; PI3K acts on Akt. Interestingly STAT-3 inhibition by Tofacitinib, a jak/ STAT inhibitor, is more pronounced than STAT-6 inhi- bition (Figure 8 and Table 4). With respect of INS-1 cells, activation releases a set of primary inflammatory mediators known for acute-phase response such as IL-1, IL-2 and IL-6. We only present here a two-dimensional view which is in reality much more complex: IL-1 for example is known to inhibit IL-6 induced acute-phase protein synthesis in hepatocytes [43]. NFκB was identified as a mediator for IL-1 dependent suppression of IL-6 in liver cells [44]. Th e impact of IL-1 towards the secretion of IL-6 in INS-1 cells could not be proven in this work (data not shown). Data obtained from rodents may be relevant for hu- mans although it has to be admitted that rats are less sensitive to e.g. estrogens. The metabolisms of BPA is similar albeit rats elimate the glucuronidated products via faeces in contrast to humans (via urine) [45]. 4.9. Summary and Conclusion Altogether BPA, LPS and FFA can increase the release of Th2-cytokines from INS-1 cells (IL-4, IL-6, IL-10 and IL-13) and mediate pro- and anti-inflammatory effects. Data underline the major pathophysiological relevance of BPA and FFA. BPA induces the insulin-stimulated Akt phosphoryation. FFA and BPA activate—probably by one of the investigated released cytokines, STAT-3 and STAT-6 as signal transduction pathways, and also the PI3K/Akt signal transduc tion pathway. Thus it cannot be excluded that these signals induced by BPA and FFAs may influence development of type 1 diabetes or at least disturb glucose homoeostasis. This involvement should be a matter of further detailed investigation. REFERENCES [1] German Environmental Surveys, Umweltbundesamt, 2009. www.umweltbundesamt.de [2] F. Mauvais-Jarvis, D. J. Cleqq and A. L. Hevener, “The Role of Estrogens in Control of Energy Balance and Glu- cose Homeostasis,” Endocrine Reviews, Vol. 34, No. 3, 2013, p. 309. doi:10.1210/er.2012-1055 [3] P. Alonso-Magdalena, A. B. Ropero, M. P. Carrera, C. R. Cederroth, M. Baquié, B. R. Gauthier, S. Nef, E. Stefani and A. Nadal, “Pancreatic Insulin Content Regulation by the Estrogen Receptor Eralpha,” PLoS ONE, Vol. 3, No. 4, 2008, Article ID: e2069. doi:10.1371/journal.pone.0002069 [4] A. D. Papaconstantinou, B. R. Fisher, T. H. Umbreit, P. L. Goering, N. T. Lappas and K. M. Brown, “Effects of β-Estradiol and Bisphenol A on Heat Shock Protein Le- vels and Localization in the Mouse Uterus Are Antago- nized by the Antiestrogen ICI 182,780,” Toxicol Sciences Vol, 63, No. 2, 2001, pp. 173-180. doi:10.1093/toxsci/63.2.173 [5] D. Melzer, P. Gates, N. J. Osborne, W. E. Henley, R. Cipelli, A. Young, C. Money, P. McCormack, P. Scho- field, D. Mosedale, D. Grainger and T. S. Galloway, “Urinary Bisphenol a Concentration and Angiography- Defined Coronary Artery Stenosis,” PLoS ONE, Vol. 7, No. 8, 2012, Article ID: e43378. doi:10.1371/journal.pone.0043378 [6] K. M. Donogue, R. L. Miller, M. S. Perzanowski, A. C. Just, L. A. Hoepner, S. Arunajadai, S. Canfield, D. Res- nick, A. M. Calafat, F. P. Perera and R. M. Whyatt, “Pre- natal and Postnatal Bisphenol A Exposure and Asthma Development Among Inner-City Children,” The Journal of Allergy and Clinical Immunology, Vol. 131, No. 3, 2013, pp. 736-742. doi:10.1016/j.jaci.2012.12.1573 [7] J.-Y. Youn, H.-Y. Park, J.-W. Lee, I.-O. Jun, K.-H. Choi, K. Kim and K.-H. Cho, “Evaluation of the Immune Re- sponse Following Exposure of Mice to Bisphenol A: In- duction of Th1 Cytokine and Prolactin by BPA Exposure in the Mouse Spleen Cells,” Archives of Pharmacal Re- search, Vol. 25, No. 6, 2002, pp. 946-953. doi:10.1007/BF02977018 Copyright © 2013 SciRes. PP  Impact of Bisphenol A (BPA) and Free Fatty Acids (FFA) on Th2 Cytokine Secretion from INS-1 Cells 459 [8] L. Trasande, T. M. Attina and J. Blustein, “Association between Urinary Bisphenol A Concentration and Obesity Prevalence in Children and Adolescents,” The Journal of American Medical Association, Vol. 308, No. 11, 2012, pp. 1113-1121. doi:10.1001/2012.jama.11461 [9] L. Lynch, M. Nowak, B. Varghese, J. Clark, A. E. Hogan, V. Toxavidis, S. P. Balk, D. O´Shea, C. O´Farrelly and M. A. Exley, “Adipose Tissue Invariant NKT Cells Protect against Diet-Induced Obesity and Metabolic Disorder through Regulatory Cytokine Production,” Immunity, Vol. 37, No. 3, 2012, pp. 574-587. doi:10.1016/j.immuni.2012.06.016 [10] S. J. Miyagi and A. C. Collier, “Pediatric Development of Glucuronidation: The Ontogeny of Hepatic UGT1A4,” Drug Metabolism Dispossition, Vol. 35, No. 9, 2007, pp. 1587-1592. doi:10.1124/dmd.107.015214 [11] W. Dekant and W. Völkel, “Human Exposure to Bisphe- nol A by Biomonitoring: Methods, Results and Assess- ment of Environmental Exposures,” Toxicology and Ap- plied Pharmacology, Vol. 228, No. 1, 2008, pp. 114-134. doi:10.1016/j.taap.2007.12.008 [12] A. Calafat, “BPA Biomonitoring and Biomarker Studies,” FAO/WHO Expert Meeting on Bisphenol A (BPA), Ge- neva, 2-5 November 2010. [13] A. M. Calafat, J. Weuve, X. Ye, L. T. Jia, H. Hu, S. Ringer, K. Huttner, R. Hauser, et al., “Exposure to Bis- phenol A and Other Phenols in Neonatal Intensive Care Unit Premature Infants,” Environmental Health Perspec- tives, Vol. 117, No. 4, 2009, pp. 639-644. [14] K. Becker, T. Goen, M. Seiwert, A. Conrad, H. Pick-Fuss, J. Muller, M. Wittassek, C. Schulz and M. Kolossa-Ge- hring, “GerES IV: Phthalate Metabolites and Bisphenol A in Urine of German Children,” International Journal of Hygiene and Environmental Health, Vol. 212, No. 6, 2009, pp. 685-692. doi:10.1016/j.ijheh.2009.08.002 [15] R. W. Snyder, et al., “Metabolism and Disposition of Bisphenol A in Female Rats,” Toxicology and Applied Pharmacology, Vol. 168, No. 3, 2000, pp. 225-234. doi:10.1006/taap.2000.9051 [16] H. Mielke and U. Gundert-Remy, “Bisphenol A Levels in Blood Depend on Age and Exposure,” Toxicology Letters, Vol. 190, No. 1, 2009, pp. 32-40. doi:10.1016/j.toxlet.2009.06.861 [17] P. Stolba, M. Kvapil, D. Wichterle and P. Dvorák, “Kine- tics of Free Fatty Acids in Hypertriglyceridemia. Eviden- ce for Different Types of Insulin Resistance,” Annals of the New York Academy of Sciences, Vol. 683, No. 3, 1993, pp. 373-374. doi:10.1111/j.1749-6632.1993.tb35738.x [18] M. Zeyda, J. Huber, G. Prager and T. M. Stulnig, “In- flammation Correlates with Markers of T-Cell Subsets Including Regulatory T Cells in Adipose Tissue from Obese Patients,” Obesity, Vol. 19, No. 4, 2011, pp. 743- 748. doi:10.1038/oby.2010.123 [19] M. Igoillo-Esteve, L. Marselli, D. A. Cunha, L. Ladrière, F. Ortis, F. A. Grieco, F. Dotta, G. C. Weir, P. Marchetti, D. L. Eizirik and M. Cnop, “Palmitate Induces a Pro-In- flammatory Response in Human Pancreatic Islets that Mimics CCL2 Expression by Beta Cells in Type 2 Dia- betes,” Diabetologia, Vol. 53, No. 7, 2010, pp. 1395- 1405. doi:10.1007/s00125-010-1707-y [20] G. Boden, “Interaction between Free Fatty Acids and Glucose Metabolism,” Current Opinion in Clinical Nutri- tion and Metabolic Care, Vol. 5, No. 5, 2002, pp. 545- 549. doi:10.1097/00075197-200209000-00014 [21] G. Boden, P. She, M. Mozzoli, P. Cheung, K. Gumireddy, P. Reddy, X. Xiang, Z. Luo and N. Ruderman, “Free Fat- ty Acids Produce Insulin Resistance and Activate the Pro- inflammatory Nuclear Factor-κB Pathway in Rat Liver,” Diabetes, Vol. 54, No. 12, 2005, pp. 3458-3465. doi:10.2337/diabetes.54.12.3458 [22] B. M. Burgering and P. J. Coffer, “Protein Kinase B (c-Akt) in Phosphatidylinositol-3-OH Kinase Signal Trans- duction,” Nature, Vol. 376, No. 6541, 1995, pp. 599-602. doi:10.1038/376599a0 [23] R. Meshkani and K. Adeli, “Hepatic Insulin Resistance, Metabolic Syndrome and Cardiovascular Disease,” Cli- nical Biochemistry, Vol. 42, No. 13-14, 2009, pp. 1331- 1346. doi:10.1016/j.clinbiochem.2009.05.018 [24] D. Janjic and M. Asfari, “Effects of Cytokines on Rat Insulinoma INS-1 Cells,” Journal of Endocrinology, Vol. 132, 1992, pp. 67-76. doi:10.1677/joe.0.1320067 [25] M. Cnop, N. Welsh, J.-C. Jonas, A. Jörns, S. Lenzen and D. L. Eizirik, “Mechanism of Pancreatic β-Cell Death in Type 1 and Type 2 Diabetes. Many Differences, Few Similarities,” Diabetes, Vol. 54, Suppl. 2, 2005, pp. S97- S107. doi:10.2337/diabetes.54.suppl_2.S97 [26] K. Mädler, G. Dharmadhikari, D. M. Schumann and J. Storling, “Interleukin-Targeted Therapy for Metabolic Syndrome and Type 2 Diabetes,” Handbook of Experi- mental Pharmacology, Vol. 203, 2011, pp. 257-278. [27] T. Adachi, K. Yasuda, C. Mori, M. Yoshinaga, N. Aoki, G. Tsujimoto and K. Tsuda, “Promoting Insulin Secretion in Pancreatic Islets by Means of Bisphenol A and Nonyl- phenol via Intracellular Estrogen Receptors,” Food and Chemical Toxicology, Vol. 43, No. 5, 2005, pp. 713-719. doi:10.1016/j.fct.2005.01.009 [28] H. Liang, Z. Wang and L. Gan, “Effect of Estrogen on Pancreatic β Cells,” Yixue Fenzi Shengwuxue Zazhi, Vol. 5, No. 23, 2008, pp. 535-538. [29] J. S. Rosa, S. Heydari, S. R. Oliver, R. L. Flores, A. M. Pontello, M. Ibardolaza and P. R. Galassetti, “Inflam- matory Cytokine Profiles during Exercise in Obese, Dia- betic, and Healthy Children,” Journal of Clinical Re- search in Pediatric Endocrinology, Vol. 3, No. 3, 2011, pp. 115-121. doi:10.4274/jcrpe.v3i3.23 [30] Q. S. Mi, D. Ly, P. Zucker, M. McGarry and T. L. Delovitch, “Interleukin-4 But not Interleukin-10 Protects against Spontaneous and Recurrent Type 1 Diabetes by Activated CD1d-Restricted Invariant Natural Killer T- Cells,” Diabetes, Vol. 53, No. 5, 2004, pp. 1303-1310. doi:10.2337/diabetes.53.5.1303 [31] G. Targher, L. Zenari, L. Bertolini, M. Muggeo and G. Zoppini, “Elevated Levels of Interleukin-6 in Young Adults with Type 1 Diabetes without Clinical Evidence of Microvascular and Macrovascular Complications,” Dia- betes Care, Vol. 24, No. 5, 2001, pp. 956-957. doi:10.2337/diacare.24.5.956 Copyright © 2013 SciRes. PP  Impact of Bisphenol A (BPA) and Free Fatty Acids (FFA) on Th2 Cytokine Secretion from INS-1 Cells Copyright © 2013 SciRes. PP 460 [32] J. K. Snell-Bergeon, N. A. West, E. J. Mayer-Davis, A. D. Liese, S. M. Marcovina, R. B. D`Agostino, R. F. Ham- man and D. Dabelea, “Inflammatory Markers Are In- creased in Youth with Type 1 Diabetes: The SEARCH Case-Control Study,” Journal of Endocrinology and Me- tabolism, Vol. 95, No. 6, 2010, pp. 2868-2876. doi:10.1210/jc.2009-1993 [33] J. Yang, Y. Wang, Y. Gao, J. Shao, X. J. Zhang and Z. Yao, “Reciprocal Regulation of 17β-Estradiol, Interleu- kin-6 and Interleukin-8 during Growth and Progression of Epithel Ovarian Cancer,” Cytokine, Vol. 46, No. 3, 2009, pp. 382-391. doi:10.1016/j.cyto.2009.03.013 [34] A. Oberbach, N. Schlichting, M. Blüher, P. Kovacs, H. Till, J. U. Stolzenburg and J. Neuhaus, “Palmitate In- duced IL-6 and MCP-1 Expression in Human Bladder Smooth Muscle Cells Provides a Link between Diabetes and Urinary Tract Infections,” PLoS ONE, Vol. 5, No. 5, 2010, Article ID: e10882. [35] C. Weigert, K. Brodbeck, H. Staiger, C. Kausch, F. Ma- chicao, H. U. Häring and E. D. Schleicher, “Palmitate, but not Unsaturated Fatty Acids, Induces the Expression of Interleukin-6 in Human Myotubes Through Proteasome- Dependent Activation of Nuclear Factor-kappaB,” Jour- nal of Biological Chemistry, Vol. 279, No. 23, 2004, pp. 23942-23952. doi:10.1074/jbc.M312692200 [36] J. Saraiva, E. Sola, D. Prieto and M. J. Antunes, “Diabe- tes as an Outcome Predictor after Heart Transplantation,” Interactive Cardiovasc Thoracic Surgery, Vol. 13, No. 5, 2011, pp. 499-504. doi:10.1510/icvts.2010.256321 [37] N. C. Schloot, P. Hanifi-Mogghaddam, C. Goebel, S. V. Shatavi, S. Flohé, H. Kolb, H. Rothe, “Serum IFN- Gamma and IL-10 Levels Are Associated with Disease Pro-gression in Non-Obese Diabetic Mice,” Diabetes/ Metabolism Research and Reviews, Vol. 18, No. 1, 2002, pp. 64-70. doi:10.1002/dmrr.256 [38] K. Saegusa, S. Yotsumoto, S. Kato and Y. Aramaki, “Phosphatidylinositol 3-Kinase-Mediated Regulation of IL-10 and IL-12 Production in Macrophages Stimulated with CpG Oligodeoxynucleotide,” Molecular Immuno- logy, Vol. 44, No. 6, 2007, pp. 1323-1330. doi:10.1016/j.molimm.2006.05.008 [39] A. Strom, B. Menart, M.-C. Simon, M. N. Pham, H. Kolb, M. Roden, P. Pozzilli, R. D. G. Leslie and N. C. Schloot, “Cellular Interferon-Gamma and Interleukin-13 Immune Reactivity in Type 1, Type 2 and Latent Autoimmune Diabetes: Action LADA 6,” Cytokine, Vol. 58, No. 2, 2012, pp. 148-151. doi:10.1016/j.cyto.2012.01.002 [40] J. Honkanen, J. K. Nieminen, R. Gao, K. Luopajarvi, H. M. Salo, J. Ilonen, M. Knip, T. Otonkosi and O. Vaarala, “IL-17 Immunity in Human Type 1 Diabetes,” Journal of Immunology, Vol. 185, No. 3, 2010, pp. 1959-1967. doi:10.4049/jimmunol.1000788 [41] G.-S. Jeong and D.-S. Lee, “Sauchinone Protects Pancre- atic β-Cells against Cytokine-Mediated Toxicity,” Toxi- cology in Vitro, Vol. 25, No. 2, 2011, pp. 505-512. doi:10.1016/j.tiv.2010.12.004 [42] K. Takeda, T. Tanaka, W. Shi, M. Matsumoto, M. Mi- nami, S. Kashiwamura, K. Nakanishi, N. Yoshida, T. Ki- shimoto and S. Akira, “Essential Role of Stat6 in IL-4 Signalling,” Nature , Vol. 380, No. 6575, 1996, pp. 627- 630. doi:10.1038/380627a0 [43] T. Andus, T. Geiger, T. Hirano, T. Kishimoto, T.-A. Tran-Thi, K. Decker and P. C. Heinrich, “Regulation of Synthesis and Secretion of Major Rat Acute-Phase Pro- teins by Recombinant Human Interleukin-6 (BSF-2/IL-6) in Hepatocyte Primary Cultures,” European Journal of Biochemistry, Vol. 173, No. 2, 1988, pp. 287-293. doi:10.1111/j.1432-1033.1988.tb13997.x [44] J. G. Bode and P. C. Heinrich, “Interleukin-6 Signaling during the Acute-Phase Response of the Liver,” In: I. Arias, A. Wolkoff, J. Boyer, D. Shafritz, N. Fausto, H. Alter and D. Cohen, Eds., The Liver: Biology and Patho- biology, 4th Edition, Lippincott Williams Wilkins, Phila- delphia, 2001, pp. 565-580. [45] W. Völkel, N. Bittner and W. Dekant, “Quantitation of Bisphenol A and Bisphenol A Glucuronide in Biological Samples by High Performance Liquid Chromatogra- phy-Tandem Mass Spectrometry,” Drug Metabolism and Disposition, Vol. 39, No. 11, 2005, pp. 1748-1757. doi:10.1124/dmd.105.005454
|