Influence of Date of Transplanting on Growth and Yield Attributes and Resultant Seed Quality of Davana
1722
dul Baki and Anderson, 1873). Vigour index (VI) was
computed using the following formula and expressed as
whole number. VI = Germination percentage × Seedling
length (cm) and Dry matter production (g·seedlings−10)
dried in a hot air oven maintained at 85˚C for 48 h and
cooled in a dessicator for 30 min and weighed in an elec-
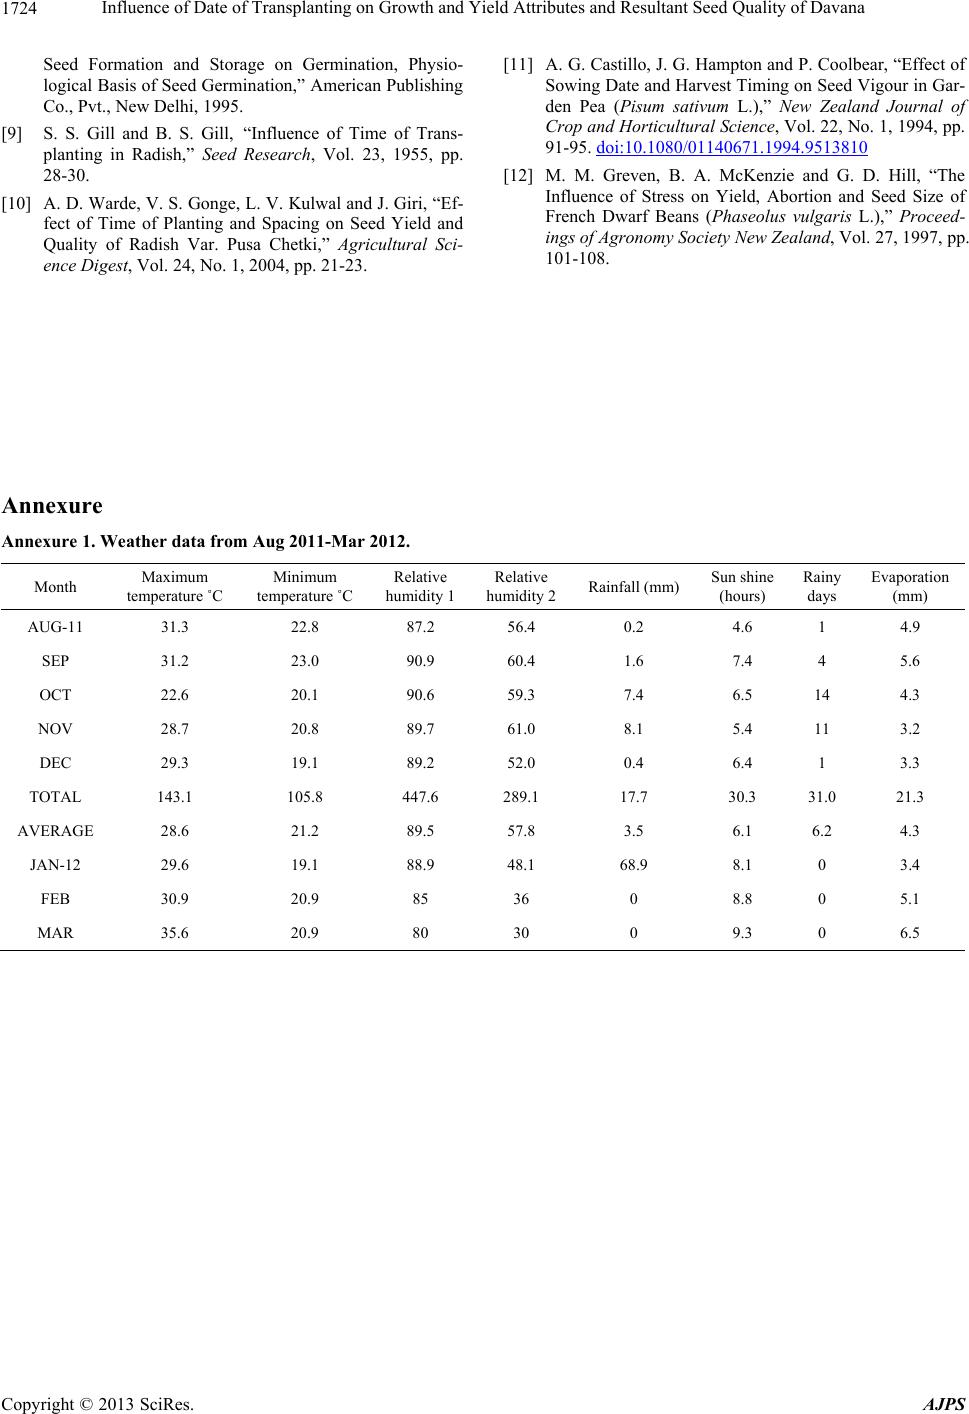
tronic digital balance. Weather data given as Annexure
1.
2.2. Statistical Analysis
The data obtained from experiments were analyzed by
the ‘F’ test for significance following the method Facto-
rial Randomized Block Design as described by [5] Panse
and Sukhatme. 1985. Wherever necessary, the percent
values were transformed to angular (Arc-sine) values be-
fore analysis. The critical differences (CD) were calcu-
lated at 5 per cent probability level. The data were tested
for statistical significance.
3. Results and Discussion
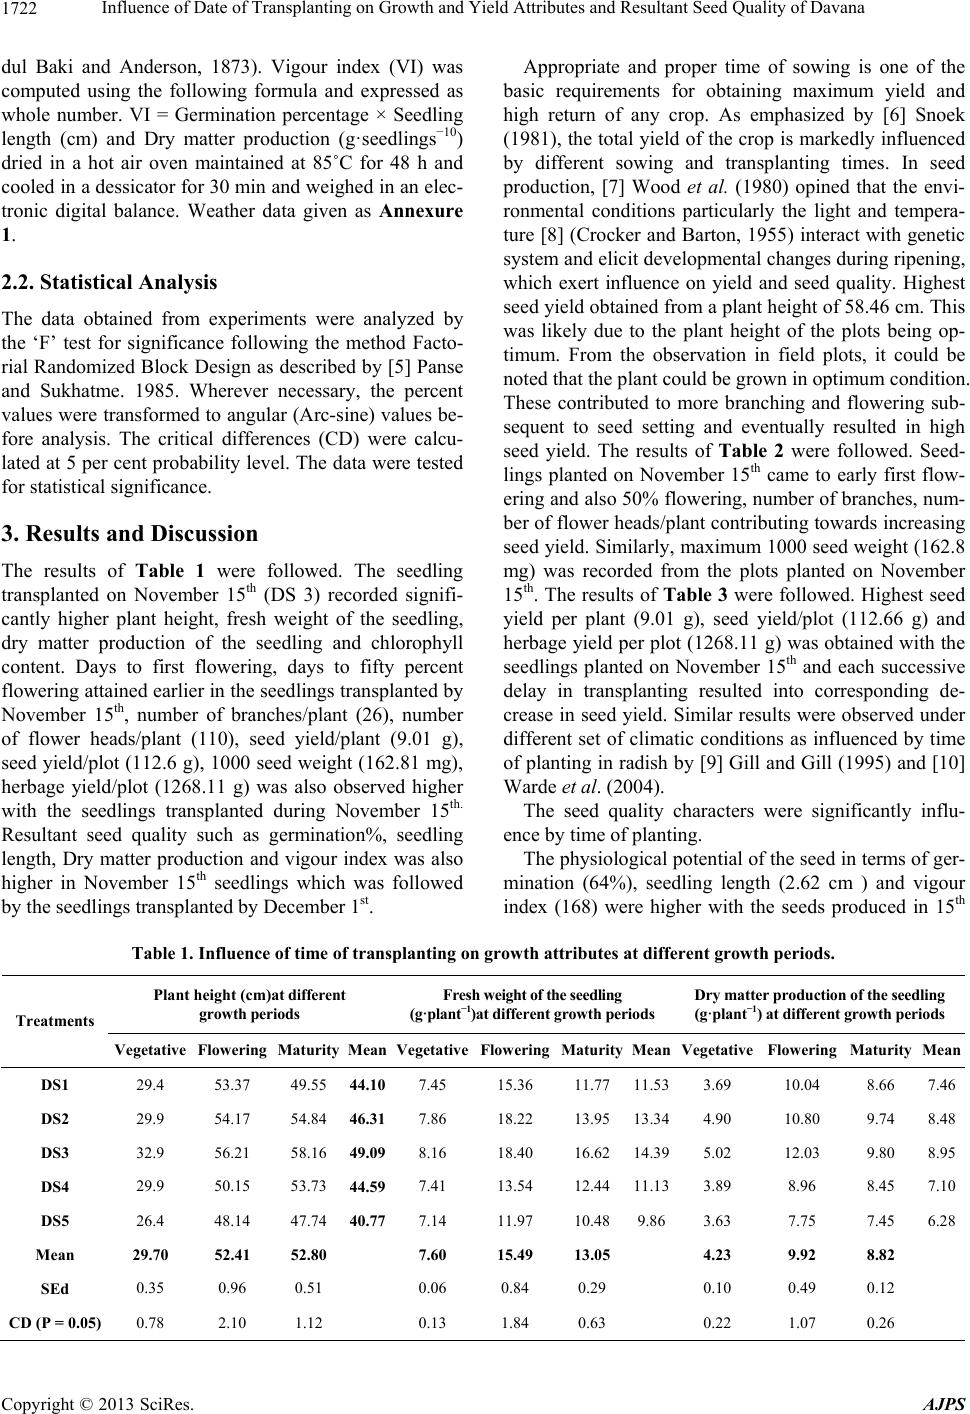
The results of Table 1 were followed. The seedling
transplanted on November 15th (DS 3) recorded signifi-
cantly higher plant height, fresh weight of the seedling,
dry matter production of the seedling and chlorophyll
content. Days to first flowering, days to fifty percent
flowering attained earlier in the seedlings transplanted by
November 15th, number of branches/plant (26), number
of flower heads/plant (110), seed yield/plant (9.01 g),
seed yield/plot (112.6 g), 1000 seed weight (162.81 mg),
herbage yield/plot (1268.11 g) was also observed higher
with the seedlings transplanted during November 15th.
Resultant seed quality such as germination%, seedling
length, Dry matter production and vigour index was also
higher in November 15th seedlings which was followed
by the seedlings transplanted by December 1st.
Appropriate and proper time of sowing is one of the
basic requirements for obtaining maximum yield and
high return of any crop. As emphasized by [6] Snoek
(1981), the total yield of the crop is markedly influenced
by different sowing and transplanting times. In seed
production, [7] Wood et al. (1980) opined that the envi-
ronmental conditions particularly the light and tempera-
ture [8] (Crocker and Barton, 1955) interact with genetic
system and elicit developmental changes during ripening,
which exert influence on yield and seed quality. Highest
seed yield obtained from a plant height of 58.46 cm. This
was likely due to the plant height of the plots being op-
timum. From the observation in field plots, it could be
noted that the plant could be grown in optimum condition.
These contributed to more branching and flowering sub-
sequent to seed setting and eventually resulted in high
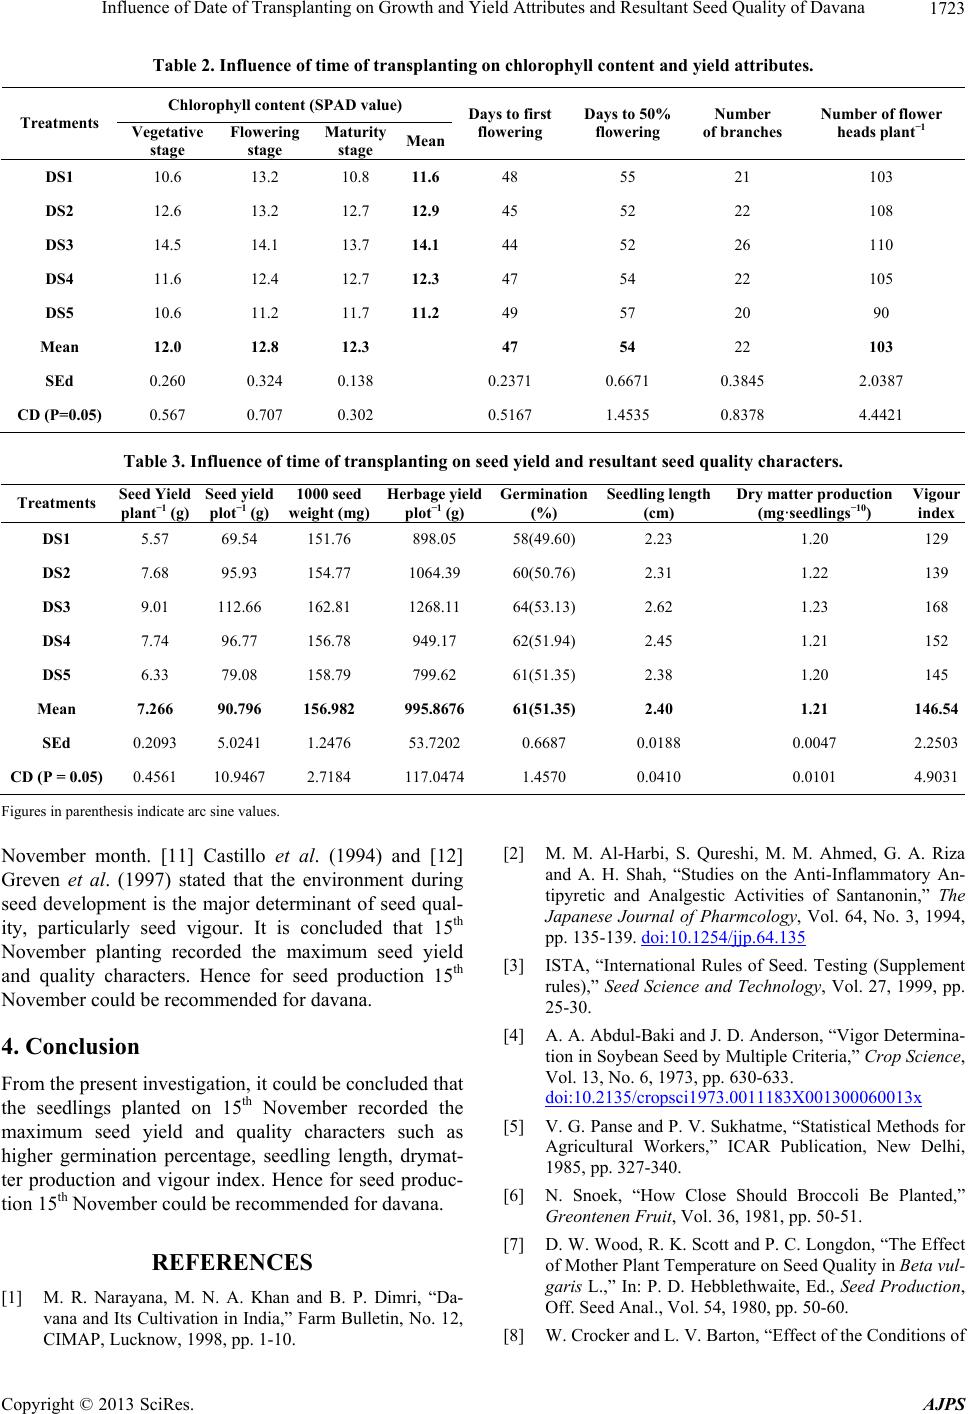
seed yield. The results of Table 2 were followed. Seed-
lings planted on November 15th came to early first flow-
ering and also 50% flowering, number of branches, num-
ber of flower heads/plant contributing towards increasing
seed yield. Similarly, maximum 1000 seed weight (162.8
mg) was recorded from the plots planted on November
15th. The results of Table 3 were followed. Highest seed
yield per plant (9.01 g), seed yield/plot (112.66 g) and
herbage yield per plot (1268.11 g) was obtained with the
seedlings planted on November 15th and each successive
delay in transplanting resulted into corresponding de-
crease in seed yield. Similar results were observed under
different set of climatic conditions as influenced by time
of planting in radish by [9] Gill and Gill (1995) and [10]
Warde et al. (2004).
The seed quality characters were significantly influ-
ence by time of planting.
The physiological potential of the seed in terms of ger-
mination (64%), seedling length (2.62 cm ) and vigour
index (168) were higher with the seeds produced in 15th
Table 1. Influence of time of transplanting on growth attributes at different growth periods.
Plant height (cm)at different
growth periods
Fresh weight of the seedling
(g·plant−1)at different growth periods
Dry matter production of the seedling
(g·plant−1) at different growth periods
Treatments
Vegetative Flowering Maturity MeanVegetativeFloweringMaturityMeanVegetative Flowering MaturityMean
DS1 29.4 53.37 49.55
44.10 7.45 15.36 11.77 11.533.69 10.04 8.66 7.46
DS2 29.9 54.17 54.84
46.31 7.86 18.22 13.95 13.344.90 10.80 9.74 8.48
DS3 32.9 56.21 58.16
49.09 8.16 18.40 16.62 14.395.02 12.03 9.80 8.95
DS4 29.9 50.15 53.73
44.59 7.41 13.54 12.44 11.133.89 8.96 8.45 7.10
DS5 26.4 48.14 47.74
40.77 7.14 11.97 10.48 9.863.63 7.75 7.45 6.28
Mean 29.70 52.41 52.80 7.60 15.49 13.05
4.23 9.92 8.82
SEd 0.35 0.96 0.51 0.06 0.84 0.29 0.10 0.49 0.12
CD (P = 0.05) 0.78 2.10 1.12 0.13 1.84 0.63 0.22 1.07 0.26
Copyright © 2013 SciRes. AJPS