Health
Vol.5 No.12(2013), Article ID:41461,9 pages DOI:10.4236/health.2013.512297
Can public report cards affect consumer’s private learning of quality? An evaluation of the impact of Florida hospital report cards on acute myocardial infarction patient admission patterns
![]()
1Sol Price School of Public Policy, Schaeffer Center for Health Policy and Economics, University of Southern California, Los Angeles, USA; *Corresponding Author: vivianwu@usc.edu
2Palo Alto Research Center, Palo Alto, USA; liup04@gmail.com
Copyright © 2013 Vivian Y. Wu, Pai Liu. This is an open access article distributed under the Creative Commons Attribution License, which permits unrestricted use, distribution, and reproduction in any medium, provided the original work is properly cited.
Received 9 November 2013; revised 15 December 2013; accepted 21 December 2013
Keywords: Hospital Report Cards; Hospital Admission Pattern; Private Learning
ABSTRACT
The empirical literature on hospital report cards typically assumes that report card cannot interact with consumer’s private learning. This study examines the impact of the implementation of FL hospital quality reporting system in late 2004 on hospital admission patterns using a pre-post difference-in-difference design. The estimation model allows for the possibility that report-card learning may interact with non-report-card learning. The study sample is comprised of all patients admitted to any FL hospital between 2000 and 2008 with a principal diagnosis of acute myocardial infarction (AMI). We find that hospital admission patterns for AMI patients did not respond to report card information. However, we find evidence consistent with the possibility that the implementation of a report card system may stimulate consumers (either patients or physicians) to seek higher quality hospitals through private information channels.
1. INTRODUCTION
For more than two decades, there have been interests to provide comparative provider quality information to consumers to aid consumer choices based on quality of care. To date, the US federal government, more than 30 states, and many private organizations have initiated some forms of report cards that publicly disclose selected financial, process, volume, and outcomes data on health plans, hospitals, and physicians. In principle, report cards can improve market performance in two ways. First, report cards can generate patient (demand) responses, by bringing critical information to patients to identify and switch to high quality providers. Assuming that patients would “vote with their feet,” providers are incentivized to improve quality in order to subsequently attract higher demand. The second mechanism is provider responses. Even when there are no demand responses, report cards may still generate incentives for providers to improve quality if providers care about their performance relative to the peers [1].
Empirically, there is a large volume of literature examining the effect of releasing provider report cards on patient volume or provider choices. The main challenge of the literature is that most studies did not distinguish between consumer’s learning from report cards and that from non-report-card mechanisms that would occur independently of report cards [2-4]. While many other studies did either control for the effect of private learning or estimate the magnitude of it [5-12], the main issue with this set of studies is that they commonly assume that consumer learning from public report cards is independent of that from private channels, which may be not plausible.
This study focuses on testing whether report cards may interact with consumer’s private learning of quality, instead of assuming that they are independent from each other. Conceptually, it is unclear in which direction private learning should be affected by the release of report cards. For example, report cards may decrease the effectiveness of private learning, if report cards provide information that people would otherwise have to rely on private channels prior to the release of report cards. Assuming that public information is less costly, report cards thus may substitute away the need and usefulness of private information. On the other hand, report cards may increase private learning of provider quality. For example, the publicity that came with the implementation of report cards can increase public awareness and demand for provider quality. If the demand for quality increases, while critical information is not completely released on the report cards, consumers may turn to seek more information from private channels, or doctors may be pressured to better respond to quality in their referral decisions. This will result in an increase in the effect of private quality information on provider choice. Lastly, it is still possible that report cards may have no effect on private learning, if report cards simply do not affect consumer knowledge or behavior in any dimension. In any case, it would be problematic to assume the private learning is unaffected by report cards without testing it directly.
Our study addresses this gap in the literature by examining, specifically, whether consumer learning of hospital quality may be substituted away or enhanced by the release of report cards in the hospital setting. In this study, we term the learning of all possible channels other than the information from report cards as “non-reportcard learning”. To our knowledge, only one existing study, while not its main focus, allows non-report-card learning to interact with report card learning in the fertility clinic setting [13]. In that study, the 2 quality measures for quality, reported and non-reported, were highly correlated at 0.59, because one is the 3-year lag of another, and thus the estimates may not be stable. We improve the prior study by using 2 different quality measures to better separate out report-card vs non-report-card learning and testing them explicitly in a different hospital setting. The second contribution of our study is that we analyze the effect of report cards on physicians’ admission patterns. Taking advantage of the study data that allow us to track the same physician over time, we examine how a physician’s referral pattern across hospitals changes before and after the release of report cards using a difference-in-difference estimate at the physician level. Lastly, we analyze the effect of an aggregated 3-category quality ranking, rather than detailed numeric quality measures. The prior reporting method is of particular importance, as many states and the Center of Medicare and Medicaid Services that adopted hospital report cards use the 3-category reporting—“better than expected/above average,” “as expected/same as the average,” and “worse than expected/below average”. It is unclear whether the highly simplified information is useful to patients and there are relatively less empirical studies testing the effect of the simplified reporting.
2. METHODS
The study uses a pre-post difference-in-difference model to estimate separate effect of quality information on physician admission patterns using the unique information contained in the FL report card system. The state of Florida passed the Affordable Health Care for Floridians Act in 2004, requiring the Agency for Health Care Administration (AHCA) to “offer information about health care services, costs, and quality of care, including hospitals, nursing homes, ambulatory surgery centers, pharmaceuticals, health plans and physicians”. Beginning in November of 2004, the agency launched a new website, FloridaCompareCare.gov, to publish the cost and process indicators for over 150 medical conditions, surgeries, and procedures. For hospitals, the data also includes infection/complication rates and mortality rates for several common diseases/conditions. The implementation of the reporting system was a major undertaking at the AHCA with widely disseminated publicity.
The critical information that enables the present study is 2 distinct hospital quality measures available in the system: one aggregated 3-catogory quality ranking that was made available to public by report cards, and another detailed hospital-level actual risk-adjusted quality score that was never disclosed to the consumers but available to researchers before and after the report cards. This unique information allows us not only to use the reported quality ranking to estimate demand responses due to report cards, but also to control and estimate the change in demand response to non-report-card learning as a result of report cards.
The empirical difference-in-difference model is specified as in the following:
 (1)
(1)
2.1. Dependent Variable
We use the percent distribution of a physician’s AMI patients across hospitals to describe a physician’s admission pattern. In other words, the dependent variable measures the percent AMI patients coming from a physician at a hospital in a given year. For example, if a physician has a total of 50 AMI patients in a year, and sends 20 patients to Hospital A and 30 to Hospital B. The dependent variable will record 40% for Hospital A and 60% for Hospital B for this particular physician. We use the percentage term instead of the absolute number of cases to adjust for the scale differences between physicians, and within a physician over time (which can be changing at different rates). Analyzing volumes at the physician-hospital level provides another advantage that the well-known volume-outcome endogeneity will be less of a concern at the physician-hospital level. Higher hospital quality may attract physicians to send more patients to that hospital, but a single physician’s volume at a hospital is less likely to be large enough to drive a hospital’s overall quality outcomes (with few extremely highvolume exceptions).
2.2. Key Independent Variables
The key independent variables of interest are “better/ worse” and “risk-adjusted mortality”. “Better” is an indicator variable which takes on the value of 1 if a hospital was ranked as “better than expected” in the prior year’s report card, and “Worse” indicates those hospitals that ranked “worse than expected,” respectively. Coefficient α indicatesa change in hospital admissions to hospital h per physician p due to a change in hospital h’s ranking in the report card to be “better” than expected, and coefficient β measures the effect of a “worse” report card ranking. The reference group is hospitals whose AMI mortality rate was “as expected.” Each quarter beginning the third quarter of 2004, the Florida AHCA calculated a hospital’s expected risk-adjusted mortality rateusing the AHRQ’s IQI tools with FL hospital discharge data. It then ranked hospitals into three categories: 1) better than expected, if the actual mortality rate is lower than expected, 2) as expected, if the actual mortality rate is within the expected range, and 3) worse than expected, if the actual mortality rate is higher than expected, and disclose only the 3 categories in their public reporting. Hospitals with too few cases in the condition will not receive a ranking. We obtain the actual reported data (three categories) from the agency directly between 2004 (4th quarter) and 2008 yearly and these are entered as 1-year lag in the regressions to avoid volume-outcome endogeneity.
γ and r are the other 2 coefficients of interests. The variable “risk adjusted mortality” was the calculated but unreported hospital-specific risk-adjusted AMI mortality serving as a proxy of a hospital’s underlying quality. 2001-2004 was defined as the pre-report card period, and 2005-2008 as the post-report card period. Coefficient γ identifies the relationship between private knowledge of hospital quality (observable to consumers but unobservable to researchers) and admission patterns in the prereport card period, and coefficient r captures whether this relationship changed in the post report card period. The critical assumption is that because report cards never report the detailed, hospital-level quality score, any learning about the hospital-level quality has to come from non-report-card learning. We reproduce AMI risk-adjusted mortality rates using the same public-available AHRQ IQI tool1, because the Agency was unable to share their calculated risk-adjusted mortality rates. AMI risk-adjusted mortality rates were also entered as 1-year lag.
2.3. Control Variables
Distance is calculated by vincenty method, which calculates the distance between two points on the surface of a spheroid using zip codes. We included 2 distance measures. The first is the distance between the referring physician’s office to the hospital where an admission occurs, which measures the preference/convenience of the referring physician. The second measure is the conventional travel distance between a patient’s residence and the admitted hospital, which measures a patient’s willingness to travel. It is worth noting that we cannot decompose changes in travel distance as pure physician’s or patient’s response. Patients could be switching to physicians who are willing to admit them to desired hospitals, or changes could come from physicians redirecting patients to certain hospitals. In this study throughout we treat any observed volume change as the result of joint physicianpatient responses.
Control variables also include several sets of fixed effects (FE). It can be argued that some hospital factors not observed by the researchers may be observable to physicians/patients. For example, a physician can learn from experience the true productivity level of a hospital that is not directly observed by hospital characteristics. If this underlying productivity is correlated with patient outcomes, then the estimates on the effect of “better” or “worse” are biased. We use a stronger hospital FE specification that controls for all fixed hospital characters that may be correlated with the level or change in hospital quality. Lastly, year fixed effects are used to control for year-specific time trends that affect all hospitals/providers commonly.
We use three specifications for regression model. The first is the hospital fixed effects model as described above. In the second specification, we also include physician FE in addition to the hospital FE to control for specific time-invariant provider characteristics that may influence a physician’s choice of hospital. This specification uses the change in “better” or “worse” ranking to identify its effect on the change in physician level AMI volume. In the third and strongest specification, we replace hospital FE and physician FE with physician-hospital pair FE. The physician-hospital pair FE essentially removes all the possible confounding variations between hospitals for a given physician, and uses only withinphysician and within-hospital variation over time to identify the effect of a change in report card ranking on a physician’s admission to that hospital.
2.4. Alternative Model
To better understand the timing of the effect of report cards, we replace the post period dummy in the main regression model with year FE and interact the unreported AMI risk-adjusted mortality with year FE:
 (2)
(2)
where “RsikAdjusted Mortality” again are the calculated but unreported risk-adjusted AMI mortality of a hospital in the previous year, which is interacted with the year FE from year 2002 to 2008, where 2001 is the reference year. The set of coefficients γk will inform whether there is any systematic change between unobserved hospital quality and admission patterns over time, and how these changes may be correlated with the timing of the release of report cards. The regression model in Equation (2) is identical to the main model in Equation (1), except for the change of time period dummy in the interaction terms. We also used three specifications for Equation (2) as did for Equation (1)—one used hospital FE only, another used hospital FE and physician FE, and a third one used physician-hospital pair FE.
3. DATA
We obtain FL hospital discharge data from FL AHCA between 2000 and 2008. This data set contains the whole universe of inpatient discharges occurred during 2000 to 2008 at any hospital in FL. Data on hospital ranking as appeared on the report cards, starting from the fourth quarter of 2004 to the last quarter of 2008 was merged to the main discharge data, by 1-year lag. Hospital characteristics are obtained from the American Hospital Association Annual Surveys. Additional information on physician office address comes from Medical Quality Assurance Services of Florida Department of Health, and is linked to the master data by physician license number. Hospital-level risk-adjusted mortality rates are computed using the Agency for Healthcare Research and Quality (AHRQ) Inpatient Quality Indicators (IQI) tool, which is the tool FL AHCA uses to generate the 3-category of AMI mortality ranking (higher than expected, as expected, and lower than expected).
Overall, there are 336,142 AMI discharges occurring at about 200 hospitals between 2001 and 2008. We limit the study period to 2001 and 2008 due to the use of one-year lag variables. There may be concerns that some doctors may not routinely admit AMI patients, and thus whose admitting patterns can skew the estimates. Hence, we restrict the sample further to physicians who specialize in Internal Medicine, Family Medicine, or Cardiac Surgeons. This exclusion eliminates about 19% of the total hospital-year observations. In addition, AMI patients do not travel far. We exclude admissions that have long travel distances, measured as the distance between the zip code of admitted hospital or admitting physician’s office and patient’s home being greater than 50 miles or the admissions with any of zip code information missing. This drops out 20% observations. Furthermore, we exclude hospitals with less than 20 AMI cases per year and physicians who have only one-year records. These procedures together exclude another 2%. Our final sample includes 206,515 AMI admissions in 2001-2008 for the regression analysis.
4. RESULTS
Table 1 showed the descriptive statistics of the study sample. The number of AMI patients in FL was on a steady decline, from 27,370 in 2001 to 24,209 in 2008. Risk-adjusted mortality rates were declining as well. Interestingly, the number of physicians treating AMI patients also declined over time. The statistics in the last 2 columns indicated that the number of hospitals used by a physician declined from an average of 1.56 hospitals in 2001 to 1.36 hospitals in 2008, suggesting that physicians were narrowing their hospital referral network for AMI patients.
Table 2 reported the results using the main regression model in Equation (1) to examine the effect of report card information vs non-report-card information on a physician’s admission pattern. The first column controlled the hospital FE, the second column controlled the hospital FE and physician FE, and the third column controlled the physician-hospital pair FE. All the three columns have year FE. The results of the three columns reported a consistent finding. The coefficients of “better” and “worse” than expected mortality were not statistically significant, indicating that there was no direct effect of report card ranking on physicians’ admission patterns. The coefficients of “risk-adjusted mortality” in the prereport period, in years 2001-2004, were all positive and insignificant in Columns 1 and 3. In Column 2, there was
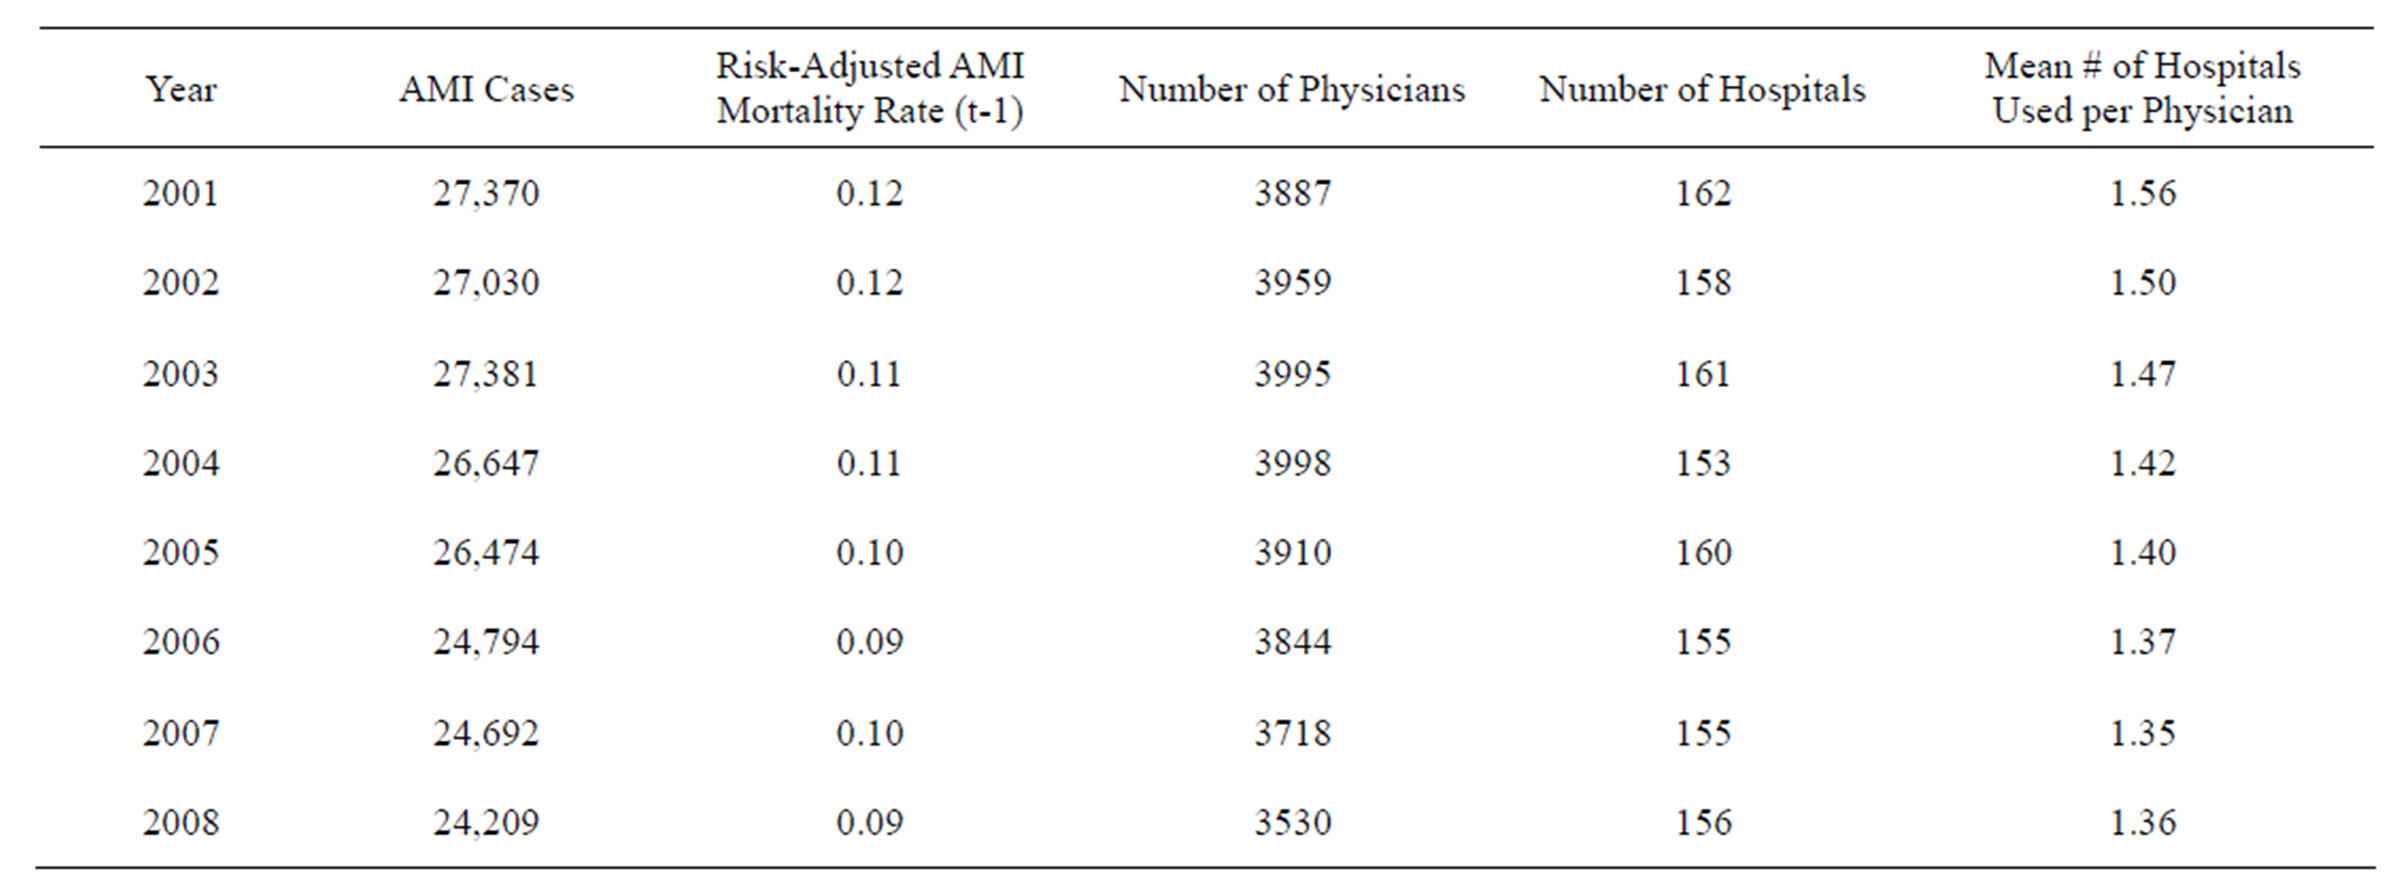
Table 1. Distribution and concentration of AMI patients across physicians and hospitals.
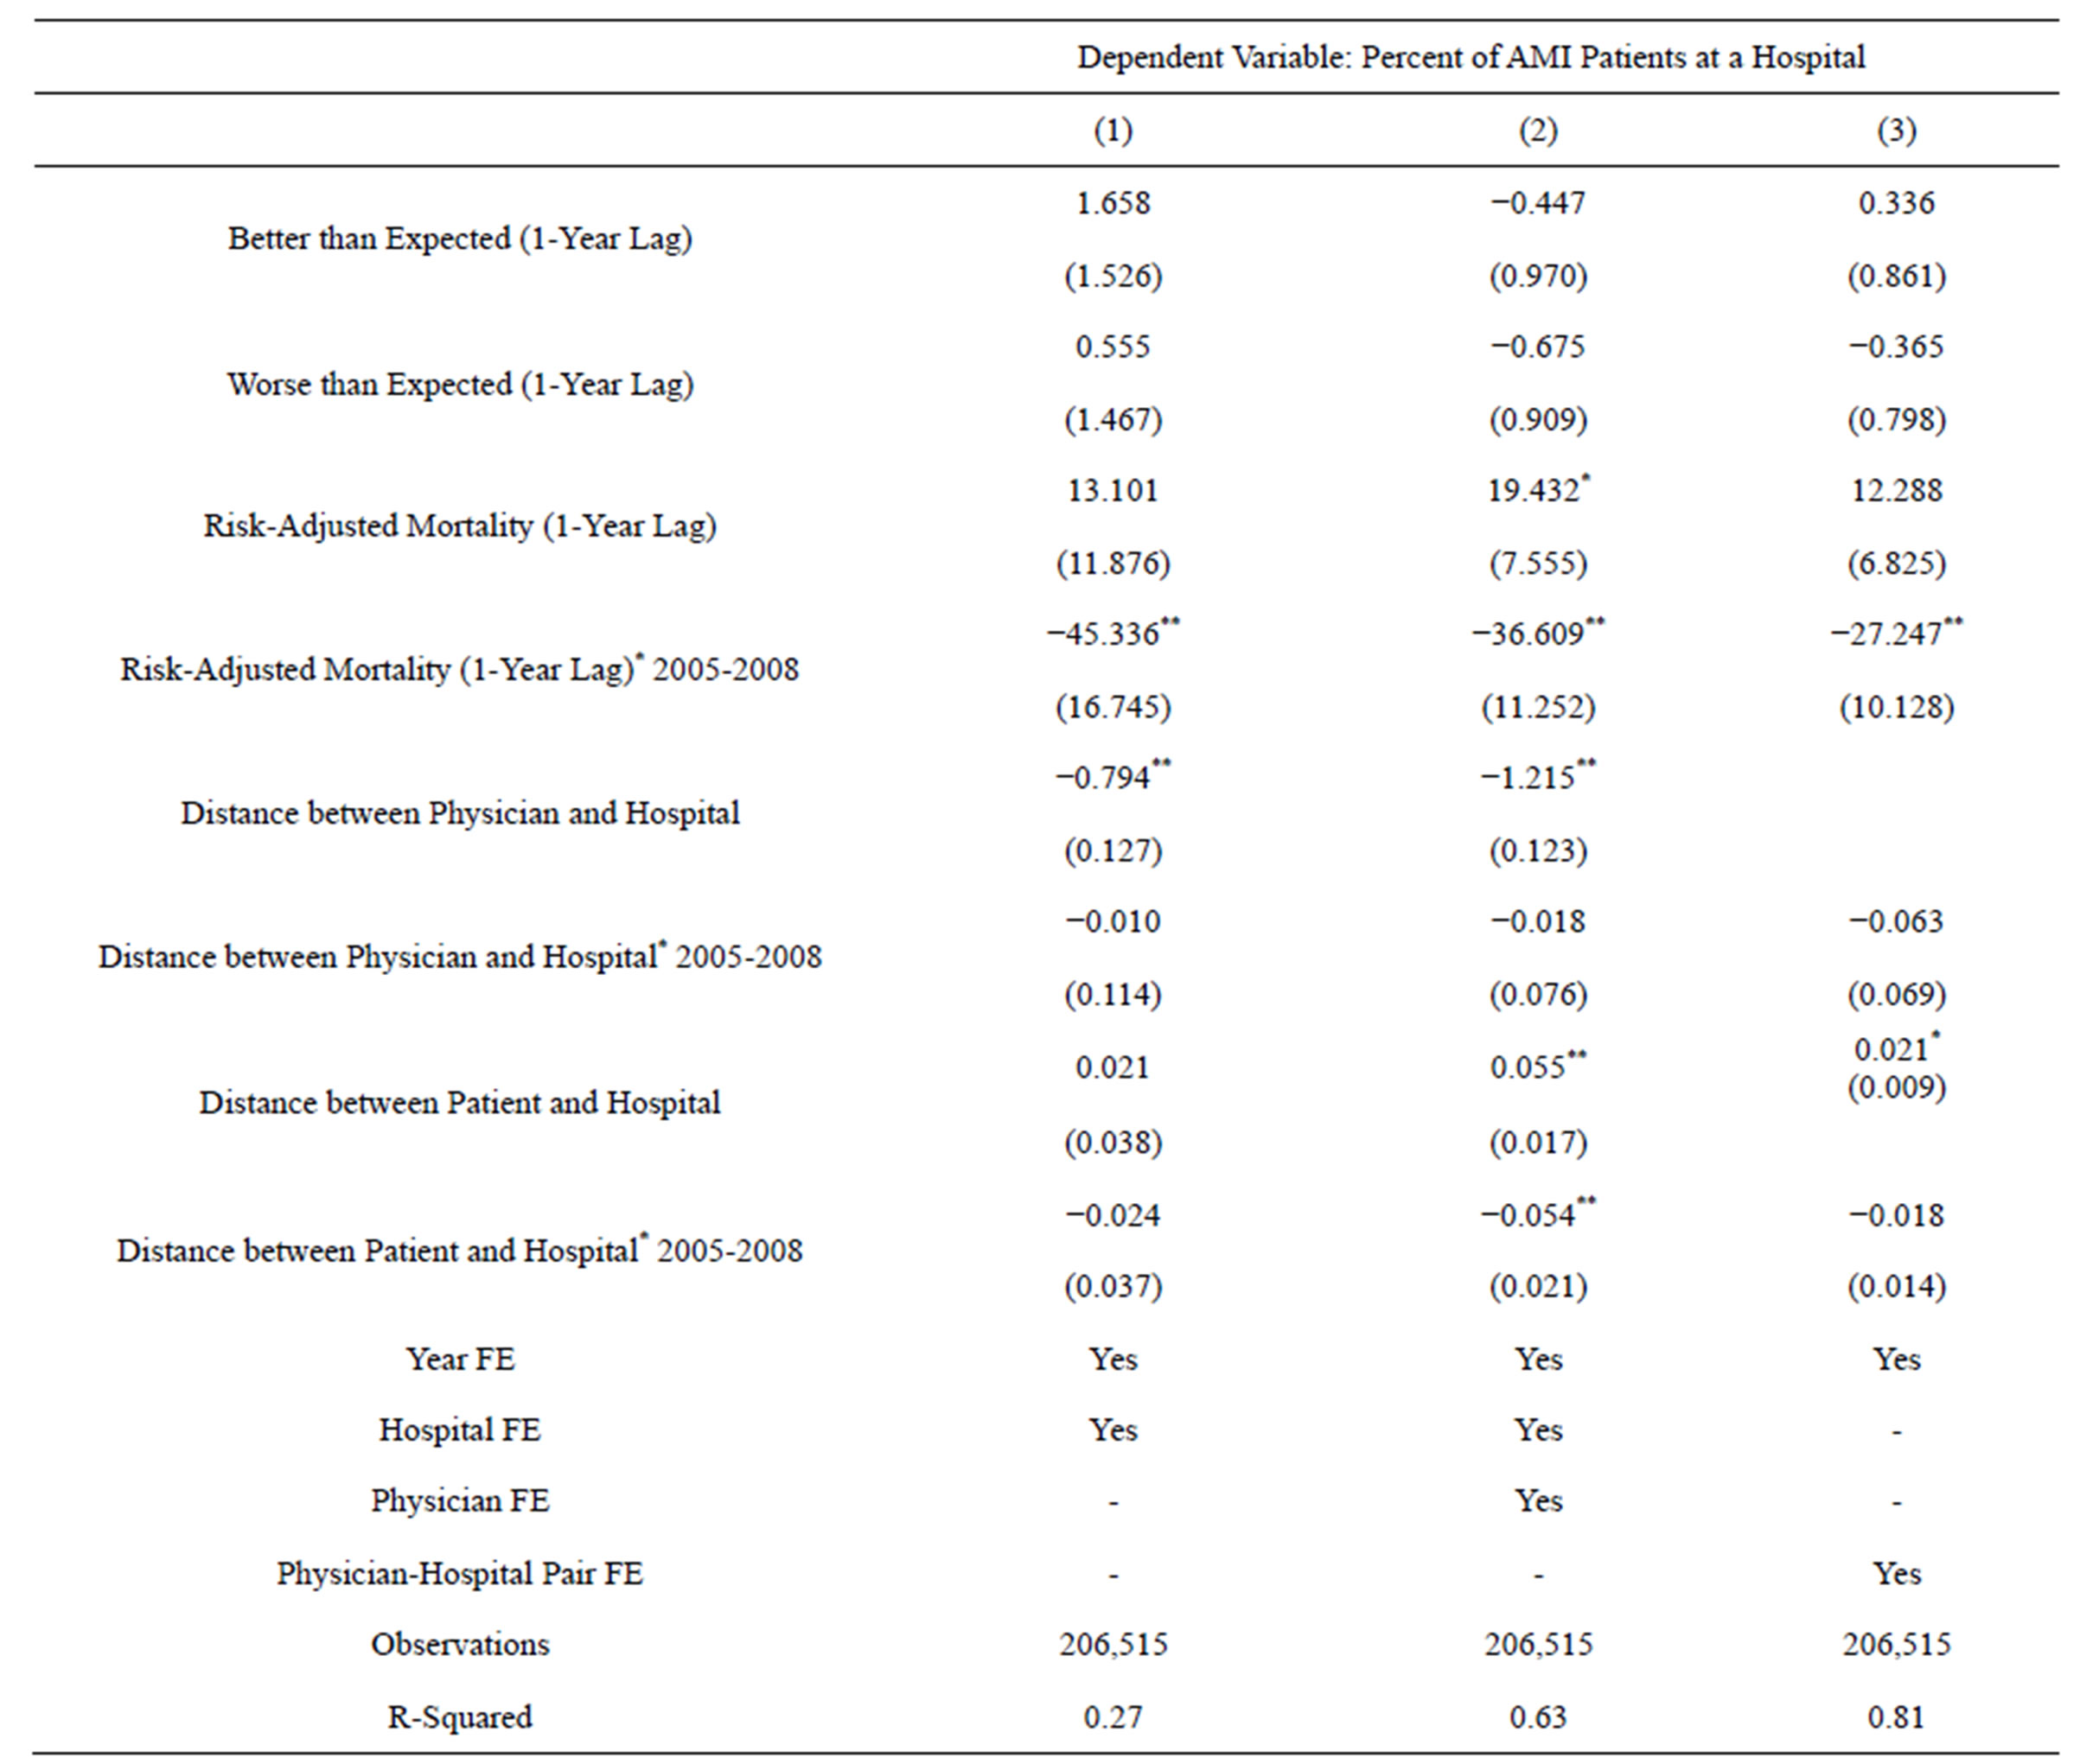
Table 2. Relationship between report card better/worse ranking and hospital admission patterns, 2001-2008.
Robust standard errors clustered at physician, hospital and physician-hospital pair level in each column respectively pair in parentheses. *Significant at 5%; **Significant at 1%.
evidence that hospitals with higher AMI mortality would actually had greater admissions from a physician. This relationship was reversed in the post report-card period when a physician’s referral patterns began to respond to quality. Specifically, in Column 1, 1 percentage point decrease in AMI risk-adjusted mortality in prior year lead to 45 percentage points increase in the percent of AMI admissions received from a physician. When we removed variation between physicians in Column 2 to identify the relationship using the variation from changes within a physician over time, the magnitude reduces to 36.6 percentage points. In Column 3, our preferred specification, where we removed all the variation between physician-hospital pairs, the magnitude further reduces to 27 percentage points but remained statistically significant. Overall, there results across the columns provided consistent evidence that, coincidental with the implementation of the FL report card, hospitals with higher quality began to be associated with more AMI admissions from physicians. Because the hospital-level detailed quality information could not have been learned from the report cards themselves, the change had to be coming from nonreport-card learning.
Table 3 presented the results of identical models as Table 2, except for that the unreported risk-adjusted mortality rates were interacted with a dummy variable for each year between 2002 and 2008, using the first year, 2001, as the reference year. The FE specifications for each column were the same as those in Table 2. Consistent with the results in Table 2, the coefficients of “better” and “worse” than expected mortality were still not significant. The coefficients of yearly risk-adjusted mortality rate further supported that report cards may have an effect on non-report-card learning. Before 2005 when the report cards were unavailable, the unreported risk-adjusted mortality had no statistically significant relation with physician admission patterns. In year 2004 when the report card system was launched (in November), physician admissions for AMI patients began to respond to the undisclosed AMI risk-adjusted mortality. The magnitude of change was strongest in 2005, the first year after the full implementation of FL public reporting system, and the effect persisted in the following 2 years. However, the effect deteriorated over time, and by 2008 the effect was gone. The fact that the timing of responses was so closely associated with the timing of the implementation of report cards suggested that the changes in hospital admission patterns were likely caused by the release of report cards.
Sensitivity Analysis
We conducted several sensitivity analyses to examine stability of the findings. First, we hypothesize that if the change in AMI admission patterns were due to the release of AMI quality reports, the change in AMI admission patterns should only be related to AMI quality but not other measures. We test the hypothesis by choosing several unreported process/outcomes measures for conditions that are irrelevant to AMI. Specifically, we regress physicians’ AMI admission patterns on risk-adjusted mortality rates for GI hemorrhage, pancreatic cancer, and pneumonia, and delivery rate for cesarean section. These conditions were chosen because they have sufficient observations across hospitals and can be calculated using the same AHRQ IQI tools. The results (not presented, but available upon request) showed no clear association between AMI admissions and these other process/outcomes measure, supporting our hypothesis.
Secondly, we vary the sample exclusion criteria to be more/less restrictive. Restricting traveling distance to 30 - 50 miles provided qualitative similar findings. We also included all physicians who had valid zip code to compute distance but did not specialize in Internal Medicine, Family Medicine, or Cardiac Surgeon; the results were consistent while the magnitude of effect was smaller. Overall, the findings are not sensitive to these changes in sample exclusion criteria.
5. DISCUSSION
Our study provides 2 important empirical findings. First, we find that aggregated reporting, i.e. ranking a hospital’s quality (mortality) in “better”, “as expected”, or “worse” 3 categories, does not appear to affect hospital admission patterns significantly. This finding is consistent with most existing studies which found limited or no demand response to disclosed quality information. While this study does not test the underlying reason(s) directly, we think that the lack of a potential effect could be related to the usefulness of the disclosed information. Aggregated reporting may ease the mental demand for consumers to understand and compare quality across hospitals than the more complicated hospital-level information. However, the downside is that while the 3 categories may help consumers to identify the best and worst, such information may not be useful in terms of actually helping consumers to decide which hospital to go to. Furthermore, if consumers already have proxies for the best and worst hospitals, such as the teaching status, size, location, and reputation of a hospital, aggregated ranking may provide little new information to consumers and thus do not affect behavior.
Our second and the most interesting finding is that patients and physicians do have private information channel, and that non-report-card learning may be affected by the implementation of report cards. We found that physicians’ admission patterns responded to hospital quality after the implementation of the FL reporting system, at
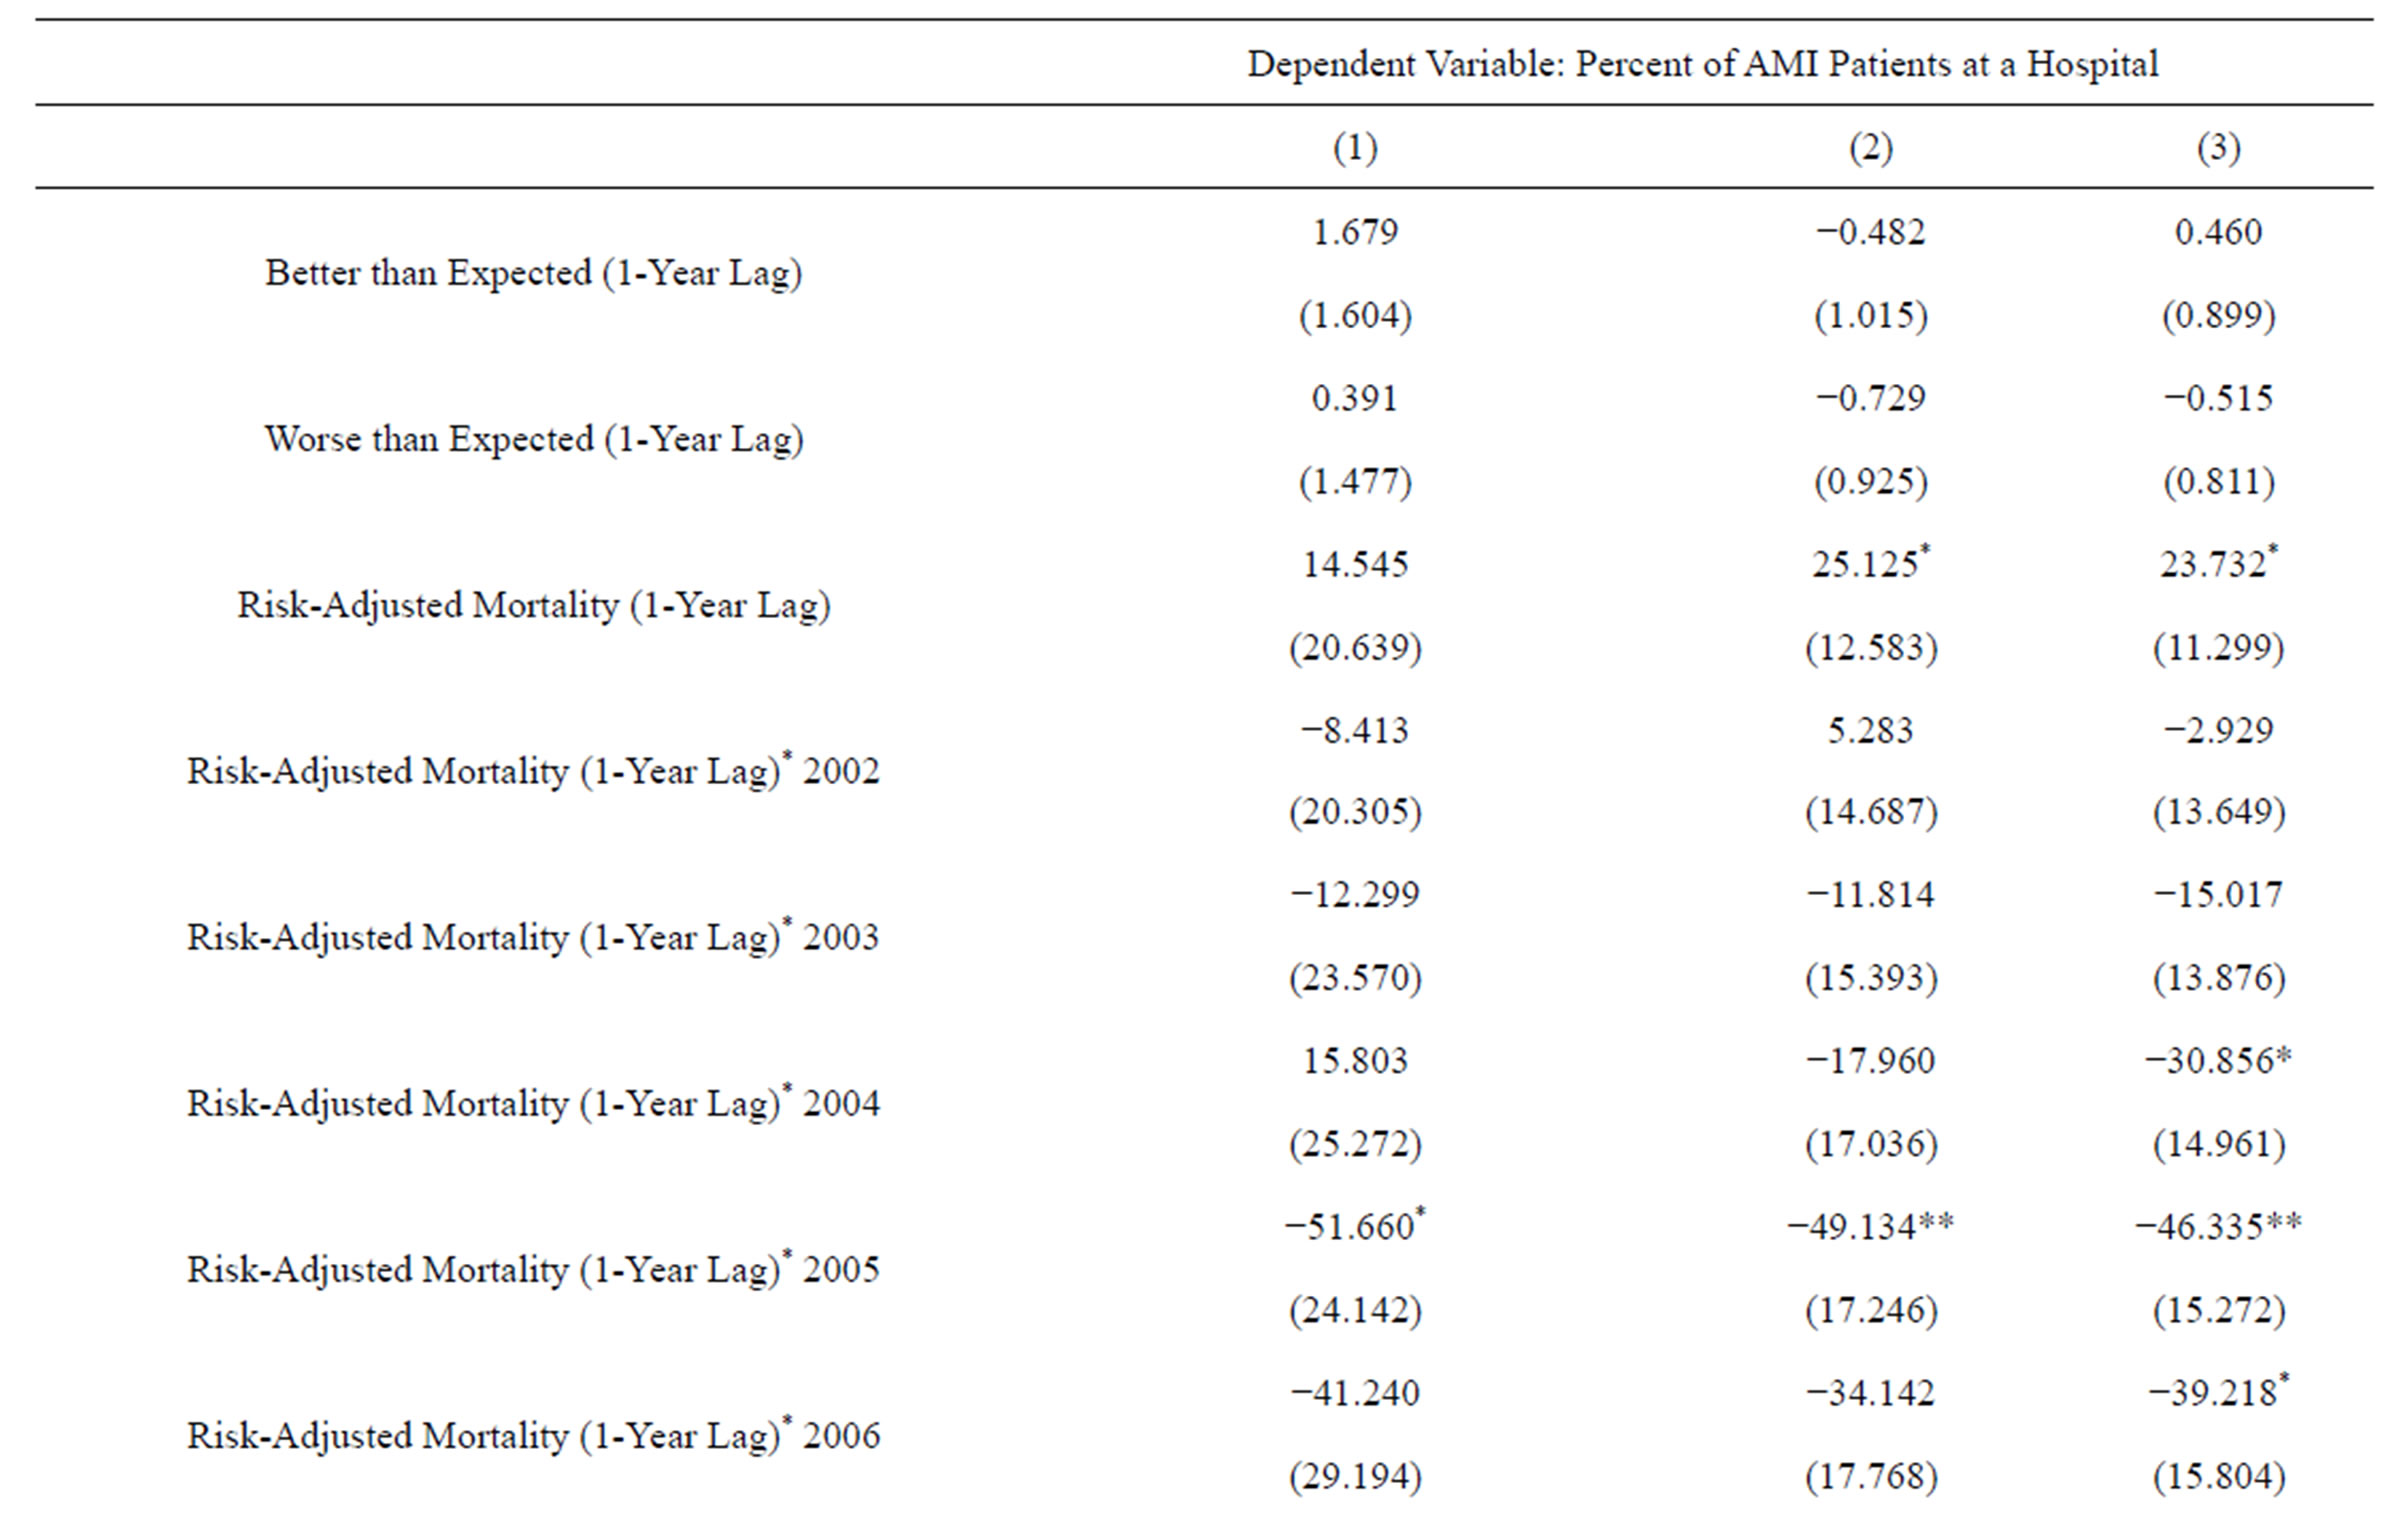
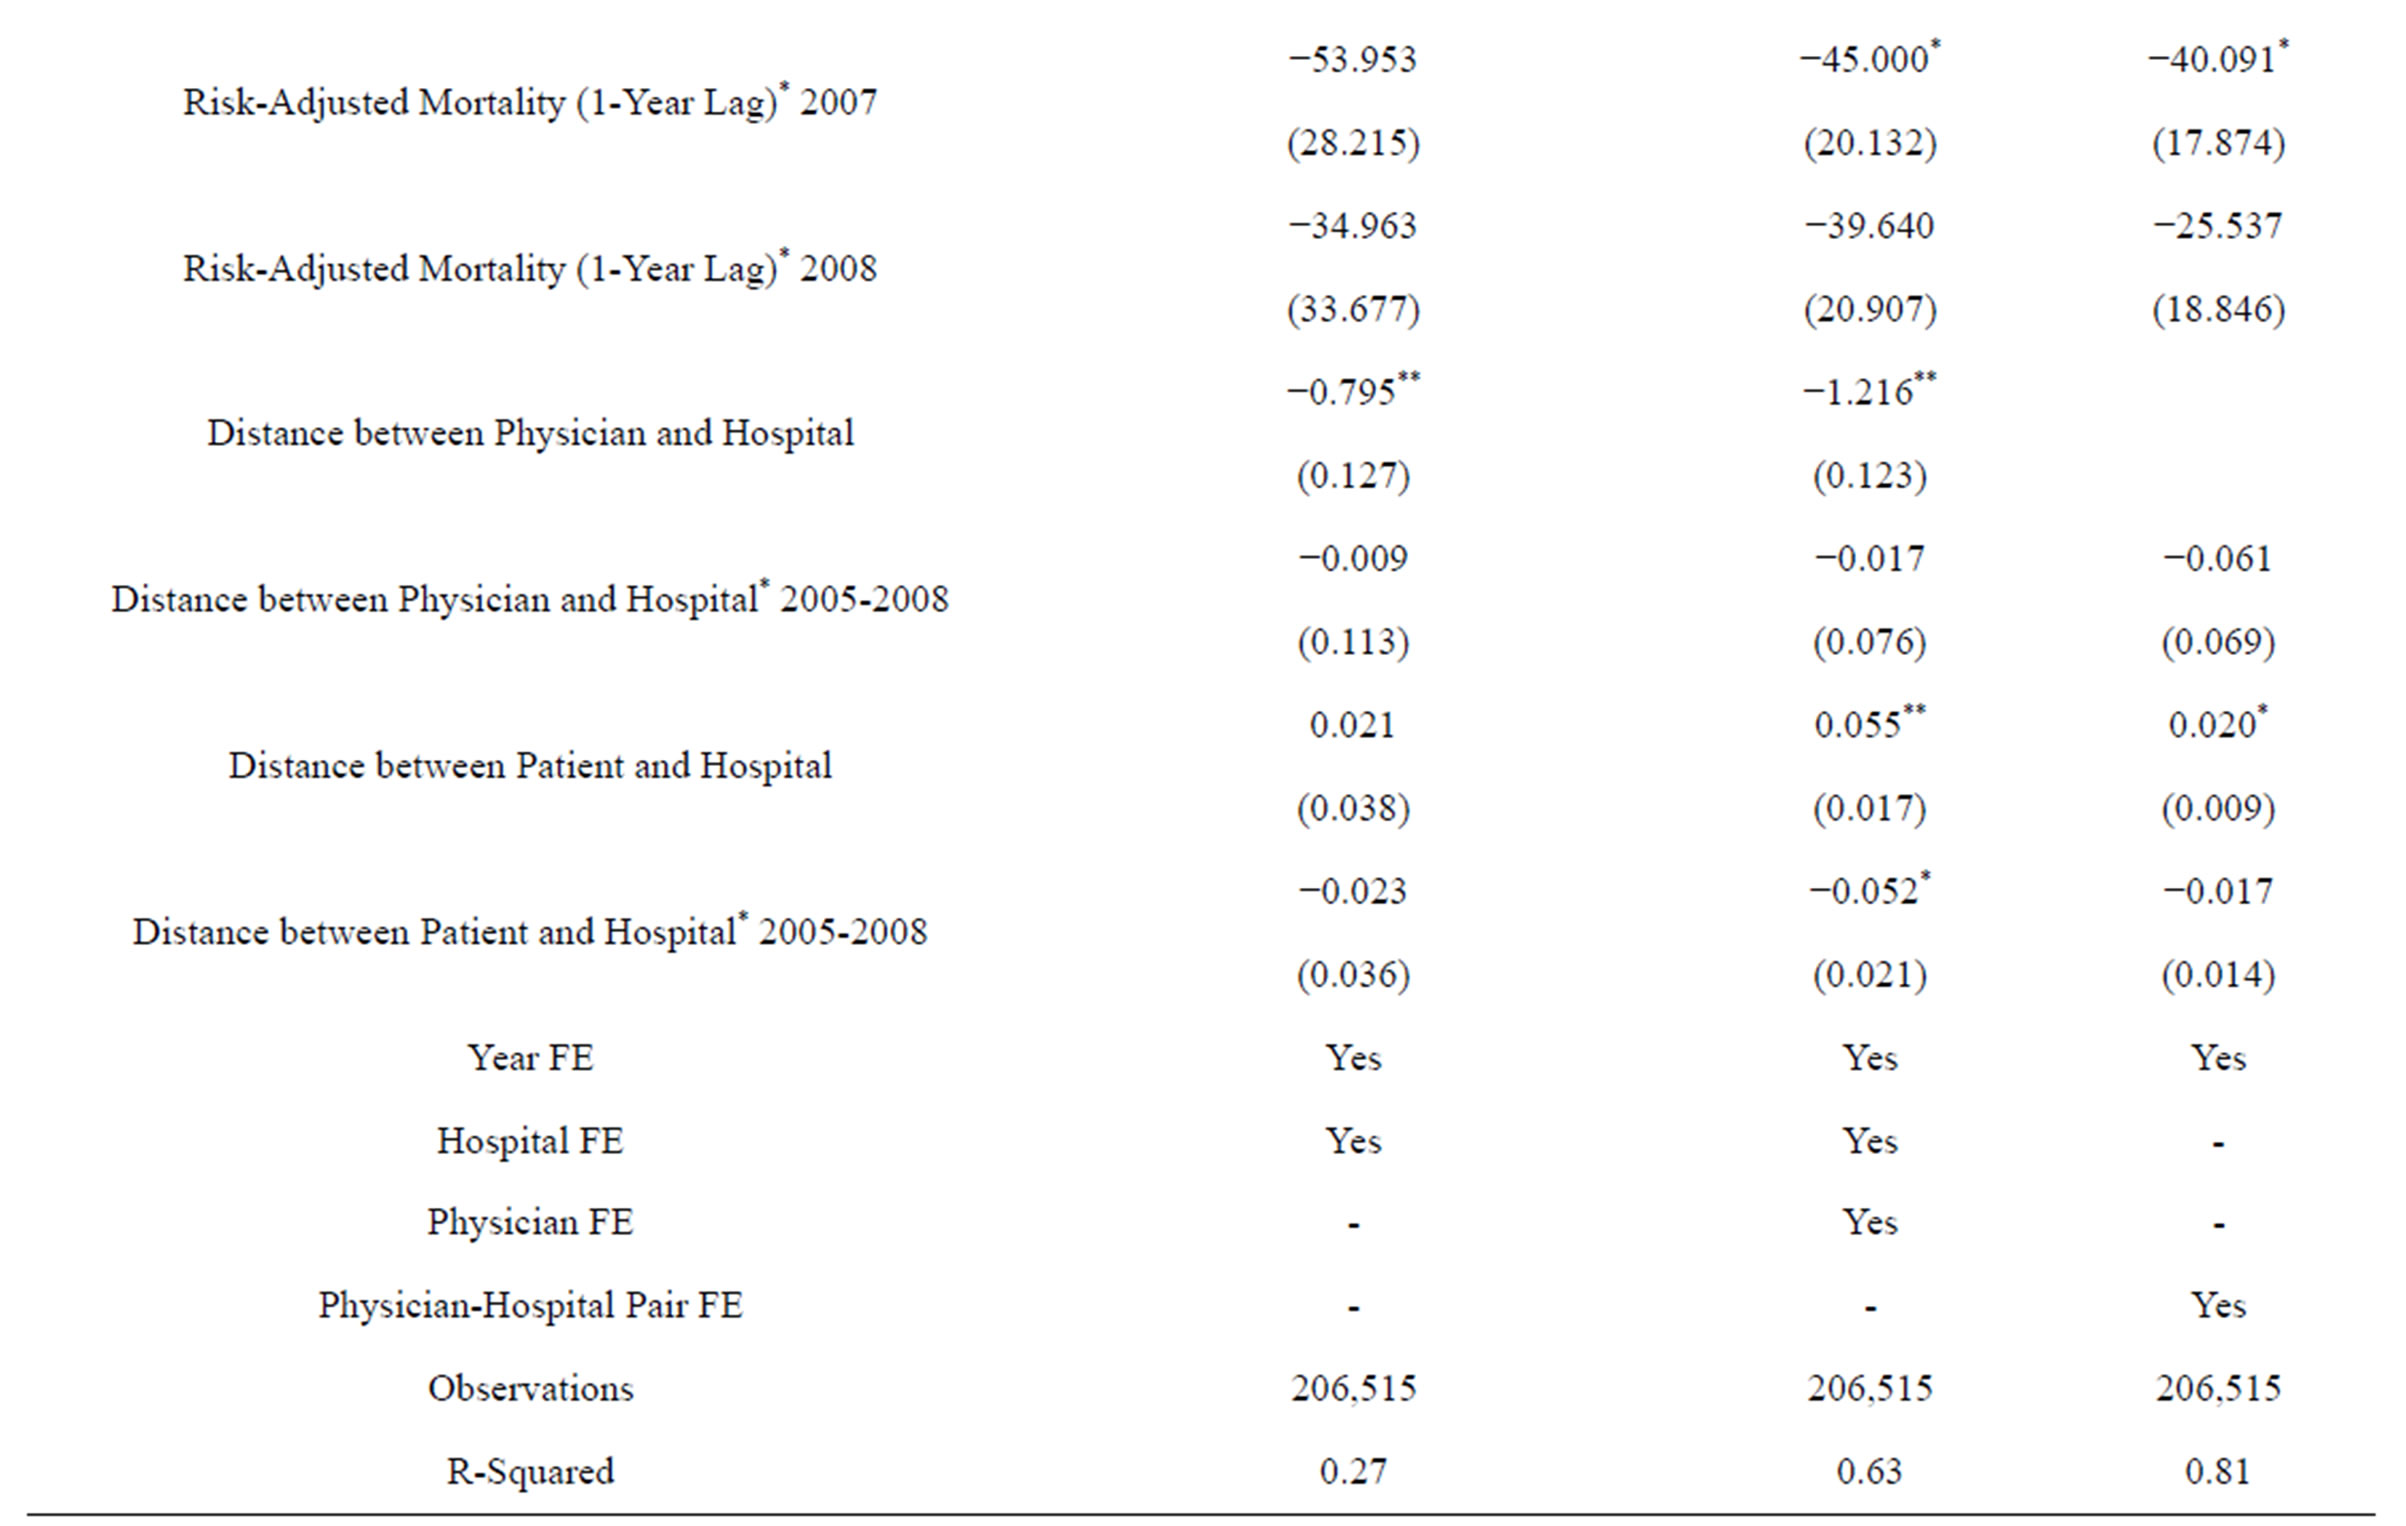
Table 3. Relationship between report card better/worse ranking and hospital admission patterns, 2001-2008.
Robust standard errors clustered at physician, hospital and physician-hospital pair level in each column respectively pair in parentheses. *Significant at 5%; **Significant at 1%.
the detailed hospital-level, but such detailed information was never available in the public reporting. In addition, the response was strongest within the first 3 years after the release of report cards. This finding supports what was emphasized in several studies that there is a substantial amount of private learning [5,11]. But our study provides new findings consistent with the possibility that non-report-card learning can be facilitated by report cards, although the effect lasted only for a few years.
We think that the responses to quality could be coming from patients and/or physicians. Non-report-card learning about hospital quality is improved if patients are better educated about the variation in quality among hospitals, and the importance to seek and select quality hospitals as a result of report cards. Demand response to undisclosed quality can be enhanced due to change in physicians’ behavior as well. Doctors presumably are much more knowledgeable about a hospital’s true quality [14]. However, they may not always admit patients to hospitals of the best quality due to a contractual arrangement, convenience to the physicians, or other factors as found in the literature [15]. With the fact that report cards’ facilitating increased public awareness and scrutiny about provider quality, physicians may be pressured to start to admit patients according to quality more than other factors at the margin. Our present setting does not allow us to distinguish whether the non-report-card responses came from the patients or physicians, and we leave this as an important area for future research. Our findings also suggest that consumers may not have problems comprehending the more detailed hospital-level quality information.
To get a sense of the magnitude of the demand response, we calculate how a one standard deviation decrease in average risk-adjusted mortality, or by 0.03 percentage points, will affect the number of AMI cases at an average hospital. Using our most conservative estimate in Table 2 Column 3, a 0.03 percentage point decrease in mortality will lead to a 0.81 (0.81 = 0.03 × 27) percentage point increase in AMI patient distribution per physician, or about 0.6 AMI patient. While this number may seem small, this amount to an increase of total 19 AMI cases for an average hospital that has 32 admitting physicians, implies an 11% (11% = 19/174 average number of AMI cases in 2004) increase in total AMI patient volume. This calculation is meant to illustrate an important demand response due to report cards that are often not considered or captured correctly in most existing studies. When non-report-card learning is not controlled in addition to public report card effect, the estimated demand response is biased. When non-report-card learning is controlled but its interaction with report card is not allowed, the results are biased as well.
There are several limitations of the study. First, our study is limited to just one state and one condition. Second, the lack of findings in responses to reported ranking may be related to data limitation. Only 8% - 10% hospitals were identified as “better” or “worse” each year and the movement between the categories was limited, so that it is harder to precisely identify an effect with the fixed effect model. Third, our results could be caused by some co-temporal factors that occurred around 2005 and were not controlled in the model. However, we are unaware of any special event in 2005 that would significantly affect AMI patient’s hospital admissions other than the FL report card implementation. Forth, while our results suggest a strong correlation that non-report-card learning can be enhanced by report cards, our study does not provide evidence with regard to the actual mechanism that how report cards change various channels of private learning. With these caveats in mind, our study still points to an important aspect that future models of consumer learning should consider the interaction between informational channels.
REFERENCES
- Kolstad, J.T. (2010) Information and quality when motivation is intrinsic: Evidence from surgeon report cards. University of Pennsylvania, Pennsylvania.
- Harris, K.M. and Buntin, M.B. (2008) Choosing a health care provider: The role of quality information. Research Synthesis Report 14. Robert Wood Johnson Foundation, Princeton.
- Kolstad, J.T. and Chernew, M.E. (2009) Quality and consumer decision making in the market for health insurance and health care services. Medical Care Research and Review, 66, 28S-52S. http://dx.doi.org/10.1177/1077558708325887
- Mukamel, D.B. and Mushlin, A.I. (2001) The impact of quality report cards on choice of physicians, hospitals, and HMOs: A midcourse evaluation. The Joint Commission Journal on Quality Improvement, 27, 20.
- Chernew, M., Gowrisankaran, G. and Scanlon, D.P. (2008) Learning and the value of information: Evidence from health plan report cards. Journal of Econometrics, 144, 156-174. http://dx.doi.org/10.1016/j.jeconom.2008.01.001
- Dranove, D. and Sfekas, A. (2008) Start spreading the news: A structural estimate of the effects of New York hospital report cards. Journal of Health Economics, 27, 1201-1207. http://dx.doi.org/10.1016/j.jhealeco.2008.03.001
- Epstein, A.J. and Rosenquist, J.N. (2010) Tell me something new: Report cards and the referring physician. The American Journal of Medicine, 123, 99-100. http://dx.doi.org/10.1016/j.amjmed.2009.08.010
- Mukamel, D.B., et al. (2004) Quality report cards, selection of cardiac surgeons, and racial disparities: A study of the publication of the New York State Cardiac Surgery Reports. Inquiry: A Journal of Medical Care Organization, Provision and Financing, 41, 435.
- Scanlon, D.P., et al. (2002) The impact of health plan report cards on managed care enrollment. Journal of Health Economics, 21, 19-41. http://dx.doi.org/10.1016/S0167-6296(01)00111-4
- Wedig, G.J. and Tai-Seale, M. (2002) The effect of report cards on consumer choice in the health insurance market. Journal of Health Economics, 21, 1031-1048. http://dx.doi.org/10.1016/S0167-6296(02)00075-9
- Dafny, L. and Dranove, D. (2008) Do report cards tell consumers anything they don’t already know? The case of medicare HMOs. The RAND Journal of Economics, 39, 790-821. http://dx.doi.org/10.1111/j.1756-2171.2008.00039.x
- Jin, G.Z. and Sorensen, A.T. (2006) Information and consumer choice: The value of publicized health plan ratings. Journal of Health Economics, 25, 248-275. http://dx.doi.org/10.1016/j.jhealeco.2005.06.002
- Bundorf, M.K., et al. (2009) Do markets respond to quality information? The case of fertility clinics. Journal of Health Economics, 28, 718-727. http://dx.doi.org/10.1016/j.jhealeco.2009.01.001
- Schneider, E.C. and Epstein, A.M. (1996) Influence of cardiac-surgery performance reports on referral practices and access to care. A survey of cardiovascular specialists. The New England Journal of Medicine, 335, 251-256. http://dx.doi.org/10.1056/NEJM199607253350406
- Burns, L.R. and Wholey, D.R. (1992) The impact of physician characteristics in conditional choice models for hospital care. Journal of Health Economics, 11, 43-62. http://dx.doi.org/10.1016/0167-6296(92)90024-U
NOTES
1The old V.3.0 version.