 Vol.3, No.5, 343-353 (2013) Open Journal of Ecology http://dx.doi.org/10.4236/oje.2013.35039 Valuing ecological resources through st akeholder participation George O. Rogers*, Eric K. Bardenhagen Department of Landscape Architecture and Urban Planning, Hazard Reduction and Recovery Center, College of Architecture, Texas A&M University, College Station, USA; *Corresponding Author: grogers@tamu.edu Received 31 May 2013; revised 5 July 2013; accepted 15 July 2013 Copyright © 2013 George O. Rogers, Eric K. Bardenhagen. This is an open access article distributed under the Creative Commons Attribution License, which permits unrestricted use, distribution, and reproduction in any medium, provided the original work is properly cited. ABSTRACT This paper presents a pilot effort to identify a methodology to more efficiently codify, quantify and illustrate the intrinsic values associated with ecological resources as expressed by sta- keholders. Existing methodologies examine the value of ecological resources, but are often cri- ticized for their monetary focus. These methods generally produce quasi-market values for non- market resources. The natural and cultural re- sources associated with a national park are analyzed in terms of the expressed values of ac- tive stakeholders to quantitatively produce mul- tiple dimensions of value for each resource re- lative to all others. The resulting abstract and graphical value-space quantitatively reflects sta- keholder participation, reflects non-market in- trinsic value, and proactively contributes to en- vironmental management and decision making. Keywords: Ecological Resource Valuation; Intrinsic Values; Place-Based Valuation; Natural Resources; Value-Space; Stake-Holder Participation 1. INTRODUCTION This paper presents a pilot effort to develop a method- ology that quantitatively assesses a range of perceived intrinsic values, those outside of monetary markets and often variably described by individuals as related to the very existence of a resource, associated with ecological resources in a national park. Resources are placed rela- tive to one another in an abstract graphic value-space of multiple dimensions to express intrinsic values. Each dimension is unique from all others and significantly contributes to the overall value-space as described later. Representation of these relative resource values can be used throughout the span of decision processes and may be employed prior to or alongside traditional monetary measures of value. This approach: is an important step in valuing ecological resources, with their attendant qualities of including intrinsic values; supports resource management decisions through an empirical multi-dimensional approach to valuation; complies with the constitutionally derived prohibition of arbitrary and capricious government regulations and actions as it is based on factual assessments of reasonable and reliable evidence; and supports executive decision-making by allowing the intrinsic values of ecological resources to be more effectively incorporated into these decisions. A number of preference-based measures exist for valu- ing ecological resources. Ciriacy-Wantrup [1] conceptua- lized the maximum monetary value a person is willing to pay (exchange, sacrifice or otherwise barter) for a public good as one measure of value for non-market resources. These measures rely on preferences (usually expressed in response to a survey) for hypothetical outcome(s). Davis [2] designed and implemented the first survey using willingness-to-pay, correlating the results with the travel cost method, and found results that were quite similar. In spite of these early tests of reasonableness, reservations were raised about using partial values to represent re- sources, which encourages (or subsidizes) over-use of scarce resources [3]. Contingent valuation measures stemming from the willingness-to-pay concept have be- come widely used in valuing environmental resources and outcome(s). In spite of widespread use in the 1980’s, a debate ensued between those who found these mea- sures sufficiently valid to warrant requiring their use in environmental regulation and those who opposed such requirements because of the under-representation of non- market values [4,5]. This paper accepts the idea that monetary measures of ecological resources under-repre- Copyright © 2013 SciRes. OPEN ACCESS  G. O. Rogers, E. K. Bardenhagen / Open Journal of Ecology 3 (2013) 343-353 344 sent the value associated with these resources. The me- thodology utilizes stakeholder input to assess the per- ceived intrinsic values of ecological resources associated with a particular place in multiple dimensions. The re- sulting abstract graphic value-space represents the uni- que contribution(s) of significant dimensions of value relative to and independent of one another. 2. BACKGROUND Meaningfully including the full range of values for ecological resources, most of which are non-market, in resource management decisions is one of the most vex- ing problems facing resource managers, planners and policy makers. Shafer and Brush [6] developed a model of preference to quantify the value of natural landscapes through statistical analysis of spatial data and observed strong correlations with stated preferences for landscape features. Carlson [7] challenged that quantification of aesthetic beauty may not be possible or even reasonable. If quantification is possible, it is unlikely to be easy or straightforward. He notes that landscape assessments fail to express overall quality adequately, but perform better in capturing relationships between elements within a landscape. This excludes some important drivers of aes- thetic beauty such as public opinion preferences for for- malism in photographs rather than more robustly under- stood natural aesthetic beauty. Ribe [8] suggests that this misconstrues the intentions and purpose of those who seek to quantify the value of natural scenic beauty as a pursuit of objectivity alone, rather than a more effective, deep and considered exploration of the elements and relationships of aesthetic beauty. He goes on to suggest that multiple approaches enhance human awareness of the function of environmental aesthetics [8]. By recog- nizing that scenic beauty depends on human perception, Gobster [9] suggests that the complexities associated with dimensions such as symbolism, culture and natural processes are inherently multi-dimensional. As individu- als and members of a community, humans each hold their own unique and complex relationships with surrounding ecological resources. Surrounding landscapes are com- plex, and when viewed holistically have unique identities that blend the resources, both ecological and cultural found therein [10]. Each interaction with a landscape, whether as a par- ticipant in a landscape or as a policy maker affecting that landscape, expresses an individual’s values associated with that place and its resources. These resources can be both highly valued, as well as, valued for a variety of reasons. Measuring this perceived value, however, is limited by the ways in which value can be associated with the resources, few of which can readily incorporate multiple dimensions. As a result, these measures often arguably fail to incorporate significant portions of the individual or shared community values people associate with these resources in information that guides decision processes affecting them [11-13]. This under-representa- tion of value is most often the case when non-market resources, those not easily priced or quantified for inclu- sion in economic efficiency analyses, are considered [5,12]. This leaves ecological resource managers and planners in a quandary; how can they incorporate the non-market intrinsic values into decisions processes in a meaningful rational way? 1) Planning processes often support execu- tive decision making with factual assessments, but what gets assessed, how it is characterized, the analysis and interpretation are all laden with values. This accountabil- ity becomes even more difficult when the intrinsic values associated with ecological resources are involved. Cre- ating a value space on the basis of this place-based re- source driven approach described herein empirically quantifies these values, which allows them to be more effectively incorporated into these decisions (e.g., com- pared, analyzed, and related to expressed preference valuations of these resources). 2) Congress and the Council on Environmental Quality defined the National Environmental Policy Act process to comply with the constitutionally derived prohibition of arbitrary and ca- pricious government regulations and actions. Resource planners and managers cannot make value choices that are not substantiated by reasonable and reliable evidence. Thus, ecological resource managers often face the cha- llenge of making complex resource management deci- sions based on empirical non-arbitrary evidence. These decisions become more difficult in light of the values expressed by stakeholders that are intrinsic, non-market based, and held with strong personal convictions. Yet when resource management decisions are based on qual- itative assessments alone they often seem to be arbitrary. Conversely quantifying these issues are often undertaken in a linear process [14-17]. This linear process is reac- tionary in nature, relying on pre-formed problems, objec- tives and alternatives before value assessments are made. Participation of stakeholders is recognized as an impor- tant element of the decision process [e.g., 16,17]. Active and early stakeholder participation can provide value in- formation in the critical problem and objectives forma- tion stages of the decision process. In fact, it can inform the entire decision process including the types of values to be considered, selection of the preferred alternative and its implementation. This approach seeks to lend support to these chal- lenges by allowing planners to incorporate intrinsic val- ues into the process on the basis of reasonable and reli- able empirical evidence. (3) Because of the special legal and political foundations of National Parks, decisions Copyright © 2013 SciRes. OPEN ACCESS  G. O. Rogers, E. K. Bardenhagen / Open Journal of Ecology 3 (2013) 343-353 Copyright © 2013 SciRes. 345 therein may be somewhat insulated from economic valua- tions, tradeoffs, and market proxy evaluations. But park managers still make decisions that impact ecological resources. The method developed herein supports these resource management decisions by measuring the value associated with ecological resources empirically, in mul- tiple dimensions, and providing quantitative evidence. familiar with the natural and cultural resources that com- prise the park. Cape Lookout has a broad range of resources, which can be categorized into three basic categories: natural, historical and infrastructural. Natural resources include a diverse mix of plant and animal species, which depend on the unique habitats in the park. Four endangered spe- cies are listed within the park. The park is also home to a legislatively-protected herd of wild horses, the Shackle Hazardous storms are a persistent threat to Cape Lookout. The impacts of hurricanes and tropical storms have af- fected park resources and operations in the past few decades [19]. The process described herein contributed to the assessment of priority given each natural or cultural resource in the course of emergency planning. These priorities inform decisions about the preservation and protection of park resources. These become particularly relevant during hazard events when park personnel are stretched thin and response teams include people less familiar with the natural and cultural resources that com- prise the park. 3. SETTING The data collected for this research were part of a storm recovery planning process undertaken for the 90 km long barrier island system of Cape Lookout National Seashore in North Carolina (Figure 1) [18]. Hazardous storms are a persistent threat to Cape Lookout. The im- pacts of hurricanes and tropical storms have affected park resources and operations in the past few decades [19]. The process described herein contributed to the assessment of priority given each natural or cultural re- source in the course of emergency planning. These pri- orities inform decisions about the preservation and pro- tection of park resources. These become particularly relevant during hazard events when park personnel are stretched thin and response teams include people less Cape Lookout has a broad range of resources, which can be categorized into three basic categories: natural, F igure 1. Location map of cape lookout national seashore. OPEN ACCESS  G. O. Rogers, E. K. Bardenhagen / Open Journal of Ecology 3 (2013) 343-353 346 historical and infrastructural. Natural resources include a diverse mix of plant and animal species, which depend on the unique habitats in the park. Four endangered spe- cies are listed within the park. The park is also home to a legislatively-protected herd of wild horses, the Shackle- ford Banks Horses. In addition, several unique habitats support these flora and fauna, including tidal flats, salt marshes, dune and beach areas, maritime forests and ocean fisheries. Historic resources are directly tied to the history of the seafaring communities of coastal North Carolina. This park includes the two historic maritime villages of Portsmouth and Cape Lookout which includes the iconic Cape Lookout Lighthouse, two lighthouse keeper’s quarters, two life saving stations, a former Coast Guard station and numerous homes. Infrastructural re- sources include human support systems such as dockage, sand and paved roads, restrooms, visitor centers, water and septic systems, communication facilities and main- tained waterways. 4. METHODS A stakeholder-based valuation methodology was de- veloped to measure the values for specific park resources along multiple dimensions. Active stakeholders selected the top-ten resources in Cape Lookout from an inventory of natural and cultural resources. Each selected resource was ranked on five dimensions—fundamental character, visitation, scenic beauty, ability to operate, and ability to be replaced. Factor analysis of these ratings reveals a two dimensional space that places each resource relative to one another. This method is place-based in that the resources con- sidered are geographically and culturally associated with the place; it is resource driven in that the value(s) associ- ated with each resource provides the primary stimulus central to the assessment. The place-based resource- driven approach to valuation involves the identification of resources critical to the place, and assessing the value(s) associated with each significant resource. A par- simonious model of the value structure that accounts for significant variation in the pattern of responses is used to create a value-space that presents each resource relative to all others. 4.1. Stakeholder Survey Active stakeholders were asked to select the ten re- sources “most important to the park,” from a list of 49 park resources included in park inventories and other resources they might add. Each of the ten selected re- sources was rated along five value types. Expressed im- portance for “fundamental character”, “attracting visi- tors”, “scenic beauty”, and “ability to operate”, was rated on a zero-to-ten scale, where zero indicated “not at all important”, and ten represented “extremely important”. The “ability to be replaced” was also rated on a zero-to- ten scale, where zero indicated “not able to be replaced” and ten represented “easily replaced.” These five types of value were developed through discussions with park staff concerning resources and their view of the reasons various resources were impor- tant to the park. While 178 of 219 people that opened the web survey selected the ten-most important resources (or 83.1%), 153 respondents rated the selected resources (or 69.9%). Respondents completed the survey in an average of 15.2 minutes. Eight respondents did identify other resources not represented in the inventory but all were unique to that individual. Of the 49 resources initially listed, only 47 were included in two or more respon- dent’s top-ten-selections. Increasing the minimum thre- shold to four or more top-ten selections resulted in very minor alterations in the resource means and subsequent factor analysis component loadings, but reduced the number of resources considered to 44 rather than 47. Because using a threshold of two is consistent with the focus herein on shared-value, and maximizes the number of resources considered, while controlling potential mea- surement volatility associated with using single ratings, the threshold of two or more is used herein. 4.2. Creating a Value-Space The mean rating of each resource is a distributional measure of the importance of each resource to “funda- mental character”, “attracting visitors”, “scenic beauty”, “ability to operate”, and “ability to replace”. Mean rat- ings of resources selected among the top-ten for a place might be expected to be concentrated in the upper end of the zero-to-ten scale. Table 1 shows the mean ratings throughout the scale. For example, the Piping Plover’s (Charadrius melodus) mean rating is a 0.22 on ability to replace and 2.13 on importance to operations. Meanwhile, the Keeper’s Quarters is 8.82 on importance to character, 6.68 on importance to operations, while only 1.16 for ability to be replaced. These ratings assess each resource with respect to a common zero-to-ten scale with a mean- ingful zero of “not at all important” or “not able to be replaced”, and a maximum of ten reflecting “extremely important” or “easily replaced”. The relative ranking of each resource for each value type ranges from one for the most important resource to 47 for the least important resource. The ranking is based on the ratings given by respondents, which are the prod- uct of the number of respondents selecting each resource and the average rating or expressed-value. Ratings that resulted in equal expressed values for two resources were subsequently assigned unique ranks, where more people selecting a resource ranked higher than the less fre- Copyright © 2013 SciRes. OPEN ACCESS 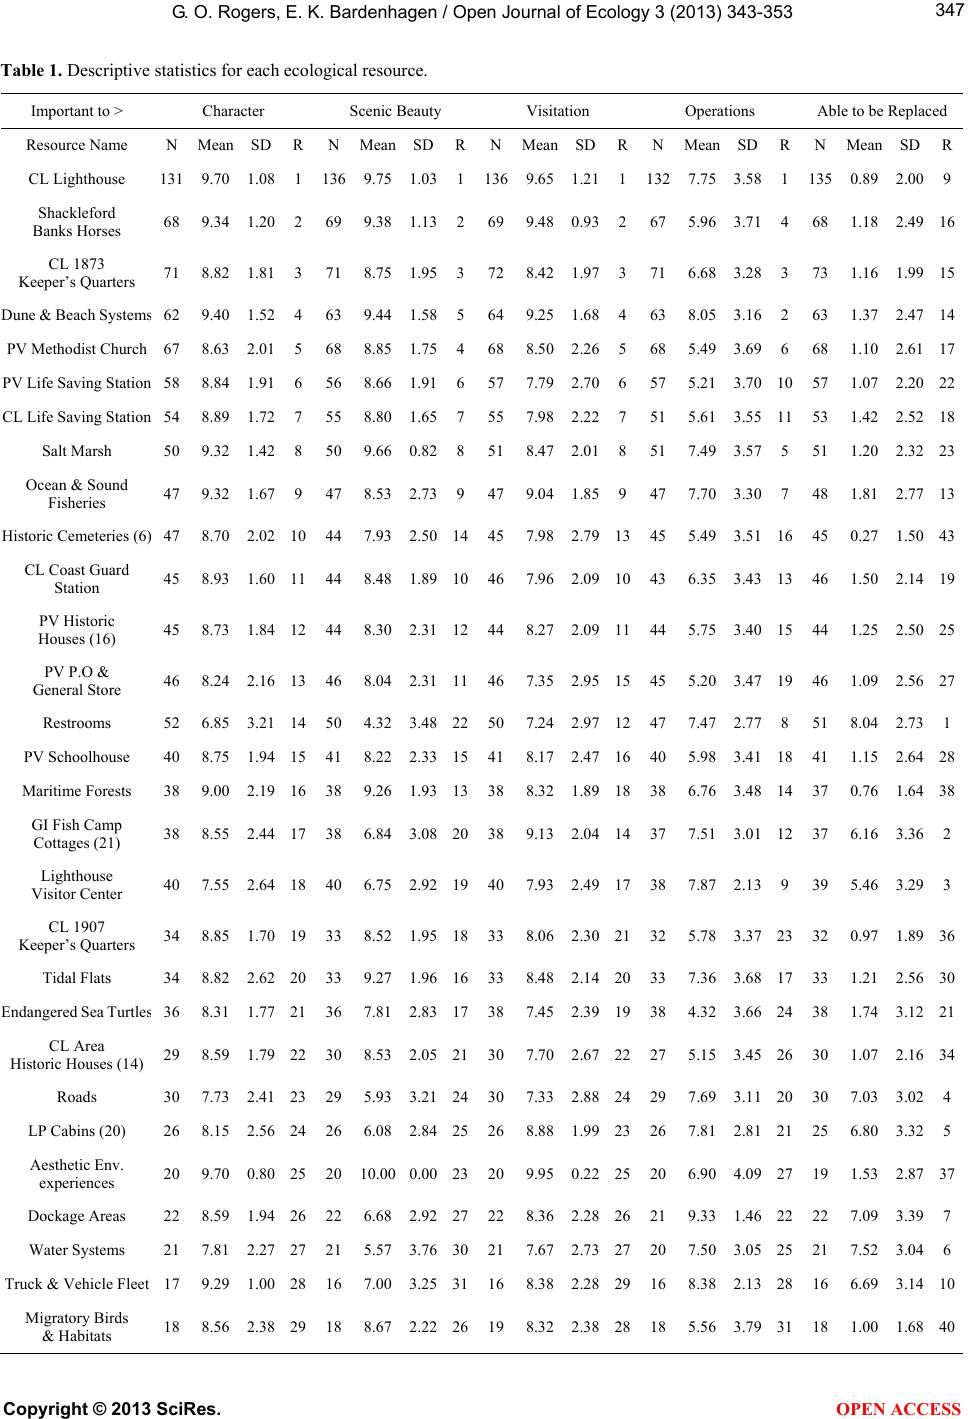 G. O. Rogers, E. K. Bardenhagen / Open Journal of Ecology 3 (2013) 343-353 347 Table 1. Descriptive statistics for each ecological resource. Important to > Character Scenic Beauty Visitation Operations Able to be Replaced Resource Name N Mean SD R N Mean SD RN Mean SD RN Mean SD R N Mean SD R CL Lighthouse 131 9.70 1.08 1 136 9.751.031136 9.65 1.2111327.753.58 1 135 0.892.009 Shackleford Banks Horses 68 9.34 1.20 2 69 9.381.132699.48 0.932675.963.71 4 68 1.182.4916 CL 1873 Keeper’s Quarters 71 8.82 1.81 3 71 8.751.953728.42 1.973716.683.28 3 73 1.161.9915 Dune & Beach Systems62 9.40 1.52 4 63 9.441.585649.25 1.684638.053.16 2 63 1.372.4714 PV Methodist Church 67 8.63 2.01 5 68 8.851.754688.50 2.265685.493.69 6 68 1.102.6117 PV Life Saving Station 58 8.84 1.91 6 56 8.661.916577.79 2.706575.213.70 10 57 1.072.2022 CL Life Saving Station 54 8.89 1.72 7 55 8.801.657557.98 2.227515.613.55 11 53 1.422.5218 Salt Marsh 50 9.32 1.42 8 50 9.660.828518.47 2.018517.493.57 5 51 1.202.3223 Ocean & Sound Fisheries 47 9.32 1.67 9 47 8.532.739479.04 1.859477.703.30 7 48 1.812.7713 Historic Cemeteries (6) 47 8.70 2.02 10 44 7.932.5014457.982.7913455.493.51 16 45 0.271.5043 CL Coast Guard Station 45 8.93 1.60 11 44 8.481.8910467.962.0910436.353.43 13 46 1.502.1419 PV Historic Houses (16) 45 8.73 1.84 12 44 8.302.3112448.272.0911445.753.40 15 44 1.252.5025 PV P.O & General Store 46 8.24 2.16 13 46 8.042.3111467.352.9515455.203.47 19 46 1.092.5627 Restrooms 52 6.85 3.21 14 50 4.323.4822507.242.9712477.472.77 8 51 8.042.731 PV Schoolhouse 40 8.75 1.94 15 41 8.222.3315418.172.4716405.983.41 18 41 1.152.6428 Maritime Forests 38 9.00 2.19 16 38 9.261.9313388.321.8918386.763.48 14 37 0.761.6438 GI Fish Camp Cottages (21) 38 8.55 2.44 17 38 6.843.0820389.132.0414377.513.01 12 37 6.163.362 Lighthouse Visitor Center 40 7.55 2.64 18 40 6.752.9219407.932.4917387.872.13 9 39 5.463.293 CL 1907 Keeper’s Quarters 34 8.85 1.70 19 33 8.521.9518338.062.3021325.783.37 23 32 0.971.8936 Tidal Flats 34 8.82 2.62 20 33 9.271.9616338.482.1420337.363.68 17 33 1.212.5630 Endangered Sea Turtles36 8.31 1.77 21 36 7.812.8317387.452.3919384.323.66 24 38 1.743.1221 CL Area Historic Houses (14) 29 8.59 1.79 22 30 8.532.0521307.702.6722275.153.45 26 30 1.072.1634 Roads 30 7.73 2.41 23 29 5.933.2124307.332.8824297.693.11 20 30 7.033.024 LP Cabins (20) 26 8.15 2.56 24 26 6.082.8425268.881.9923267.812.81 21 25 6.803.325 Aesthetic Env. experiences 20 9.70 0.80 25 20 10.000.0023209.950.2225206.904.09 27 19 1.532.8737 Dockage Areas 22 8.59 1.94 26 22 6.682.9227228.362.2826219.331.46 22 22 7.093.397 Water Systems 21 7.81 2.27 27 21 5.573.7630217.672.7327207.503.05 25 21 7.523.046 Truck & Vehicle Fleet 17 9.29 1.00 28 16 7.003.2531168.382.2829168.382.13 28 16 6.693.1410 Migratory Birds & Habitats 18 8.56 2.38 29 18 8.672.2226198.322.3828185.563.79 31 18 1.001.6840 Copyright © 2013 SciRes. OPEN ACCESS  G. O. Rogers, E. K. Bardenhagen / Open Journal of Ecology 3 (2013) 343-353 348 Continued South Core Banks Jetty 15 9.27 1.44 30 15 8.332.4728157.802.3431155.933.43 33 15 2.673.2231 Other Nesting Shorebirds 15 9.00 1.14 31 13 9.151.1429137.922.1834125.333.37 35 13 0.921.3844 Shelters & Pavilions 18 6.78 2.44 32 16 5.442.5334187.392.4330186.502.46 29 18 7.282.708 Parking Lots 15 8.00 2.42 33 15 5.333.8335157.132.5633157.533.04 30 15 7.133.4411 Pedestrian Trails & B’walks 13 7.85 2.44 34 14 6.862.3832138.381.8532146.573.30 32 14 7.072.0912 Beafort’s Bottlenosed Dolphin 10 8.20 2.58 35 11 8.092.5933107.702.6335103.303.62 42 11 1.091.9245 Les & Sally’s Env. Camp 8 8.50 2.14 36 8 5.253.773886.753.15 3786.383.42 37 8 3.383.5439 Piping Plover-EB 8 8.00 2.14 37 9 6.673.203686.003.12 3882.132.47 45 9 0.220.4447 Harkers Island Marina 7 8.71 1.60 38 7 7.862.343778.291.80 3677.863.67 36 7 4.864.1032 Maint. & Equip. Bldgs. 8 6.38 3.34 39 8 3.631.514185.002.56 4089.001.20 34 8 7.501.4124 Sea-Beach Amaranth-EP 5 8.80 2.38 40 4 7.503.004046.503.11 4235.675.13 45 4 1.503.0046 RV Dump Stations 8 5.25 3.88 41 9 3.113.954294.894.20 3985.753.77 39 9 7.562.8820 Bridges 5 8.00 3.08 42 5 6.603.213958.003.46 4158.403.58 40 5 6.403.2935 Fuel Storage Areas 6 5.33 4.08 43 6 3.173.714463.674.23 4468.332.34 38 6 8.831.1726 GI Generator Shed 4 7.00 2.45 44 5 1.201.104752.001.58 4645.504.80 44 5 9.200.8429 Administration Building 4 6.00 4.32 45 4 3.004.764544.254.19 4549.251.50 41 4 8.251.2633 Ranger Cabins at LP 3 8.00 1.73 46 3 8.002.654338.671.53 4339.001.73 43 3 4.334.9342 Ranger Cabins at GI Camps 2 6.50 2.12 47 2 4.001.414622.500.71 4727.502.12 47 2 8.500.7141 Mean = Mean Rating, SD = Standard Deviation, R = Rank, CL = Cape Lookout, PV = Portsmouth Village, GI = Great Island, LP = Long Point, EB = Endangered Bird, EP = Endangered Plant, Env. = Environmental quently selected resource. The resulting ranking is the count of resources from most important (rank = 1) to least important (rank = 47). 5. FINDINGS It is hardly surprising that the importance to character, scenic beauty, visitation, and operations for all top-ten resources receive high average ratings—8.2, 7.2, 7.5 and 6.7 respectively. After all they were selected because they were considered the ten-most important resources. The ability to be replaced was rated as 3.8 on average. The top nine resources are ranked the same by character, scenic beauty, and visitation, and eight of the top nine are also in the top nine for operations. In a similar vein, the bottom nine resources by character, scenic beauty and visitation include the same resources although they are not in the same order, and the rankings on operations includes seven of the same nine resources. The rankings on ability to be replaced share top-ten status with char- acter, scenic beauty and visitation only for the Cape Lookout Lighthouse; the Ranger Cabins at Long Point and Great Island, and the Sea-Beach Amaranth (Ama- ranthus pumilus) are the least able to be replaced and have bottom-ten rankings on character, scenic beauty and visitation. The Pearson Correlations among the value- type measures are presented in Table 2. The strong correlations among importance to character, scenic beauty and visitation for both the mean rating and the ranking seem to indicate that these value-types are sharing the value-space to some extent. The weaker cor- relations between these three measures and importance to operations indicates unique contribution to the value- space. While the stronger negative correlations between these three and the ability to be replaced indicates some limited overlap with character, scenic beauty and visita- tion, but in the other (although not opposite) direction. The importance of operations is not significantly corre- lated with any other measure except the ability to replace, which accounts for about one-fourth of the overall varia- tion. This suggests that both operations and the ability to be replaced may be contributing independently to the overall value-space. Copyright © 2013 SciRes. OPEN ACCESS  G. O. Rogers, E. K. Bardenhagen / Open Journal of Ecology 3 (2013) 343-353 349 The factor analysis results, as reported in Ta ble 3, re- vealed two principal factors (with eigenvalues of 3.23 and 0.89 respectively). The first factor explains most of the variance in the value space (80.7%) and has high factor loadings on fundamental character (0.901), scenic beauty (0.980) and visitation (0.864). The second factor accounts for the remaining variance (22.2%) with high loadings on the ability to operate (0.728) and able to be replaced (0.521). The eigenvalues and the zero additional explained variance after two factors confirm a two-factor value-space. This value-space (Figure 2) is standardized both horizontally and vertically. Each resource is de- picted in the value-space relative to all others. The x-axis of the value-space seems to carry an underlying character of aesthetic quality—generally the more negative the factor scores the more limited aesthetic quality, while the higher the factor score for a resource higher the degree of aesthetic quality. Resources with the lowest aesthetic quality scores include resources like maintenance sheds, fuel storage and waste disposal areas, and administration buildings, while resources with the highest scores in- clude aesthetic environmental experiences, the Shackle Table 2. Pearson Correlations among value-type ratings, between ratings and rankings, and among rankings. Ratings C SB V O R Character (C) --- Scenic Beauty (SB) 0.883 --- Visitation (V) 0.790 0.834 --- Operations (O) NS NS NS --- Replaceable (R) −0.746 −0.861 −0.552 0.571 --- Ratings/Ranking C SB V O R Character (C) −0.620 Scenic Beauty (SB) −0.669 −0.746 Visitation (V) −0.600 −0.656 −0.665 Operations (O) −0.506 −0.548 −0.623 −0.092 Replaceable (R) NS NS NS −0.416 −0.400 Rankings C SB V O R Character (C) --- Scenic Beauty (SB) 0.986 --- Visitation (V) 0.995 0.981 --- Operations (O) −0.962 0.932 0.969 --- Replaceable (R) −0.415 0.331 0.458 0.580 --- Table 3. Factor loadings for the value-space of mean ratings (quartimax rotation). Mean Ratings Aesthetic Quality Factor 1 Functional Quality Factor 2 Eigenvalue 3.23 0.887 Character 0.901 0.001 Scenic Beauty 0.98 −0.074 Visitation 0.864 0.284 Operations −0.208 0.728 Replaceable −0.818 0.521 Variance Explained 0.807 0.222 Cronbach’s Alpha = 0.84, Shaded cells contain loadings > 0.05, which reflects loadings that dominate the factor. Copyright © 2013 SciRes. OPEN ACCESS  G. O. Rogers, E. K. Bardenhagen / Open Journal of Ecology 3 (2013) 343-353 350 Figure 2. Two-factor value-space for resources associated with cape lookout national seashore. ford Banks Horses, the Cape Lookout Lighthouse, salt marshes, and dune and beach systems. The y-axis of the space seems to be associated with a functional quality— with dockage, vehicles, roads, cabins and cottages hav- ing positive factor scores, and Piping Plover, historic cemeteries and Beaufort’s Bottlenose Dolphins (Tursiops truncates) on the negative side. Generally, positive factor scores reflect infrastructural resources with an emphasis on logistics and function, while negative scores reflect historic, cultural and environmental resources, with en- dangered species being among the most negatively lo- cated. Infrastructural resources dominate the upper-left quadrant—no other resource types are located in this quadrant. Historical resources, along with many envi- ronmental resources, dominate the lower-right quadrant. Endangered species tend toward the middle of the aes- thetic quality but are extremely low on infrastructural function as reflected in their importance to operations and ability to be replaced. Visual inspection of Figure 2 also shows that the re- sources tend to cluster by category. The separation of infrastructural resources in the upper left quadrant of the value space demonstrates the clear difference between active human ecological resources and other ecological resources (i.e., difference of means t-test finds infra- structure scores different from all other types of re- sources, p < 0.01). As artifacts of the human ecology, historic resources are afforded considerable aesthetic quality, while tending toward being difficult to replace if not irreplaceable—although there seems to be a recogni- Copyright © 2013 SciRes. OPEN ACCESS 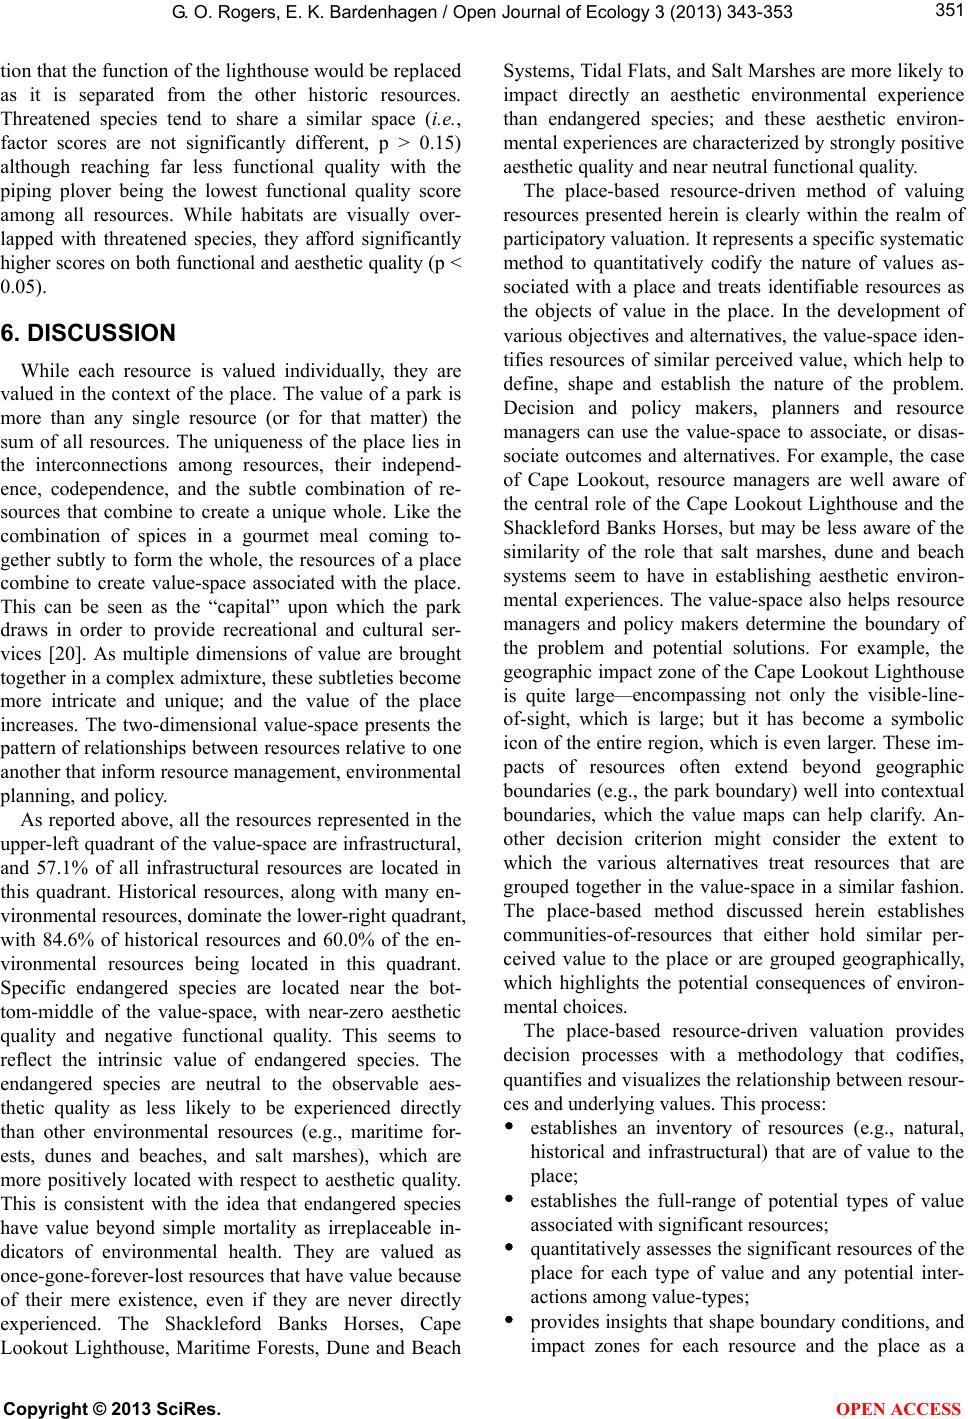 G. O. Rogers, E. K. Bardenhagen / Open Journal of Ecology 3 (2013) 343-353 351 tion that the function of the lighthouse would be replaced as it is separated from the other historic resources. Threatened species tend to share a similar space (i.e., factor scores are not significantly different, p > 0.15) although reaching far less functional quality with the piping plover being the lowest functional quality score among all resources. While habitats are visually over- lapped with threatened species, they afford significantly higher scores on both functional and aesthetic quality (p < 0.05). 6. DISCUSSION While each resource is valued individually, they are valued in the context of the place. The value of a park is more than any single resource (or for that matter) the sum of all resources. The uniqueness of the place lies in the interconnections among resources, their independ- ence, codependence, and the subtle combination of re- sources that combine to create a unique whole. Like the combination of spices in a gourmet meal coming to- gether subtly to form the whole, the resources of a place combine to create value-space associated with the place. This can be seen as the “capital” upon which the park draws in order to provide recreational and cultural ser- vices [20]. As multiple dimensions of value are brought together in a complex admixture, these subtleties become more intricate and unique; and the value of the place increases. The two-dimensional value-space presents the pattern of relationships between resources relative to one another that inform resource management, environmental planning, and policy. As reported above, all the resources represented in the upper-left quadrant of the value-space are infrastructural, and 57.1% of all infrastructural resources are located in this quadrant. Historical resources, along with many en- vironmental resources, dominate the lower-right quadrant, with 84.6% of historical resources and 60.0% of the en- vironmental resources being located in this quadrant. Specific endangered species are located near the bot- tom-middle of the value-space, with near-zero aesthetic quality and negative functional quality. This seems to reflect the intrinsic value of endangered species. The endangered species are neutral to the observable aes- thetic quality as less likely to be experienced directly than other environmental resources (e.g., maritime for- ests, dunes and beaches, and salt marshes), which are more positively located with respect to aesthetic quality. This is consistent with the idea that endangered species have value beyond simple mortality as irreplaceable in- dicators of environmental health. They are valued as once-gone-forever-lost resources that have value because of their mere existence, even if they are never directly experienced. The Shackleford Banks Horses, Cape Lookout Lighthouse, Maritime Forests, Dune and Beach Systems, Tidal Flats, and Salt Marshes are more likely to impact directly an aesthetic environmental experience than endangered species; and these aesthetic environ- mental experiences are characterized by strongly positive aesthetic quality and near neutral functional quality. The place-based resource-driven method of valuing resources presented herein is clearly within the realm of participatory valuation. It represents a specific systematic method to quantitatively codify the nature of values as- sociated with a place and treats identifiable resources as the objects of value in the place. In the development of various objectives and alternatives, the value-space iden- tifies resources of similar perceived value, which help to define, shape and establish the nature of the problem. Decision and policy makers, planners and resource managers can use the value-space to associate, or disas- sociate outcomes and alternatives. For example, the case of Cape Lookout, resource managers are well aware of the central role of the Cape Lookout Lighthouse and the Shackleford Banks Horses, but may be less aware of the similarity of the role that salt marshes, dune and beach systems seem to have in establishing aesthetic environ- mental experiences. The value-space also helps resource managers and policy makers determine the boundary of the problem and potential solutions. For example, the geographic impact zone of the Cape Lookout Lighthouse is quite large—encompassing not only the visible-line- of-sight, which is large; but it has become a symbolic icon of the entire region, which is even larger. These im- pacts of resources often extend beyond geographic boundaries (e.g., the park boundary) well into contextual boundaries, which the value maps can help clarify. An- other decision criterion might consider the extent to which the various alternatives treat resources that are grouped together in the value-space in a similar fashion. The place-based method discussed herein establishes communities-of-resources that either hold similar per- ceived value to the place or are grouped geographically, which highlights the potential consequences of environ- mental choices. The place-based resource-driven valuation provides decision processes with a methodology that codifies, quantifies and visualizes the relationship between resour- ces and underlying values. This process: establishes an inventory of resources (e.g., natural, historical and infrastructural) that are of value to the place; establishes the full-range of potential types of value associated with significant resources; quantitatively assesses the significant resources of the place for each type of value and any potential inter- actions among value-types; provides insights that shape boundary conditions, and impact zones for each resource and the place as a Copyright © 2013 SciRes. OPEN ACCESS  G. O. Rogers, E. K. Bardenhagen / Open Journal of Ecology 3 (2013) 343-353 352 whole; visually illustrates similarities and differences among resources in terms of the underlying value-space; and establishes communities-of-resources within value- structures to illustrate interdependencies among re- sources. Natural resource managers, environmental planners, and historical resource guardians are often faced with decisions that require assessment of non-market values. While these intrinsic values are recognized as important, efforts to account for them often rely on qualitative in- terpretation of the significance and value of these re- sources. The place-based resource-driven method pre- sented herein, supplements these methods by quantifying the value associated with these resources along multiple dimensions. This method quantifies expressed prefer- ences for various resources, in similar fashion to other empirical quantitative methods (e.g., contingent valua- tion or willingness-to-pay). Each can be used independ- ently, or combined to provide a stronger empirical quan- titative basis for non-arbitrary environmental decisions impacting ecological resources. 7. CONCLUSION This article presents a pilot effort to identify a meth- odology to more efficiently codify, quantify and illustrate the intrinsic values associated with ecological resources. The benefits of analyzing a single national park such as Cape Lookout National Seashore include, a definitive boundary within which to operate, a pre-existing invent- tory of natural and cultural resources, and a highly knowledgeable dedicated park staff to inform the process. The focus of this research has been on the valuation of the pre-existing ecological resources of the park. Throu- gh iterative discussions with park staff five value-types were selected for consideration. Natural and historical re- sources selected among the top-ten by stakeholders were rated through a web-based survey. Factor analysis of these data confirms the existence of a two dimensional value-space. Factor analysis is particularly well-suited for this endeavor as it, 1) focuses on significant dimen- sions by selecting the factor that accounts for the most variance in the joint distribution of resources, iteratively followed by the additional factor(s) that account for the most remaining variance, 2) selects dimensions those are orthogonal to each other and thereby independent of each other, and 3) converts all values to a standardized ab- stract metric to facilitate comparison. The resulting val- ue-space has two dimensions that are connected, at least loosely, with aesthetic quality on the horizontal-axis and functional quality on the vertical-axis. The present pilot research is intended to explore the potential to measure values associated with ecological resources in multiple dimensions. While it has shown that multiple dimensions of value can be measured quan- titatively, it represents only one national park, where a concentration of historical and natural resources is lo- cated primarily on barrier islands with no bridges. It is not possible to know from these results the extent to which these values generalize to similar parks, parks with similar resources and greater access, parks that en- compass communities, other kinds of parks, or commu- nities in general. This effort took advantage of extensive discussions with long-term park staff members in devel- oping the types of values that were likely to be associ- ated with park resources, but this could mean that other kinds of values may have been inadvertently omitted (e.g., peace and tranquility, repository of biodiversity or cultural heritage, or economic stimulus). While it is clear that any finite set of value-types will always exclude potential alternative value-types, a systematic approach involving all stakeholders would help assure that the range of value-types considered represent a full-range of potentially important values. As a pilot study this re- search draws on a limited respondent sample, but results in a relatively shared value structure that includes an adequate number of resources to support the analysis. Without the park to focus and sharpen public attention on specific natural and cultural resources, more diffuse value structures may prove difficult to characterize in terms of vague or loosely associated resources (e.g., the people, our children, leadership or friendliness). Future research will extend the present effort by ex- amining various parks and their resources. This research will begin to clarify the extent to which the pattern of resources and valuations is stable or variable, unique or shared, global or local and to what extent generalizable. The extent to which park with similar resources under various conditions share common elements of the value- space, and the extent to which the value-spaces are unique is an important guide to the kinds of policies and plans that are likely to meet with success in the National Park Service as a whole. The extent of temporal stability of the value-space is an important determinant of the ongoing need for public participation. Similarities and differences among groups’ value-spaces can inform re- source managers about appropriate actions. For example, comparing the value-space for two or more groups of various interests may be used to inform conflict resolu- tion efforts. The impacts of climate change are expected to have serious impacts on barrier island parks. Future research following the approach developed herein makes it possi- ble to preview impacts to the overall resource-base as various resources are lost or threatened (e.g., to sea level rise, hurricane damage, or tidal surges). Some resources have the potential to be protected or moved to safer loca- tions, others may relocate naturally; still others may be Copyright © 2013 SciRes. OPEN ACCESS  G. O. Rogers, E. K. Bardenhagen / Open Journal of Ecology 3 (2013) 343-353 Copyright © 2013 SciRes. 353 restored or reconstructed as replicas of historic resources. The place-based resource-driven approach allows for these potential outcomes to be quantified so that impacts on various resources and alternatives can be compared. Such comparisons can be achieved in the context of their geographic location(s) and the potential area of influence associated with that resource (e.g., through view-sheds, or access zones). In other words each resource can be located on a geographic map, and the impact zone con- sidered (e.g., perhaps values depicted as contours on the map), so that resources can be bundled with their values in decision making and planning. OPEN ACCESS REFERENCES [1] Ciriacy-Wantrup, S.V. (1947) Capital returns from soil- conservation practices. Journal of Farm Economics, 29, 1181-1196. doi:10.2307/1232747 [2] Davis, R.K. (1963) The value of outdoor recreation an economic study of the Maine woods. Harvard University, Cambridge. [3] Krutilla, J.V. (1967) Conservation reconsidered. The American Economic Review , 57, 777-786. [4] Portney, P.R. (1994) The contingent valuation debate: Why economists should care. The Journal of Economic Perspectives, 8, 3-17. doi:10.1257/jep.8.4.3 [5] Beatley, T. (1994) Ethical land use: Principles of policy and planning. Johns Hopkins University Press, Baltimore. [6] Shafer Jr., E.L. and Brush, R.O. (1977) How to measure preferences for photographs of natural landscapes. Land- scape Planning, 4, 237-256. doi:10.1016/0304-3924(77)90027-2 [7] Carlson, A.A. (1977) On the possibility of quantifying scenic beauty. Landscape Planning, 4, 131-172. doi:10.1016/0304-3924(77)90015-6 [8] Ribe, R.G. (1982) On the possibility of quantifying scenic beauty—A response. Landscape Planning, 9, 61-74. doi:10.1016/0304-3924(82)90011-9 [9] Gobster, P.H. (2008) Yellowstone hotspot: Reflections on scenic beauty, ecology, and the aesthetic experience of landscape. Landscape journal, 27, 291. [10] Antrop, M. (2005) Why landscapes of the past are impor- tant for the future. Landscape and Urban Planning, 70, 21-34. doi:10.1016/j.landurbplan.2003.10.002 [11] Bingham, G., et al. (1995) Issues in ecosystem valuation: Improving information for decision making. Ecological Economics, 14, 73-90. doi:10.1016/0921-8009(95)00021-Z [12] Loomis, J.B. (2000) Environmental valuation techniques in water resource decision making. Journal of Water Re- sources Planning and Management, 126, 339-344. doi:10.1061/(ASCE)0733-9496(2000)126:6(339) [13] Committee on Assessing and Valuing the Services of Aquatic and Related Terrestrial Ecosystems and National Research Council (2005) National Research Council, Valuing ecosystem services toward better environmental decision-making. National Academies Press, Washington, DC. [14] Arrow, K.J., et al. (1996) Is there a role for benefit-cost analysis in environmental, health, and safety regulation? Science, 272, 221-222. doi:10.1126/science.272.5259.221 [15] Kelman, S. (1981) Cost-benefit analysis: An ethical cri- tique. Regulation, 5, 33-40. [16] Seip, K.L. and Wenstop, F. (2006) A primer on environ- mental decision-making an integrative quantitative ap- proach. [17] Noble, B.F. (2006) Introduction to environmental impact assessment: a guide to principles and practice. Oxford University Press, Don Mills. [18] National Park Service, Cape Lookout National Seashore. As accessed on October 12, 2010. http://www.nps.gov/calo/planyourvisit/upload/CALOmap 2.pdf [19] NPS Scientific Monograph (2004) National Park Service, Barrier Island Ecology of Cape Lookout National Sea- shore and Vicinity. North Carolina. [20] Hawken, P., Lovins, A.B. and Lovins, L.H. (1999) Natu- ral capitalism: Creating the next industrial revolution. Lit- tle, Brown and Co., Boston.
|