Paper Menu >>
Journal Menu >>
 Vol.2, No.12, 1377-1381 (2010) Health doi:10.4236/health.2010.212204 Copyright © 2010 SciRes. Openly accessible at http://www.scirp.org/journal/HEALTH/ Change in stature by walking and running at a preferred transition speed Shinichi Demura1, Takayoshi Yamada2*, Tamotsu Kitabayashi3, Masanobu Uchiyama4 1Kanazawa University, Graduate School of Natural Science & Technology Kakuma, Kanazawa, Ishikawa, Japan; demuken@ed.kanazawa-u.ac.jp; 2Fukui National College of Technology, Department of Health & Physical Education Geshi, Sabae, Fukui, Japan; *Corresponding Author: takay@fukui-nct.ac.jp; 3 Tokyo University of Science, Department of Physical Education and Sports Science, 1-3 Kagurazaka Shinjuku-ku, Tokyo, Japan; kitabaya@rs.kagu.tus.ac.jp; 4Akita Prefectural University, Research and Education Center for Comprehensive Science 241-438 Kaidobata-Nishi Nakano Shimo- shinjo Akita City, Japan. uchiyama@akita-pu.ac.jp Received 12 September 2010; revised 2 October 2010; accepted 9 October 2010 ABSTRACT This study aimed to measure stature changes during and after walking and running at a pre- ferred transition speed (PTS) and the recovery period, and to examine differences caused by loads imposed on the spinal column. Seven males and three females aged 22-41 years took part in this study. Subjects The subjects un- derwent 15 minutes of walking or running on a treadmill in a random order. Stature changes were measured during each exercise at inter- vals of 5 minutes and after a 20 minute standing recovery period within units of 0.01 mm. Two- way ANOVA revealed that both main factors, gait (F = 5.250, P < 0.05) and elapsed time (F = 14.409, P < 0.05), had a significant effect on stature. In the post hoc test, stature shrank w ith time and its loss was found to be greater in running than in walking, but recovered after both exercises. In conclusion, the spinal load in- creases with time during both walking and run- ning at PTS, but is greater in running than in walking. After both exercises, spinal shrinkage shows a similar recovery process and recovers faster in walking to its pre-exercise level. Keywords: Preferred Transition Speed; Wal king; Running; Change in Stature; Spinal Shrinkage 1. INTRODUCTION Walking and running are fundamental modes in hu- man locomotion. Until now, the preferred transition speed (PTS) between walking and running has been stu- died from various viewpoints and it has been found that the energy cost of locomotion would not be the trigger to determine its speed [1]. In short, the energy consumed by running that exceeds walking is at a faster level than PTS [1]. It has also been also known that the burden of the dorsiflexor muscles of the ankle [2,3], force produc- tion of plantar flexors of the ankle [4], and peak ante- rior/posterior and vertical ground reaction forces during the propulsion phase [4] relate to the PTS. In other words, the mechanical stress to the muscular- skeletal system is considered to be an important factor in decid- ing the transition speed between walking and running. The PTS is a faster speed than walking, but slower one than running. It was reported to be about 2 m・s-1 in adults according to Hreljac [1], and is very close to the habitual walker’s pace (average of 1.78 m・s-1; Spelman et al.[5]) or brisk walking pace for fitness training (av- erage of 1.76 m・s-1; Hardman and Hudson. [6]). In ad- dition, it would be comparable to the “jogging” pace. Thus, PTS may be an exercise intensity that corresponds to an aerobic training level in healthy adults. Recently, there has been a focus on the necessity of appropriate daily activity. A mode of walking or running is a useful means of fitness training and can be easily performed by people of all ages. Therefore, information on the safety of these modes of exercise is very important. Even at the same speed, walking has a smaller impact force as com- pared to running [7-9]. In addition, walking has merits such as lower intensity and low risks to th e cardiovascu- lar system. These are undoubtedly reasons why walking is widely recommended as a mode of exercise. On the other hand, from the prevention of back injuries, many researchers have studied an exact change of stature to evaluate the spinal load imposed by various tasks or ex- 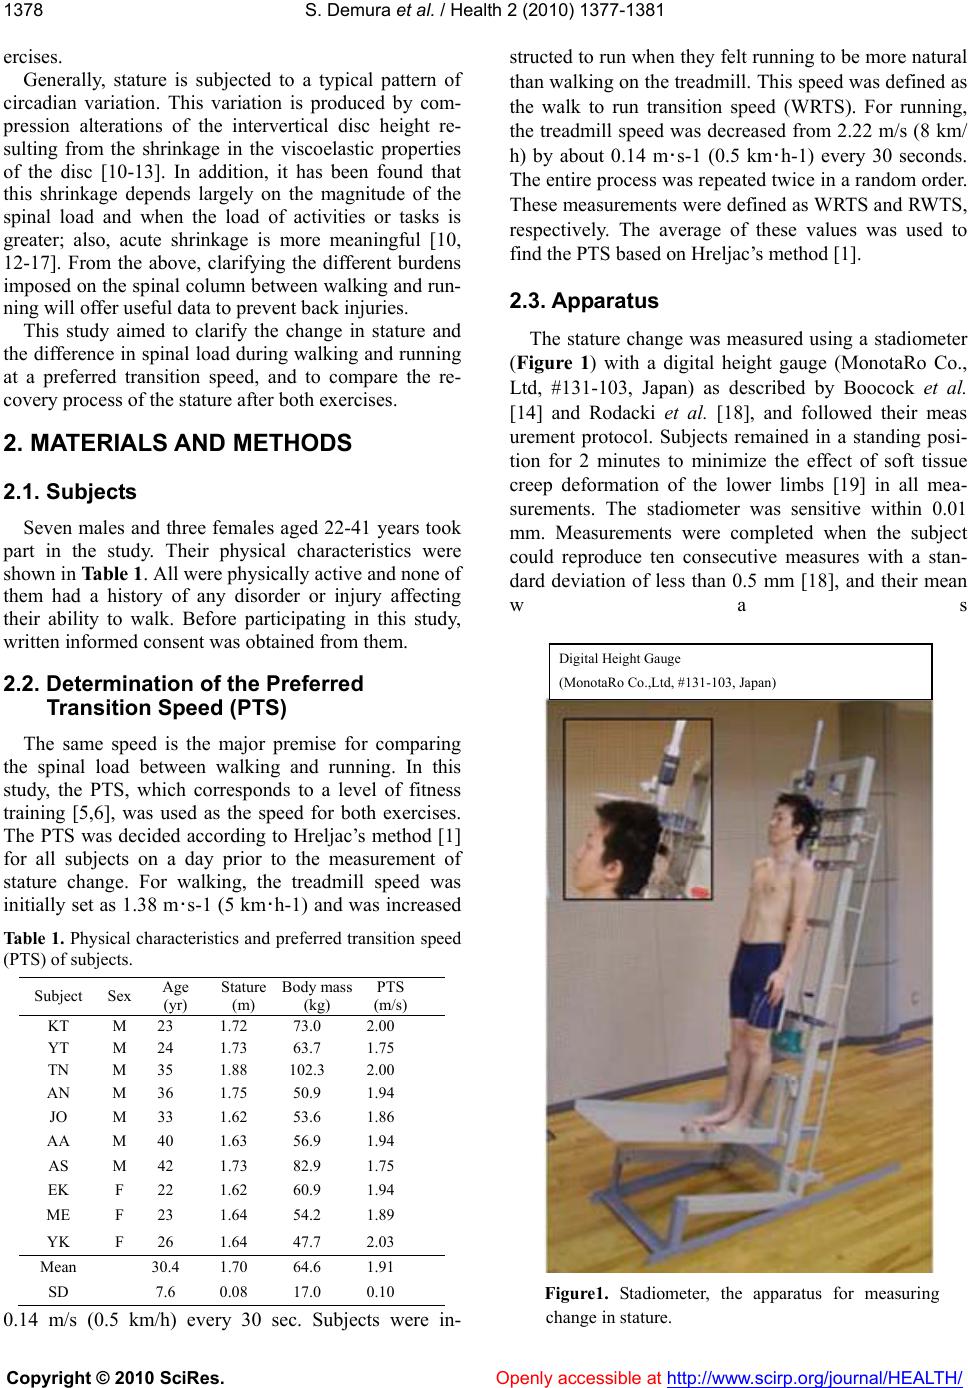 S. Demura et al. / Health 2 (2010) 1377-1381 Copyright © 2010 SciRes. Openly accessible at http://www.scirp.org/journal/HEALTH/ 1378 ercises. Generally, stature is subjected to a typical pattern of circadian variation. This variation is produced by com- pression alterations of the intervertical disc height re- sulting from the shrinkage in the viscoelastic properties of the disc [10-13]. In addition, it has been found that this shrinkage depends largely on the magnitude of the spinal load and when the load of activities or tasks is greater; also, acute shrinkage is more meaningful [10, 12-17]. From the above, clarifying the different burdens imposed on the spinal column between walking and run- ning will offer useful data to prevent back injuries. This study aimed to clarify the change in stature and the difference in spinal load during walking and running at a preferred transition speed, and to compare the re- covery process of the stature after both exercises. 2. MATERIALS AND METHODS 2.1. Subjects Seven males and three females aged 22-41 years took part in the study. Their physical characteristics were shown in Table 1. All were physically active and none of them had a history of any disorder or injury affecting their ability to walk. Before participating in this study, written informed consent was obtained from them. 2.2. Determination of the Preferred Transition Speed (PTS) The same speed is the major premise for comparing the spinal load between walking and running. In this study, the PTS, which corresponds to a level of fitness training [5,6], was used as the speed for both exercises. The PTS was decided according to Hreljac’s method [1] for all subjects on a day prior to the measurement of stature change. For walking, the treadmill speed was initially set as 1.38 m・s-1 (5 km・h-1) and was increased Tab le 1. Physical characteristics and preferred transition speed (PTS) of subjects. Subject Sex Age (yr) Stature (m) Body mass (kg) PTS (m/s) KT M 23 1.72 73.0 2.00 YT M 24 1.73 63.7 1.75 TN M 35 1.88 102.3 2.00 AN M 36 1.75 50.9 1.94 JO M 33 1.62 53.6 1.86 AA M 40 1.63 56.9 1.94 AS M 42 1.73 82.9 1.75 EK F 22 1.62 60.9 1.94 ME F 23 1.64 54.2 1.89 YK F 26 1.64 47.7 2.03 Mean 30.4 1.70 64.6 1.91 SD 7.6 0.08 17.0 0.10 0.14 m/s (0.5 km/h) every 30 sec. Subjects were in- structed to run wh en they felt running to be more natural than walking on the treadmill. This speed was d efined as the walk to run transition speed (WRTS). For running, the treadmill speed was decreased from 2.22 m/s (8 km/ h) by about 0.14 m・s-1 (0.5 km・h-1) every 30 seconds. The entire process was repeated twice in a random order. These measurements were defined as WRTS and RWTS, respectively. The average of these values was used to find the PTS based on Hreljac’s method [1]. 2.3. App aratus The stature change was measured using a stadiometer (Figure 1) with a digital height gauge (MonotaRo Co., Ltd, #131-103, Japan) as described by Boocock et al. [14] and Rodacki et al. [18], and followed their meas urement protocol. Subjects remained in a standing posi- tion for 2 minutes to minimize the effect of soft tissue creep deformation of the lower limbs [19] in all mea- surements. The stadiometer was sensitive within 0.01 mm. Measurements were completed when the subject could reproduce ten consecutive measures with a stan- dard deviation of less than 0.5 mm [18], and their mean was Digital Height Gauge (MonotaRo Co.,Ltd, #131-103, Japan) Figure1. Stadiometer, the apparatus for measuring change in stature.  S. Demura et al. / Health 2 (2010) 1377-1381 Copyright © 2010 SciRes. Openly accessible at http://www.scirp.org/journal/HEALTH/ 1379 used as a representative value. For example, when the standard deviation of ten consecutive measures was larger than 0.5 mm, the ten consecutive measurements were repeated. 2.4. Experimental Procedure Subjects participated in walking and running experi- ments with PTS intensity at the same time slot (08:00- 12:00). They were required to refrain from stressful physical activities which are more strenuous than walk- ing for 24 hours before the experiment, to stand for a period of 20 minutes to distribute their weight evenly and to standardize and control any abnormal spinal loading or unloading before the experiment. The subjects then underwent walking or running for 15 minutes on the treadmill in a random order. Their stature was meas- ured prior to ( as a baseline) and duⅠring each exercise at intervals of 5 minutes. In brief, three measurements with a set of 10 consecutive measurements [20] were carried out at walking or running for 5, 10, and 15 mi- nutes intervals (,Ⅱ , and ). In addⅢⅣ ition, the stature was finally measured () just after the 20 minute Ⅴstanding recovery. Exercise for health is generally over 10 mi- nutes [21]. Considering the above, we used 15 minutes for walking or running time. 2.5. Statistical Analysis Reliability coefficients were calculated from ten con- secutive measurements taken at each measurement pe- riod (, , , , and ). Stature changes were caⅠⅡⅢⅣ Ⅴl- culated by subtracting individual values of , , , ⅡⅢⅣ and from the valueⅤ of Ⅰ (baseline), respectively. The changes were analyzed using 2 factors, modes of exer- cise (gait: walking and running) by 4 periods of elapsed time (after 5, 10, 15 minutes, and recovery) analysis of variance (ANOVA) with repeated measurements of the last factor. A Scheffe post hoc test was used to clarify significant differences between two means. A prob ability level of less than 0.05 was set. 3. RESULTS Higher reliability coefficients in measurements of sta- ture changes were found with a range of 0.904-938 (Table 2). Figure 2 shows means and standard deviations of sta- ture changes following walking and running in each time interval including the recovery. ANOVA revealed that both main effects of gait (F = 5.250, P < 0.05) and elapsed time (F = 14.409, P < 0.05) were significant, but the int e- raction was insignificant (F = 1.653, P > 0.05). In short, the stature loss of walking was greater than that of running, and stature changes in both walking and running increased with time elapsed until the 15 minute Table 2. Reliability coefficients of 10 consecutives measure- ments at each period. Measurement period Walking Running Ⅰ 0.938 0.904 Ⅱ 0.928 0.912 Ⅲ 0.942 0.912 Ⅳ 0.930 0.912 Ⅴ 0.932 0.921 : before walking or running, : after walⅠⅡking or runnning for 5 min, : afteⅢr walking or running for 10 min, : after walking or Ⅳ running for 15 m in, : after recovery (20 min)Ⅴ 0 -1 -3 -4 -5 -6 -7 -2 1 Change of stature (mm) 51510 Time (min) * ** P<0.05 * 35 Exercise Recovery * Figure 2. Means and 1SDs of the change of stature af- ter exercises (walking and running) and recovery. interval. In the post hoc test, a significant difference in stature change was found between time intervals except for between the 10 and 15 minute intervals. On the other hand, the stature loss was significantly recovered and got closer to the baseline after the recovery period. 4. DISCUSSION Most research that investigated the accurate stature change have used a technique in which ten consecutive measurements reached stable data within a standard deviation of less than 0.5 mm [10,12-18]. However, the reliability of measurements by this technique has been not examined. Reliability coefficients of more than 0.9 were confirmed in this study. Thus, it was judged to be a valid technique. Circadian variation of stature has been known to be 19.3 mm or 1.1% of overall stature [11]. As another perspective, the stature change has been widely studied as an index of spinal load (spinal shrinkage) in ergonomics [22]. For example, it was found that the greater load (stimulus) of the gravity to the spine would Walking ● Running □  S. Demura et al. / Health 2 (2010) 1377-1381 Copyright © 2010 SciRes. Openly accessible at http://www.scirp.org/journal/HEALTH/ 1380 afford the reasonable stature change from results of sev- eral studies on stature changes in the drop jump [10,14] or weightlifting [15,16] and walking in obese people [20]. In addition, it was also reported that these acute changes (losses) in stature would recover after exercise or tasks [10,14]. The present stature losses following walking and running at PTS were significant and marked between the 5 and 10 minute interval, being also signifi- cant between 5 and 15 minutes, but not between 10 and 15 minutes. Based on Reilly et al.’s report [11], the cir- cadian variation of the stature of the present subjects is estimated to be about 18.7 mm (170 cm × 0.011) on the basis of mean height (1.7 m). Average losses of stature while walking (2.5 mm) and running (4.2 mm) for 15 minutes at PTS were respectively 13.4% and 22.5% of the circadian variation. In addition, the stature loss by both exercises increased with time. Assuming active times of day excluding sleep time as 16 hours, the ratio of the stature loss in the circadian variation is estimated to be 0.019 mm・min-1 (18.7 mm/960 min). In contrast, a loss rate of the stature was 0.17 mm・min-1 in walking and 0.28 mm・min-1 in running. In short, a larger loss rate is considered to occur during exercise. The change after 15 minutes of exercise is especially larger in run- ning than in walking. It was reported that ground reac- tion forces at the same speed are greater in running than in walking [7-9]. In short, the spinal load is greater in running. The difference of this impact force may pro- duce a difference in stature loss. The recovery of the absolute stature loss (spinal shrinkage) within the same time (20 minutes), on average, was almost the same in walking (1.5 mm) and running (1.6 mm). However, when calculating the statu re loss after 15 minutes as cri- teria, the recovery rate was estimated to be 58% in walking and 39% in running. Thus, the recovery period shows a similar recovery process in walking and running, but, after 15 minutes, the recovery may be faster in walking than in running because of the smaller spinal load. Rodacki et al. [20] reported that the stature loss in the non-obese (aged 22.4 yr on average) was found to be 3.00 mm (estimated from a figure) and 3.55 mm follow- ing walking for 15 and 30 minutes, respectively. Ac- cording to Garbutt et al. [17], the stature loss in mara- thon runners decreased to 3.26 mm and 7.69 mm after running at a normal marathon pace for 15 minutes and 30 minutes, respectively. The stature loss after running for 15 minutes in this study was very similar to that in the above studies. In addition, the stature loss after 15 minutes in the above studies tended to be relatively small. A difference in stature change between 10 and 15 minutes in this study was not found either. Hence, the stature change (loss) may be greater just after beginning exercise. This may be associated with the viscoelasticity of intervertical discs, in which the shape of the disc changes rapidly in th e initial stage of the exercise or task, and is followed by an exp elling of fluid from the nu cleus pulposus [20,23]. It is known that reducing the interver- tical disc height (spinal shrinkage) decreases the ability of the disc to absorb and transmit forces, and the resis- tance to failure [24]. In addition, the spinal shrinkage associated with compressed intervertical discs is be- lieved to increase susceptibility to spinal injuries. As epidemiological data, it was reported that there is a sig- nificant relationship between lumbar disorders and tasks involving heavy manual lifting [25]. Regular sports par- ticipants also have been id entified as a high risk popula- tion for back injuries because of repeated high impact forces [26]. 5. CONCLUSIONS In conclusion, the spinal load is greater in running than in walking at PTS, and increases as time elapses during exercise. The recovery process of the spinal load is similar in both walking and running after exercise, but the degree of recovery of the stature loss to the pre-exercise level is faster in walking. Hence, walking can be recommended as a mode of fitness training rather than running for the safety of the spin e or for the preven- tion of back injuries. REFERENCES [1] Hreljac, A. (1993) Preferred and energetically optimal gait transition speeds in human locomotion. Medicine and Science in Sports and Exercise, 25, 1158-1162. [2] Hreljac, A. (1995) Determinants of the gait transition speed duri ng huma n l ocomoti on: ki nema tic f actors. Journal of Biomechanics, 28, 669-677. [3] Hreljac, A., Imamura, R.T., Escamilla, R. F., Edwards, W. B. and MacLeod, T. (2008) The relationship between joint kinetic factors and the walk-run gait transition speed during human locomotion. Journal of Applied Biomechanics, 24, 149-157. [4] Neptune, R.R. and Sasaki, K. (2005) Ankle plantar flexor force production is an important determinant of the pre- ferred walk-to-run transition speed. Journal of Experi- mental Biology, 208, 799-808. [5] Spelman, C.C., Pate, R. R., Macera, C. A. and Ward, D. S. (1993) Self-selected exercise intensity of habitual walk- ers. Medicine and Science in Sports and Exercise, 25, 1174-1179. [6] Hardman, A.E. and Hudson, A. (1994) Brisk walking and serum lipid and lipoprotein variables in previously se- dentary women—effect of 12 weeks of regular brisk walking followed by 12 weeks of detraining. British Journal of Sports Medicine, 28, 261-266. [7] Cavanagh, P.R. and Lafortune, M.A. (1980) Ground reaction force in distance running. Journal of Biome- chanics, 13, 397-406.  S. Demura et al. / Health 2 (2010) 1377-1381 Copyright © 2010 SciRes. Openly accessible at http://www.scirp.org/journal/HEALTH/ 1381 [8] Chao, E., Laughman, R., Schneider, E. and Stauffer, R. (1983) Normative data of knee joint motion and ground reaction force in adult level walking. Journal of Biome- chanics, 16, 219-233. [9] Nilsson, J. and Thorstensson, A. (1989) Ground reaction forces at different speeds of human walking and running. Acta Physiologica Scandinavica, 136, 217-227. [10] Fowler, N. E. and Reilly, T. (1997) Changes in stature following plyometric drop-jump and pendulum exercises. Ergonomics, 40, 1279-1286. [11] Reilly, T., Tyrrell, A. and Troup, J.D.G. (1984) Circadian variation in human stature. Chronobiology International, 1, 121-126. [12] Reilly, T., Boocock, M.G., Garbutt, G., Troup, J.D. and Linge, K. (1991) Change in stature during exercise and sports training. Applied Ergonomics, 22, 308-311. [13] Reilly, T. and Freeman, A. (2006) Effects of loading on spinal shrinkage in males of different age groups. Ap- plied Ergonomics, 37, 305-310. [14] Boocock, M.G., Garbutt, G., Reilly, T. and Troup, D. G. (1990) Change in stature following drop jumping and post-exercise gravity inversion. Medicine and Science in Sports and Exercise, 22, 385-390. [15] Bourne, N.D. and Reilly, T. (1991) Effect of a weightlifting belt on spinal shrinkage. British Journal of Sports Medicine, 25, 209-212. [16] Fowler, N.E. and Reilly, T. (1994) Spinal shrinkage in unloaded and loaded drop-jumping. Ergonomics, 37, 133 -139. [17] Garbutt, G., Boocock, M.G., Reilly, T. and Troup, J.D.G. (1990) Running speed and spinal shrinkage in runners with and without low back pain. Medicine and Science in Sports Exercise, 22, 769-772. [18] Rodacki, C.L.N., Fowler, N.E., Rodacki, A.L.F. and Birch, K. (2001) Repeatability of measurement in deter- mining stature in sitting and standing posture. Ergonom- ics, 12, 1076-1085. [19] Foreman, T.K. and Linge, K. (1989) The importance of heel compression in the measurement of diurnal stature variation. Applied Ergonomics, 20, 299-300. [20] Rodacki, A.L.F., Fowler, N.E., Provensi, C.L.G., Rodacki, C.L.N. and Dezan, V. H. (2005) Body mass as a factor in stature change. Clinical Biomech an ic s, 20, 799-805. [21] Haskell, W.L., Lee, I.M., Pate, R.R., Powell, K.E., Blair, S.N., Franklin, B.A., Macera, C. A., Heath, G.W., Thompso n, P.D. and Bauman, A. (2007) Physical activity and public health: Updated recommendation for adults from the American College of Sports Medicine and the American Heart Association. Medicine and Science in Sports and Exercise, 39, 1423-1434. [22] Corlett, E.N., Eklund, J.A.E., Reilly, T. and Troup, J.D.G. (1987) Assessment of workload from measurement of stature. Applied Ergonomics, 18, 65-71. [23] Adams, M.A. and Dolan, P. (1995) Recent advances in lumbar spinal mechanics and their clinical significance. Clinical Biomechani c s, 10, 3-19. [24] Perey, O. (1957) Fracture of the vertebral end plate in the lumbar spine: An experimental biomechanical investiga- tion. Acta Orthopaedica Scandinavica Supplementum, 25, 1-101. [25] Troup, J.D.G. (1965) Relation of lumbar spine disorders to heavy manual work and lifting. Lancet, 17, 857-861. [26] Alexander, M.J.L. (1985) Biomechanical aspects of lumbar spine injuries in athletes: a review. Canadian Journal of Applied Sport Sciences, 10, 1-20. |