Real-Time Air Monitoring of Trichloroethylene and Tetrachloroethylene Using Mobile TAGA Mass Spectrometry 101
the Hurricane Katrina response [16]. In 2010, US EPA
TAGA units monitored the BP oil spill in the Gulf of
Mexico along the Gulf Coast [17].
2.2. Real-Time On-Site Air Monitoring
Traditional analytical methods for measuring VOCs in
ambient air involve the collection of samples with ad-
sorbent cartridges or canisters, which are then trans-
ported to a laboratory and analyzed at a later time using
the gas chromatograph (GC), or the combination of MS
in single mode (GC/MS), or in tandem mode (GC/MS/
MS) [18]. While these methods are particularly useful for
low levels (μg/m3) [13], they are quite time consuming
due to sample transportation, VOCs thermal desorption,
GC column separation and analyte detection. The con-
centrations obtained using these methods are time aver-
aged response and no instantaneous levels are provided
during sampling. In addition, these off-site analysis tech-
niques are usually not useful during emergency situations
(e.g., at the site of chemical fire, chemical spill, and
chemical train derailment) when minute by minute deci-
sions are critical especially fast assessment to determine
the evacuation zones or whether affected areas are safe
for residents. TAGA provides unique approach to per-
form real-time on-site continuous monitoring of airborne
VOCs, allowing rapid and reliable evaluation during
emergency situations as well as routine field surveys.
A low pressure chemical ionization source (LPCI)
source has been developed for the TAGA to measure
ambient chlorinated hydrocarbons in real-time yielding
reliable quantitative results with a low detection limit yet
a wide range (i.e. 0 - 3000 μg/m3). The LPCI source,
normally operated at a pressure of 3.5 Torr and 55 μA, is
based on a glow discharge in the ionization region using
ambient air as the support gas [12,13]. It is interfaced to
the TAGA triple quadrupole (Q1, Q2, Q3) MS. Airborne
chemicals undergo charge transfer reactions with reagent
ions (typically NO+, 2 and 2
O) to yield parent ions
which are mass analyzed in the quadrupole Q1 region,
dissociated in the Q2 region and, the daughter ions are
identified in the Q3 region. The monitoring of parent/
daughter (P/D) ions is used to identify airborne chemi-
cals and determine their concentrations.
N
2.3. Identification
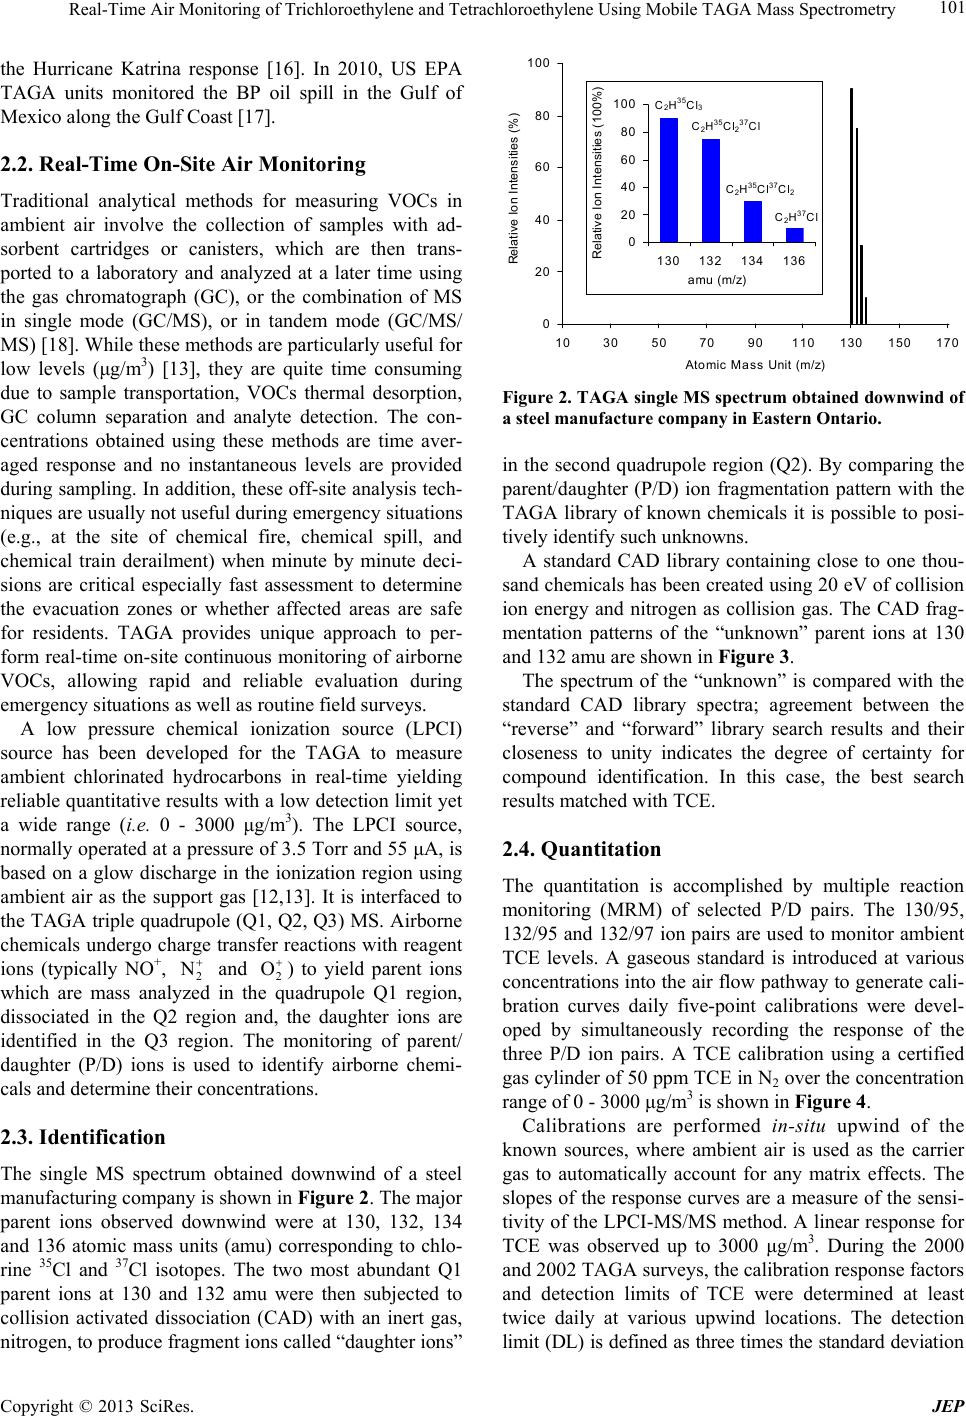
The single MS spectrum obtained downwind of a steel
manufacturing company is shown in Figure 2. The major
parent ions observed downwind were at 130, 132, 134
and 136 atomic mass units (amu) corresponding to chlo-
rine 35Cl and 37Cl isotopes. The two most abundant Q1
parent ions at 130 and 132 amu were then subjected to
collision activated dissociation (CAD) with an inert gas,
nitrogen, to produce fragment ions called “daughter ions”
0
20
40
60
80
100
1030507090110 130 150 170
Atomic Ma s s Unit (m/z)
Relative Ion Intensities (%)
0
20
40
60
80
100
130 132 134 136
Relative Ion Intensities (100%)
amu (m/z)
C2H35Cl237Cl
C2H35Cl3
C2H35Cl37Cl2
C2H37Cl
Figure 2. TAGA single MS spectrum obtained downwind of
a steel manufacture company in Eastern Ontario.
in the second quadrupole region (Q2). By comparing the
parent/daughter (P/D) ion fragmentation pattern with the
TAGA library of known chemicals it is possible to posi-
tively identify such unknowns.
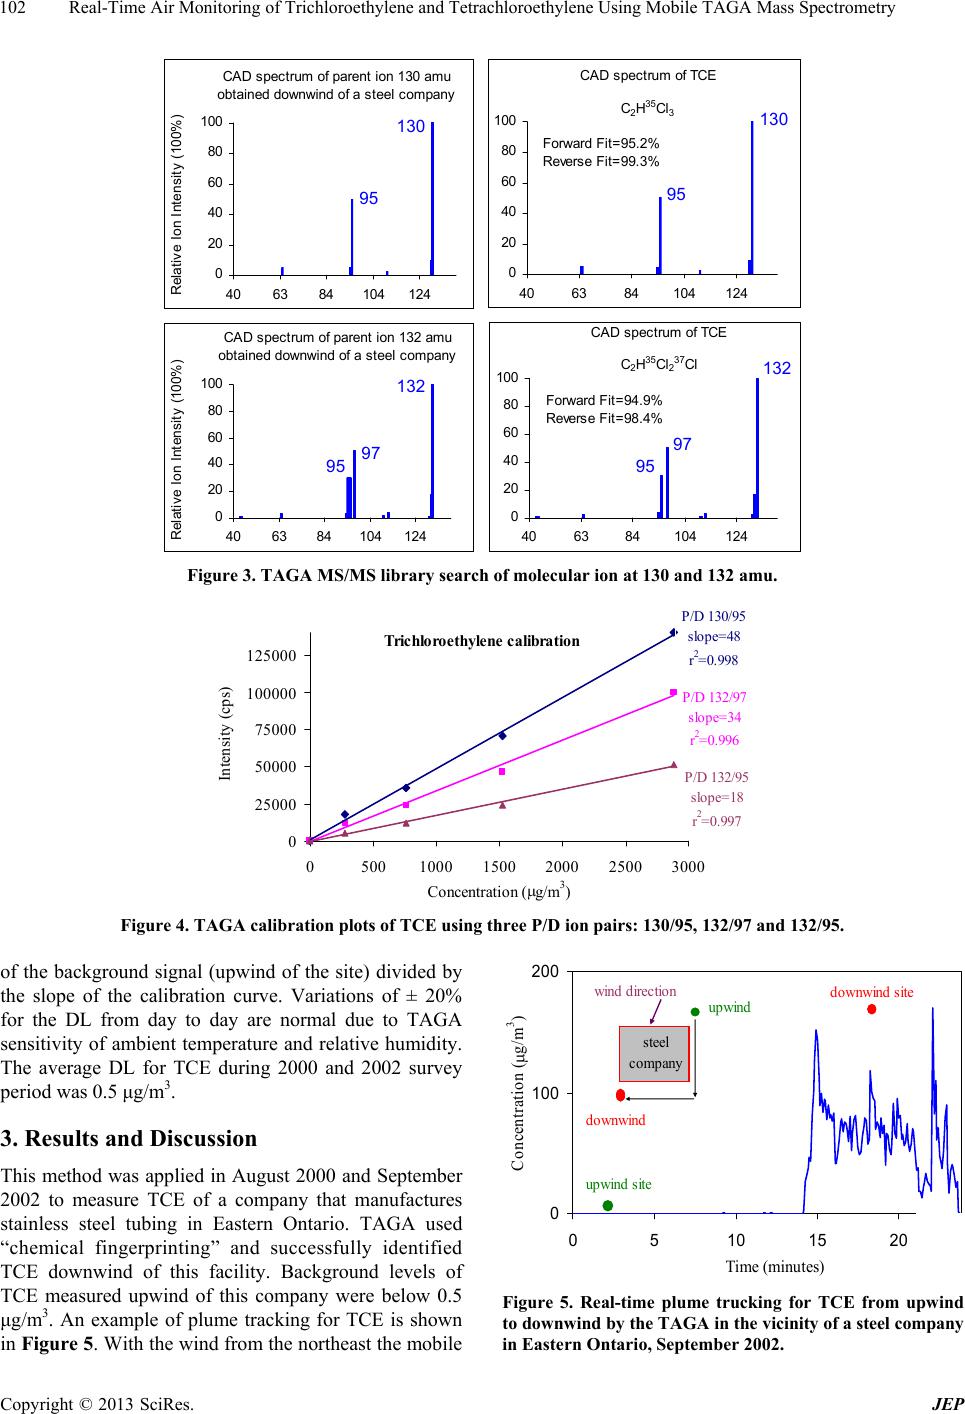
A standard CAD library containing close to one thou-
sand chemicals has been created using 20 eV of collision
ion energy and nitrogen as collision gas. The CAD frag-
mentation patterns of the “unknown” parent ions at 130
and 132 amu are shown in Fi gure 3.
The spectrum of the “unknown” is compared with the
standard CAD library spectra; agreement between the
“reverse” and “forward” library search results and their
closeness to unity indicates the degree of certainty for
compound identification. In this case, the best search
results matched with TCE.
2.4. Quantitation
The quantitation is accomplished by multiple reaction
monitoring (MRM) of selected P/D pairs. The 130/95,
132/95 and 132/97 ion pairs are used to monitor ambient
TCE levels. A gaseous standard is introduced at various
concentrations into the air flow pathway to generate cali-
bration curves daily five-point calibrations were devel-
oped by simultaneously recording the response of the
three P/D ion pairs. A TCE calibration using a certified
gas cylinder of 50 ppm TCE in N2 over the concentration
range of 0 - 3000 μg/m3 is shown in Fi gure 4.
Calibrations are performed in-situ upwind of the
known sources, where ambient air is used as the carrier
gas to automatically account for any matrix effects. The
slopes of the response curves are a measure of the sensi-
tivity of the LPCI-MS/MS method. A linear response for
TCE was observed up to 3000 μg/m3. During the 2000
and 2002 TAGA surveys, the calibration response factors
and detection limits of TCE were determined at least
twice daily at various upwind locations. The detection
limit (DL) is defined as three tmes the standard deviation i
Copyright © 2013 SciRes. JEP