 Journal of Environmental Protection, 2013, 4, 57-64 http://dx.doi.org/10.4236/jep.2013.48A1008 Published Online August 2013 (http://www.scirp.org/journal/jep) 57 An Analytical Formulation for Pollutant Dispersion Simulation in the Atmospheric Boundary Layer Glênio A. Gonçalves, Regis S. de Quadros, Daniela Buske* Federal University of Pelotas (UFPel), Department of Mathematics and Statistics (IFM/DME), Pelotas, Brazil. Email: *daniela.buske@ufpel.edu.br Received June 14th, 2013; revised July 16th, 2013; accepted August 3rd, 2013 Copyright © 2013 Glênio A. Gonçalves et al. This is an open access article distributed under the Creative Commons Attribution License, which permits unrestricted use, distribution, and reproduction in any medium, provided the original work is properly cited. ABSTRACT In this work we present the solution of the two-dimensional advection-diffusion equation by the GILTT method. The GILTT approach uses, in the series expansion, eigenfunctions given in terms of cosine functions. Here, a different ex- pansion for the solution of the advection-diffusion equation will be explored. In other words, a Sturm-Liouville problem carrying more information of the original problem is considered, given by Bessel functions. Numerical simulations and comparisons with experimental data are presented. Keywords: Analytical Solution; Advection-Diffusion Equation; Air Pollution Modeling; Integral Transform; Bessel Functions 1. Introduction The advection-diffusion equation has long been used to describe the dispersion of contaminants in the atmos- phere [1]. Efforts have been made over the years to ob- tain analytical solutions of this equation in order to mod- eling air pollution. According to [2,3], these solutions are valid for very specialized practical situations, and in ma- jority with restrictions on wind and eddy diffusivities vertical profiles [4-18]. To solve the advection-diffusion equation for more realistic physical scenario appeared in the literature the ADMM (Advection Diffusion Multi- layer Method) approach [19,20], valid for any eddy dif- fusivity and wind profile depending on the height. The main idea relies on the discretization of the Atmospheric Boundary Layer (ABL) in a multilayer domain, assuming in each layer that the eddy diffusivity and wind profile take averaged values. The resulting advection-diffusion equation in each layer is then solved by the Laplace Transform technique. A more general methodology, which skips the multilayer discretisation of the height z appear- ing in the ADMM approach, is known in the literature as GILTT (Generalized Integral Laplace Transform Tech- nique) approach [2,3,21]. The main idea of this method- ology relies on the expansion of the pollutant concentra- tion in series of eigenfunctions attained from an auxiliary Sturm-Liouville problem, replacement of this equation in the advection-diffusion equation and taking moments. The procedure results a matrix ordinary differential equa- tion which is solved analytically by the Laplace Trans- form technique. Similar solutions were proposed by [22, 23]. To reach our objective, we begin presenting the solu- tion of the two-dimensional advection-diffusion equation in Cartesian geometry by the GILTT approach [2], con- sidering that the eddy diffusivity and the vertical wind profile depend on the z variable. Traditionally, the GILTT approach uses as basis eigenfunctions given in terms of cosine functions. Here, another Sturm-Liouville problem will be considered, carrying more information of the original problem. In this case, the eigenfunctions are given by Bessel functions. Once we construct the general solution, numerical simulations and future per- spectives of this methodology are presented. 2. The Advection-Diffusion Equation and the GILTT Method For a Cartesian coordinate system the advection-diffu- sion equation, using first order closure of turbulence, is written like [24]: xyz cccc uvw txyz ccc KK xxyyzz S (1) *Corresponding author. Copyright © 2013 SciRes. JEP  An Analytical Formulation for Pollutant Dispersion Simulation in the Atmospheric Boundary Layer 58 where c denotes the average concentration of a passive (g/m3), u, v, w are the mean wind (m/s) components along the axis x, y and z, respectively and S is the source term. Kx, Ky, Kz are the Cartesian components of eddy diffusivity (m2/s) in the x, y and z directions, respectively. In the first order closure all the information on the turbu- lence complexity is contained in the eddy diffusivities. Problem (1) is solved analytically by the 3D-GILTT method [3,21,25]. Here, for comparison with experimen- tal data we will assume for the advection-diffusion Equa- tion (1): stationary conditions, crosswind integrated con- centrations and that the advection is much higher than the diffusion in the x-direction. After the simplifications, let us consider the problem: y z cc uK y zz (2) for 0 < z < h and x > 0, subject to the boundary condi- tions of zero flux at the ground and ABL top and a source with emission Q at height Hs ( 0, ys uczQz H at x = 0). Here c represents the crosswind integrated concentration, h is the ABL height, is the eddy dif- fusivity variable with the height z ( z Kz), u is the longitudinal wind speed ( zuu), and δ is the Di- rac delta function. Problem (2) has a well-known solution by the GILTT method. Following the works of [2,25] we write the so- lution of problem (2) as: 0 , N yn n cxzcx z n (3) where are the eigenfunctions of an associated Sturm-Liouville problem and nz n cx is the transformed concentration. Traditionally, in the application of the GILTT method, the following auxiliary Sturm-Liouville problem is cho- sen: 20 nnn zz at (4a) 0zh 0 nz at (4b) 0, ,zh which has the solution cos nn zz , where nz are the eigenfunctions and π nnh are the respective eigenvalues. 0,n 1, 2, Here, a different expansion for the solution of the ad- vection-diffusion equation will be explored. In other words, we propose another Sturm-Liouville problem as the basis generator. The idea of this proposal comes from the fact that the auxiliary problem (4) has the same shape of the ordinary differential equation (relative do z vari- able) that appears in the solution of Equation (2) by the method of separation of variables, when the vertical eddy diffusivity is considered constant. This suggests the pos- sibility of using an auxiliary problem that appears in the solution of Equation (2) by the method of separation of variables, considering linear vertical eddy diffusivity, z z , given by: 20 nn nn zz z at 0 (5a) zh 0 nz at (5b) 0,zh which has Bessel functions of first specie and order zero as solution 0nn zJ zh , where n 0,1, 2,n are the positive roots of the Bessel func- tion of first specie and order one, 1 . Problem (5) car- ries more information from the original problem than the previous one. To determine the unknown coefficient n cx we re- place Equation (3) in Equation (1). Applying the integral operator , we come out with the result: 0 . h mzz d 00 00 dd hh NN n nnmnmz nn cxuz cxKz zz 0 (6) Using the integration parts technique, we can recast the second integral in Equation (6) as: 00 dd hh nn m zmzmz n zK K zzz z z (6a) and once 0 n mz Kz , the Equation (6) is rewritten as: 00 00 dd hh NN n nnmnmz nn cxuz cxKz z 0 (7) which in matrix form reads like: 0FY x Yx (8) Here Yx is the vector whose components are n cx and F = B−1. E; ,nm Bb and are the ma- trices whose entries are, respectively: ,nm Ee 0 d h n,mn m bu z and 0 dd d h n n,mm z eK zz . Equation (8) is subject to the initial condition Y(0), which is obtained from the source condition ( 0, ys uczQz H at x = 0) by a similar proce- dure leading to 1 00 nms Yc QHB , B−1 being the inverse of matrix B. The transformed problem represented by the Equation (8) is solved analytically following the work [2], by the combined Laplace transform technique and diagonaliza- tion of the matrix F 1 FXDX . By this procedure we come out with the result: 10Yx XGxXY , (9) Copyright © 2013 SciRes. JEP  An Analytical Formulation for Pollutant Dispersion Simulation in the Atmospheric Boundary Layer 59 where is the diagonal matrix with elements , D is the diagonal matrix of eigenvalues n of the ma- trix F, X is the matrix of the respective eigenfunctions and X−1 it is the inverse. Gx ei dx d Therefore, the solution for the concentration given by Equation (3) is now well determined once the vector n cx is known and given by Equation (9). The solution of the problem (2) using in the series ex- pansion (3) eigenfunctions given in terms of cosine and Bessel functions will be called here as GILTTC and GILTTB, respectively. 3. Numerical Results The performance of the discussed solution was evaluated against experimental ground-level concentration using different dispersion experiments available in the litera- ture. Below we briefly discuss the Copenhagen, Prairie- Grass and Hanford dispersion experiments, which allow us to validate the results encountered by the mentioned solutions. The Copenhagen field campaign took place in the suburbs of Copenhagen in 1978, and is described by [26]. It consisted of tracer released without buoyancy from a tower at a height of 115 m, and collection of tracer sam- pling units at the ground-level positions at the maximum of three crosswind arcs. The sampling units were posi- tioned at two to six kilometers from the point of release. The site was mainly residential with a roughness length of the 0.6 m. The meteorological conditions during the dispersion experiments ranged from moderately unstable to convective. Table 1 shows a summary of meteoro- logical conditions during the Copenhagen experiments. In the Prairie-Grass experiment, according [27], the tracer SO2 was released without buoyancy at a height of 0.46 m, and collected at a height of 1.5 m at five down- wind distances (50, 100, 200, 400 and 800 m) at O’Neill, Table 1. The meteorological data observed during the Co- penhagen experiment. Exp. u (10 m) (ms−1) u* (ms−1) L (m) w* (ms−1) h (m) 1 3.4 0.36 −37 1.8 1980 2 10.6 0.73 −292 1.8 1920 3 5.0 0.38 −71 1.3 1120 4 4.6 0.38 −133 0.7 390 5 6.7 0.45 −444 0.7 820 6 13.2 1.05 −432 2.0 1300 7 7.6 0.64 −104 2.2 1850 8 9.4 0.69 −56 2.2 810 9 10.5 0.75 −289 1.9 2090 Nebraska in 1956. The Prairie Grass site was quite flat and much smooth with a roughness length of 0.6 cm. Here we consider the experimental data appearing in the paper [28]. Table 2 summaries the meteorological condi- tions during the Prairie-Grass experiments. The Hanford diffusion experiment was conducted in May-June, 1983, on a semi-arid region of south eastern Washington on generally flat terrain. The detailed de- scription of the experiment was provided by [29]. Data were obtained from six dual-tracer releases located at 100, 200, 800, 1600 and 3200 m from the source during moderately stable to near-neutral conditions. The release height of SF6 was 2 m and average release rate was around 0.3 g/s. The pollutant was collected at a height of 1.5 m. The terrain was considered as an urban terrain with roughness length of 3 cm. The values of ABL pa- rameters are given in Table 3. The choice of the turbulent parameterization repre- sents a fundamental aspect for pollutant dispersion mod- eling. In terms of the convective scaling parameters, the Table 2. The meteorological data observed during the Prai- rie-Grass experiment. Exp. L (m) h (m) w* (ms−1) u (10 m) (ms−1) Q (gs−1) 1 −9 260 0.84 3.2 82 5 −28 780 1.64 7.0 78 7 −10 1340 2.27 5.1 90 8 −18 1380 1.87 5.4 91 9 −31 550 1.70 8.4 92 10 −11 950 2.01 5.4 92 15 −8 80 0.70 3.8 96 16 −5 1060 2.03 3.6 93 19 −28 650 1.58 7.2 102 20 −62 710 1.92 11.3 102 25 −6 650 1.35 3.2 104 26 −32 900 1.86 7.8 98 27 −30 1280 2.08 7.6 99 30 −39 1560 2.23 8.5 98 43 −16 600 1.66 6.1 99 44 −25 1450 2.20 7.2 101 49 −28 550 1.73 8.0 102 50 −26 750 1.91 8.0 103 51 −40 1880 2.30 8.0 102 61 −38 450 1.65 9.3 102 Copyright © 2013 SciRes. JEP  An Analytical Formulation for Pollutant Dispersion Simulation in the Atmospheric Boundary Layer 60 Table 3. The meteorological data observed during the Han- ford experiment. Exp. u (2 m) (ms−1) u* (ms−1) L (m) h (m) 1 3.63 0.40 166 325 2 1.42 0.26 44 135 3 2.02 0.27 77 182 4 1.50 0.20 34 104 5 1.41 0.26 59 157 6 1.54 0.30 71 185 vertical eddy diffusivity can be formulated as [30]: 48 1/3 1/3 * 0.2211 e0.0003e z h z Kzz whh h z h (13) while for stable conditions [31]: 0.3 1 13.7 z zhuz Kz (14) where z is height; h is the thickness of the ABL; * is the convective velocity scale; w 54 1Lzh; L is the Monin-Obukhov length and is the friction velocity. * In our simulations, we use the wind speed profile de- scribed by a power law, according [32], u 11 z uz uz (15) where u and 1 u are the mean wind velocity respec- tively at the heights z and 1, while z is an exponent that is related to the intensity of turbulence [33]. For the Copenhagen experiment 0.1 and for the Prairie- Grass experiment 0.07 . In Tables 4-6, we present some performances evalua- tions of the model for the Copenhagen and Prairie-Grass experiments, respectively, using the statistical evaluation procedure described by [34] and defined as: 2 MSEnormalized mean square error , op po CC CC FA2fraction of data%, normalized to 1for 0.5 2, po CC CORcorrelation coefficient , oo pp op CCCC FBfractional bias0.5, op op CC CC FSfractional standard deviations 0.5 , op op where the subscripts o and p refer to observed and pre- dicted quantities, respectively, and the over bar indicates an averaged value. The statistical index NMSE repre- sents the model values dispersion in respect to data dis- persion. The statistical index FB says if the predicted quantities underestimate or overestimate the observed ones. The best results are expected to have values near to zero for the indices NMSE, FB and FS, and near to 1 in the indices COR and FA2. For the Copenhagen experiment the statistical indices of Table 4 point out that a good agreement is obtained between experimental data and the GILTT method for both cosine and Bessel basis, regarding the NMSE, FB and FS values relatively near to zero and COR relatively near to 1. At this point, we can affirm that no significant difference between the models was observed for the high source of the Copenhagen experiment. Table 5 shows the performance of the solution for the Prairie-Grass experiment. The statistical indices of the table point out that a reasonable agreement is obtained between experimental data and the GILTT method. It is important to notice that the GILTTB numerically con- verges faster than GILTTC (while GILTTB needs 100 eigenvalues, GILTTC needs 300 eigenvalues to reach a Table 4. Statistical indices evaluating the model perform- ance using the Copenhagen experiment. Model NMSECOR FA2 FB FS GILTTC N = 1000.05 0.91 1.00 −0.010.14 GILTTB N = 1000.05 0.91 1.00 −0.040.13 Table 5. Statistical indices evaluating the model perform- ance using the Prairie-Grass experiment. Model NMSECOR FA2 FB FS GILTTC N = 1000.80 0.83 0.64 0.39 0.56 GILTTC N = 2000.23 0.92 0.71 0.06 0.33 GILTTC N = 3000.15 0.95 0.72 −0.010.28 GILTTB N = 100 0.11 0.97 0.71 −0.1 0.23 Table 6. Statistical indices evaluating the model perform- ance using the Hanford experiment. Model NMSECOR FA2 FB FS GILTTC N = 300.21 0.91 0.83 −0.16 −0.01 GILTTC N = 600.23 0.91 0.80 −0.20 −0.03 GILTTB N = 300.24 0.91 0.77 −0.20 −0.03 Copyright © 2013 SciRes. JEP 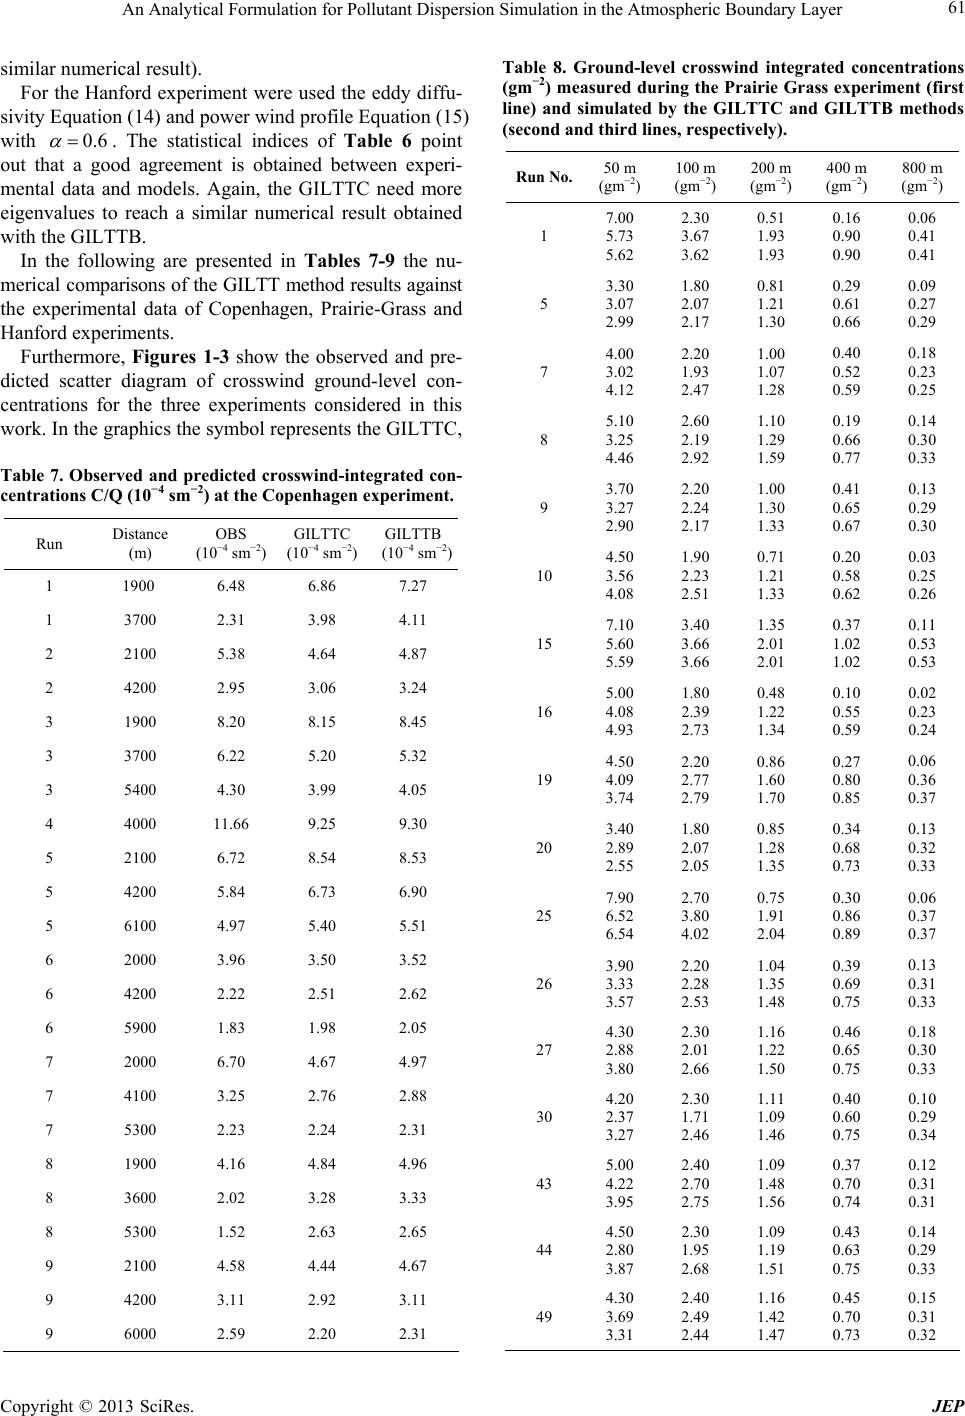 An Analytical Formulation for Pollutant Dispersion Simulation in the Atmospheric Boundary Layer 61 similar numerical result). For the Hanford experiment were used the eddy diffu- sivity Equation (14) and power wind profile Equation (15) with 0.6 . The statistical indices of Table 6 point out that a good agreement is obtained between experi- mental data and models. Again, the GILTTC need more eigenvalues to reach a similar numerical result obtained with the GILTTB. In the following are presented in Tables 7-9 the nu- merical comparisons of the GILTT method results against the experimental data of Copenhagen, Prairie-Grass and Hanford experiments. Furthermore, Figures 1-3 show the observed and pre- dicted scatter diagram of crosswind ground-level con- centrations for the three experiments considered in this work. In the graphics the symbol represents the GILTTC, Table 7. Observed and predicted crosswind-integrated con- centrations C/Q (10−4 sm−2) at the Copenhagen experiment. Run Distance (m) OBS (10−4 sm−2) GILTTC (10−4 sm−2) GILTTB (10−4 sm−2) 1 1900 6.48 6.86 7.27 1 3700 2.31 3.98 4.11 2 2100 5.38 4.64 4.87 2 4200 2.95 3.06 3.24 3 1900 8.20 8.15 8.45 3 3700 6.22 5.20 5.32 3 5400 4.30 3.99 4.05 4 4000 11.66 9.25 9.30 5 2100 6.72 8.54 8.53 5 4200 5.84 6.73 6.90 5 6100 4.97 5.40 5.51 6 2000 3.96 3.50 3.52 6 4200 2.22 2.51 2.62 6 5900 1.83 1.98 2.05 7 2000 6.70 4.67 4.97 7 4100 3.25 2.76 2.88 7 5300 2.23 2.24 2.31 8 1900 4.16 4.84 4.96 8 3600 2.02 3.28 3.33 8 5300 1.52 2.63 2.65 9 2100 4.58 4.44 4.67 9 4200 3.11 2.92 3.11 9 6000 2.59 2.20 2.31 Table 8. Ground-level crosswind integrated concentrations (gm−2) measured during the Prairie Grass experiment (first line) and simulated by the GILTTC and GILTTB methods (second and third lines, respectively). Run No.50 m (gm−2) 100 m (gm−2) 200 m (gm−2) 400 m (gm−2) 800 m (gm−2) 1 7.00 5.73 5.62 2.30 3.67 3.62 0.51 1.93 1.93 0.16 0.90 0.90 0.06 0.41 0.41 5 3.30 3.07 2.99 1.80 2.07 2.17 0.81 1.21 1.30 0.29 0.61 0.66 0.09 0.27 0.29 7 4.00 3.02 4.12 2.20 1.93 2.47 1.00 1.07 1.28 0.40 0.52 0.59 0.18 0.23 0.25 8 5.10 3.25 4.46 2.60 2.19 2.92 1.10 1.29 1.59 0.19 0.66 0.77 0.14 0.30 0.33 9 3.70 3.27 2.90 2.20 2.24 2.17 1.00 1.30 1.33 0.41 0.65 0.67 0.13 0.29 0.30 10 4.50 3.56 4.08 1.90 2.23 2.51 0.71 1.21 1.33 0.20 0.58 0.62 0.03 0.25 0.26 15 7.10 5.60 5.59 3.40 3.66 3.66 1.35 2.01 2.01 0.37 1.02 1.02 0.11 0.53 0.53 16 5.00 4.08 4.93 1.80 2.39 2.73 0.48 1.22 1.34 0.10 0.55 0.59 0.02 0.23 0.24 19 4.50 4.09 3.74 2.20 2.77 2.79 0.86 1.60 1.70 0.27 0.80 0.85 0.06 0.36 0.37 20 3.40 2.89 2.55 1.80 2.07 2.05 0.85 1.28 1.35 0.34 0.68 0.73 0.13 0.32 0.33 25 7.90 6.52 6.54 2.70 3.80 4.02 0.75 1.91 2.04 0.30 0.86 0.89 0.06 0.37 0.37 26 3.90 3.33 3.57 2.20 2.28 2.53 1.04 1.35 1.48 0.39 0.69 0.75 0.13 0.31 0.33 27 4.30 2.88 3.80 2.30 2.01 2.66 1.16 1.22 1.50 0.46 0.65 0.75 0.18 0.30 0.33 30 4.20 2.37 3.27 2.30 1.71 2.46 1.11 1.09 1.46 0.40 0.60 0.75 0.10 0.29 0.34 43 5.00 4.22 3.95 2.40 2.70 2.75 1.09 1.48 1.56 0.37 0.70 0.74 0.12 0.31 0.31 44 4.50 2.80 3.87 2.30 1.95 2.68 1.09 1.19 1.51 0.43 0.63 0.75 0.14 0.29 0.33 49 4.30 3.69 3.31 2.40 2.49 2.44 1.16 1.42 1.47 0.45 0.70 0.73 0.15 0.31 0.32 Copyright © 2013 SciRes. JEP 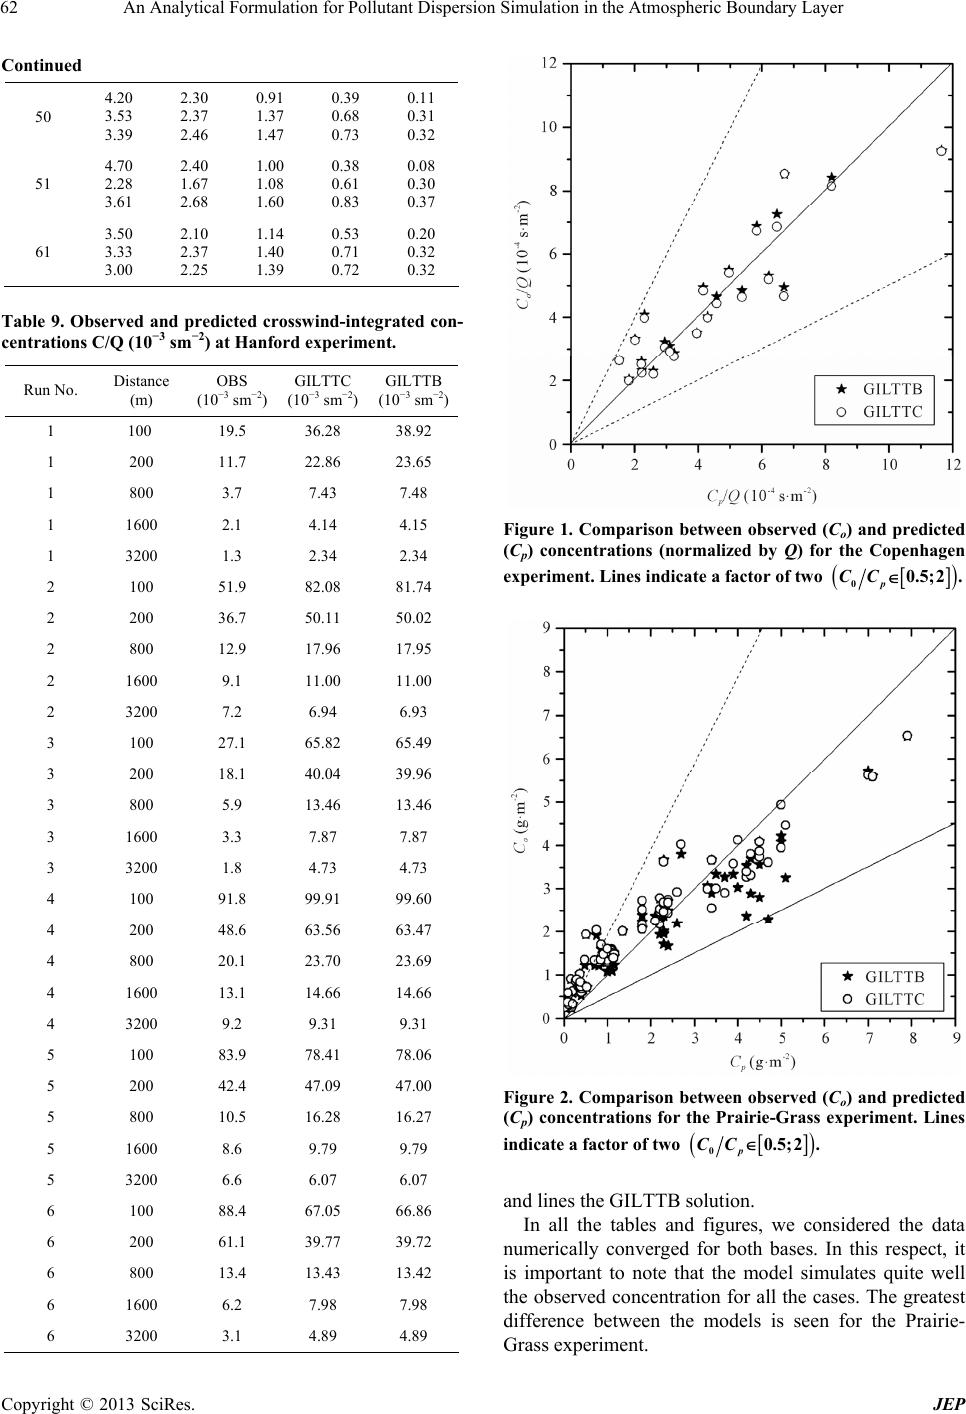 An Analytical Formulation for Pollutant Dispersion Simulation in the Atmospheric Boundary Layer 62 Continued 50 4.20 3.53 3.39 2.30 2.37 2.46 0.91 1.37 1.47 0.39 0.68 0.73 0.11 0.31 0.32 51 4.70 2.28 3.61 2.40 1.67 2.68 1.00 1.08 1.60 0.38 0.61 0.83 0.08 0.30 0.37 61 3.50 3.33 3.00 2.10 2.37 2.25 1.14 1.40 1.39 0.53 0.71 0.72 0.20 0.32 0.32 Table 9. Observed and predicted crosswind-integrated con- centrations C/Q (10−3 sm−2) at Hanford experiment. Run No. Distance (m) OBS (10−3 sm−2) GILTTC (10−3 sm−2) GILTTB (10−3 sm−2) 1 100 19.5 36.28 38.92 1 200 11.7 22.86 23.65 1 800 3.7 7.43 7.48 1 1600 2.1 4.14 4.15 1 3200 1.3 2.34 2.34 2 100 51.9 82.08 81.74 2 200 36.7 50.11 50.02 2 800 12.9 17.96 17.95 2 1600 9.1 11.00 11.00 2 3200 7.2 6.94 6.93 3 100 27.1 65.82 65.49 3 200 18.1 40.04 39.96 3 800 5.9 13.46 13.46 3 1600 3.3 7.87 7.87 3 3200 1.8 4.73 4.73 4 100 91.8 99.91 99.60 4 200 48.6 63.56 63.47 4 800 20.1 23.70 23.69 4 1600 13.1 14.66 14.66 4 3200 9.2 9.31 9.31 5 100 83.9 78.41 78.06 5 200 42.4 47.09 47.00 5 800 10.5 16.28 16.27 5 1600 8.6 9.79 9.79 5 3200 6.6 6.07 6.07 6 100 88.4 67.05 66.86 6 200 61.1 39.77 39.72 6 800 13.4 13.43 13.42 6 1600 6.2 7.98 7.98 6 3200 3.1 4.89 4.89 Figure 1. Comparison between observed (Co) and predicted (Cp) concentrations (normalized by Q) for the Copenhagen experiment. Lines indicate a factor of two 00.5;2 p CC . Figure 2. Comparison between observed (Co) and predicted (Cp) concentrations for the Prairie-Grass experiment. Lines indicate a factor of two 00.5;2 p CC . and lines the GILTTB solution. In all the tables and figures, we considered the data numerically converged for both bases. In this respect, it is important to note that the model simulates quite well the observed concentration for all the cases. The greatest difference between the models is seen for the Prairie- Grass experiment. Copyright © 2013 SciRes. JEP 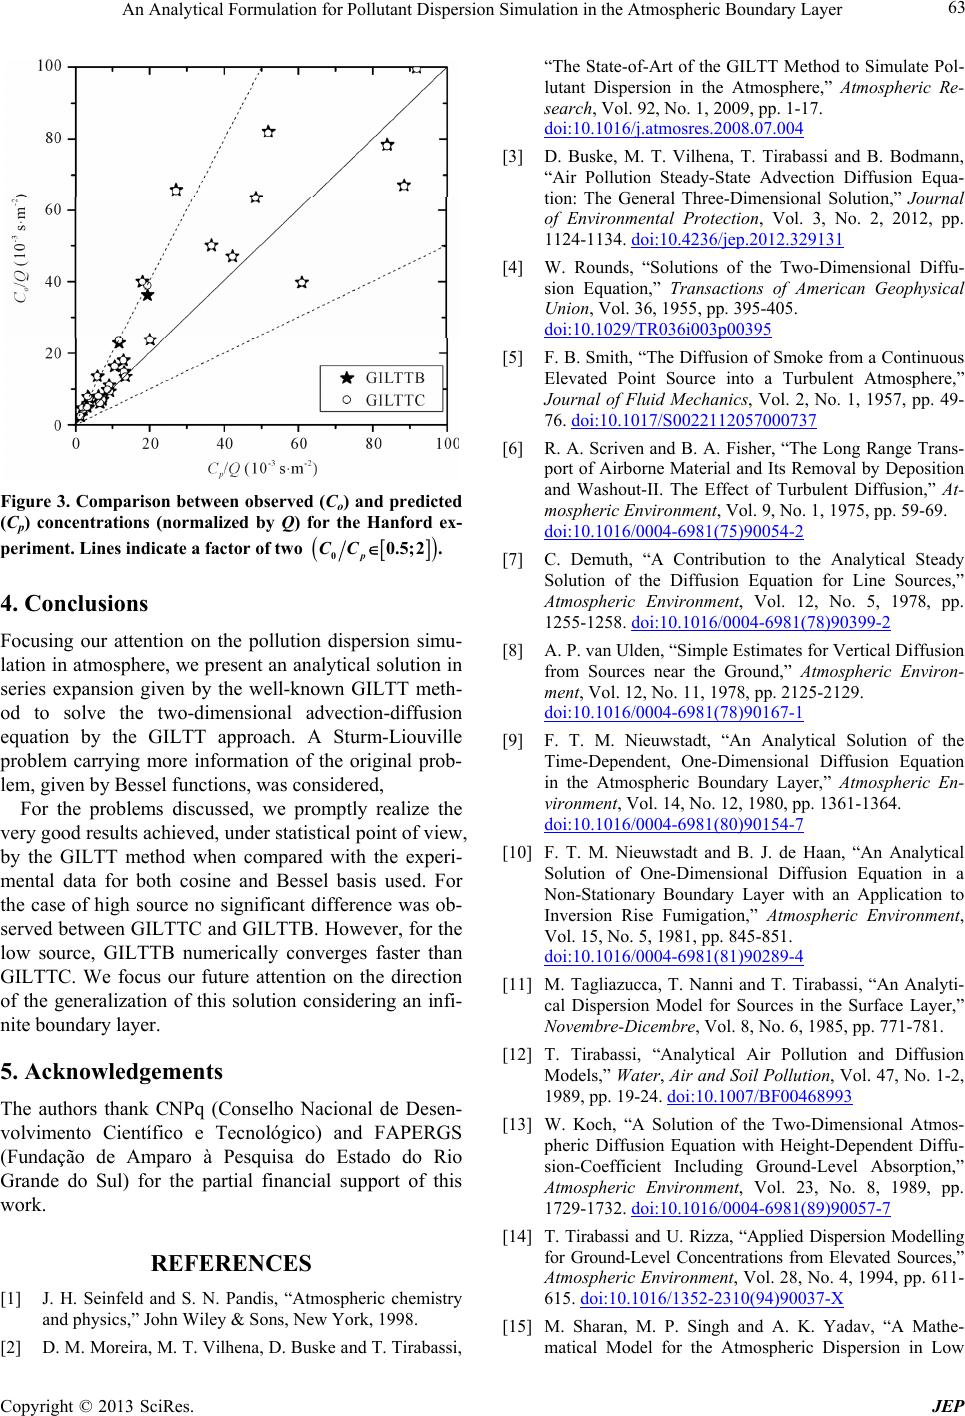 An Analytical Formulation for Pollutant Dispersion Simulation in the Atmospheric Boundary Layer 63 Figure 3. Comparison between observed (Co) and predicted (Cp) concentrations (normalized by Q) for the Hanford ex- periment. Lines indicate a factor of two 00.5;2 p CC . 4. Conclusions Focusing our attention on the pollution dispersion simu- lation in atmosphere, we present an analytical solution in series expansion given by the well-known GILTT meth- od to solve the two-dimensional advection-diffusion equation by the GILTT approach. A Sturm-Liouville problem carrying more information of the original prob- lem, given by Bessel functions, was considered, For the problems discussed, we promptly realize the very good results achieved, under statistical point of view, by the GILTT method when compared with the experi- mental data for both cosine and Bessel basis used. For the case of high source no significant difference was ob- served between GILTTC and GILTTB. However, for the low source, GILTTB numerically converges faster than GILTTC. We focus our future attention on the direction of the generalization of this solution considering an infi- nite boundary layer. 5. Acknowledgements The authors thank CNPq (Conselho Nacional de Desen- volvimento Científico e Tecnológico) and FAPERGS (Fundação de Amparo à Pesquisa do Estado do Rio Grande do Sul) for the partial financial support of this work. REFERENCES [1] J. H. Seinfeld and S. N. Pandis, “Atmospheric chemistry and physics,” John Wiley & Sons, New York, 1998. [2] D. M. Moreira, M. T. Vilhena, D. Buske and T. Tirabassi, “The State-of-Art of the GILTT Method to Simulate Pol- lutant Dispersion in the Atmosphere,” Atmospheric Re- search, Vol. 92, No. 1, 2009, pp. 1-17. doi:10.1016/j.atmosres.2008.07.004 [3] D. Buske, M. T. Vilhena, T. Tirabassi and B. Bodmann, “Air Pollution Steady-State Advection Diffusion Equa- tion: The General Three-Dimensional Solution,” Journal of Environmental Protection, Vol. 3, No. 2, 2012, pp. 1124-1134. doi:10.4236/jep.2012.329131 [4] W. Rounds, “Solutions of the Two-Dimensional Diffu- sion Equation,” Transactions of American Geophysical Union, Vol. 36, 1955, pp. 395-405. doi:10.1029/TR036i003p00395 [5] F. B. Smith, “The Diffusion of Smoke from a Continuous Elevated Point Source into a Turbulent Atmosphere,” Journal of Fluid Mechanics, Vol. 2, No. 1, 1957, pp. 49- 76. doi:10.1017/S0022112057000737 [6] R. A. Scriven and B. A. Fisher, “The Long Range Trans- port of Airborne Material and Its Removal by Deposition and Washout-II. The Effect of Turbulent Diffusion,” At- mospheric Environment, Vol. 9, No. 1, 1975, pp. 59-69. doi:10.1016/0004-6981(75)90054-2 [7] C. Demuth, “A Contribution to the Analytical Steady Solution of the Diffusion Equation for Line Sources,” Atmospheric Environment, Vol. 12, No. 5, 1978, pp. 1255-1258. doi:10.1016/0004-6981(78)90399-2 [8] A. P. van Ulden, “Simple Estimates for Vertical Diffusion from Sources near the Ground,” Atmospheric Environ- ment, Vol. 12, No. 11, 1978, pp. 2125-2129. doi:10.1016/0004-6981(78)90167-1 [9] F. T. M. Nieuwstadt, “An Analytical Solution of the Time-Dependent, One-Dimensional Diffusion Equation in the Atmospheric Boundary Layer,” Atmospheric En- vironment, Vol. 14, No. 12, 1980, pp. 1361-1364. doi:10.1016/0004-6981(80)90154-7 [10] F. T. M. Nieuwstadt and B. J. de Haan, “An Analytical Solution of One-Dimensional Diffusion Equation in a Non-Stationary Boundary Layer with an Application to Inversion Rise Fumigation,” Atmospheric Environment, Vol. 15, No. 5, 1981, pp. 845-851. doi:10.1016/0004-6981(81)90289-4 [11] M. Tagliazucca, T. Nanni and T. Tirabassi, “An Analyti- cal Dispersion Model for Sources in the Surface Layer,” Novembre-Dicembre, Vol. 8, No. 6, 1985, pp. 771-781. [12] T. Tirabassi, “Analytical Air Pollution and Diffusion Models,” Water, Air and Soil Pollution, Vol. 47, No. 1-2, 1989, pp. 19-24. doi:10.1007/BF00468993 [13] W. Koch, “A Solution of the Two-Dimensional Atmos- pheric Diffusion Equation with Height-Dependent Diffu- sion-Coefficient Including Ground-Level Absorption,” Atmospheric Environment, Vol. 23, No. 8, 1989, pp. 1729-1732. doi:10.1016/0004-6981(89)90057-7 [14] T. Tirabassi and U. Rizza, “Applied Dispersion Modelling for Ground-Level Concentrations from Elevated Sources,” Atmospheric Environment, Vol. 28, No. 4, 1994, pp. 611- 615. doi:10.1016/1352-2310(94)90037-X [15] M. Sharan, M. P. Singh and A. K. Yadav, “A Mathe- matical Model for the Atmospheric Dispersion in Low Copyright © 2013 SciRes. JEP  An Analytical Formulation for Pollutant Dispersion Simulation in the Atmospheric Boundary Layer Copyright © 2013 SciRes. JEP 64 Winds with Eddy Diffusivities as Linear Function of Downwind Distance,” Atmospheric Environment, Vol. 30, No. 7, 1996, pp. 1137-1145. doi:10.1016/1352-2310(95)00368-1 [16] J. S. Lin and L. M. Hildemann, “A Generalised Mathe- matical Scheme to Analytically Solve the Atmospheric Diffusion Equation with Dry Deposition,” Atmospheric Environment, Vol. 31, No. 1, 1997, pp. 59-71. doi:10.1016/S1352-2310(96)00148-3 [17] M. Sharan and M. Modani, “An Analytical Study for the Dispersion of Pollutants in a Finite Layer under Low Wind Conditions,” Pure and Applied Geophysics, Vol. 162, No. 10, 2005, pp. 1861-1892. doi:10.1007/s00024-005-2696-5 [18] M. Sharan and M. Modani, “A Two-Dimensional Ana- lytical Model for the Dispersion of Air-Pollutants in the Atmosphere with a Capping Inversion,” Atmospheric En- vironment, Vol. 40, No. 19, 2006, pp. 3469-3489. doi:10.1016/j.atmosenv.2006.01.051 [19] D. M. Moreira, M. T. Vilhena, T. Tirabassi, C. Costa and B. Bodmann, “Simulation of Pollutant Dispersion in At- mosphere by the Laplace Transform: The ADMM Ap- proach,” Water, Air and Soil Pollution, Vol. 177, No. 1-4, 2006, pp. 411-439. doi:10.1007/s11270-006-9182-2 [20] C. P. Costa, M. T. Vilhena, D. M. Moreira and T. Tira- bassi, “Semi-Analytical Solution of the Steady Three- Dimensional Advection-Diffusion Equation in the Plane- tary Boundary Layer,” Atmospheric Environment, Vol. 40, No. 29, 2006, pp. 5659-5669. doi:10.1016/j.atmosenv.2006.04.054 [21] D. Buske, M. T. Vilhena, C. F. Segatto and R. S. Quadros, “A General Analytical Solution of the Advection-Diffu- sion Equation for Fickian Closure,” In: Integral Methods in Science and Engineering: Computational and Analytic Aspects, Birkhäuser, Boston, 2011, pp. 25-34. doi:10.1007/978-0-8176-8238-5_4 [22] P. Kumar and M. Sharan, “An Analytical Model for Dis- persion of Pollutants from a Continuous Source in the Atmospheric Boundary Layer,” Proceedings of the Royal Society A: Mathematical, Physical and Engineering Sci- ences, Vol. 466, No. 2144, 2010, pp. 383-406. doi:10.1098/rspa.2009.0394 [23] J. S. Perez Guerrero, L. C. G. Pimentel, J. F. Oliveira Jr., P. F. L. Heilbron Filho and A. G. Ulke, “A Unified Ana- lytical Solution of the Steady-State Atmospheric Diffu- sion Equation,” Atmospheric Environment, Vol. 55, 2012, pp. 201-212. doi:10.1016/j.atmosenv.2012.03.015 [24] A. K. Blackadar, “Turbulence and Diffusion in the Atmos- phere: Lectures in Environmental Sciences,” Springer- Verlag, Berlin, 1997, 185p. doi:10.1007/978-3-642-60481-2 [25] M. T. Vilhena, D. Buske, G. A. Degrazia and R. S. Qua- dros, “An Analytical Model with Temporal Variable Eddy Diffusivity Applied to Contaminant Dispersion in the Atmospheric Boundary Layer,” Physica A: Statistical Mechanics and Its Applications, Vol. 391, No. 8, 2012, pp. 2576-2584. doi:10.1016/j.physa.2011.11.001 [26] S. E. Gryning and E. Lyck, “Atmospheric Dispersion from Elevated Source in an Urban Area: Comparison between Tracer Experiments and Model Calculations,” Journal of Climate and Applied Meteorology, Vol. 23, No. 4, 1984, pp. 651-654. [27] M. L. Barad, “Project Prairie Grass: A Field Program in Diffusion,” Geophysical Research Paper No. 59, Vols. I and II, AFCRL-TR-58-235 (ASTIA Document No. AF- 152572), Air Force Cambridge Research Laboratories, Bedford, 1958. [28] F. T. M. Nieuwstadt, “An Analytical Solution of the Time-Dependent, One-Dimensional Diffusion Equation in the Atmospheric Boundary Layer,” Atmospheric En- vironment, Vol. 14, No. 12, 1980, pp. 1361-1364. doi:10.1016/0004-6981(80)90154-7 [29] J. C. Doran and T. W. Horst, “An Evaluation of Gaussian Plume-Depletion Models with Dual-Tracer Field Meas- urements,” Atmospheric Environment, Vol. 19, No. 6, 1985, pp. 939-951. doi:10.1016/0004-6981(85)90239-2 [30] G. A. Degrazia, H. F. Campos Velho and J. C. Carvalho, “Nonlocal Exchange Coefficients for the Convective Boundary Layer Derived from Spectral Properties,” Con- tributions to Atmospheric Physics, Vol. 70, No. 1, 1997, pp. 57-64. [31] G. A. Degrazia, D. Anfossi, J. C. Carvalho, C. Mangia, T. Tirabassi and H. F. Campos Velho, “Turbulence Parame- terization for PBL Dispersion Models in All Stability Conditions,” Atmospheric Environment, Vol. 34, No. 21, 2000, pp. 3575-3583. doi:10.1016/S1352-2310(00)00116-3 [32] H. A. Panofsky and J. A. Dutton, “Atmospheric Turbu- lence,” John Wiley & Sons, New York, 1984. [33] J. S. Irwin, “A Theoretical Variation of the Wind Profile Power-Low Exponent as a Function of Surface Rough- ness and Stability,” Atmospheric Environment, Vol. 13, No. 1, 1979, pp. 191-194. doi:10.1016/0004-6981(79)90260-9 [34] S. R. Hanna, “Confidence Limit for Air Quality Models as Estimated by Bootstrap and Jacknife Resampling Methods,” Atmospheric Environment, Vol. 23, No. 6, 1989, pp. 1385-1395. doi:10.1016/0004-6981(89)90161-3
|