 Modern Economy, 2013, 4, 535-550 http://dx.doi.org/10.4236/me.2013.48057 Published Online August 2013 (http://www.scirp.org/journal/me) Familial Relationship of Migrants and Remittances Behavior: Theory and Evidence from Ecuador Hilcías E. Morán Department of EconomicsResearch, Banco de Guatemala, Ciudad de Guatemala, Guatemala Email: hems@banguat.gob.gt Received February 2, 2013; revised March 12, 2013; accepted April 12, 2013 Copyright © 2013 Hilcías E. Morán. This is an open access article distributed under the Creative Commons Attribution License, which permits unrestricted use, distribution, and reproduction in any medium, provided the original work is properly cited. ABSTRACT This paper develops a simple analytical model with altruistically motivated remittances to analyze the determinants of remittances using household data from Ecuador. The model predicts that migrant remittance behavior and household migration size are non-monotonically correlated. The empirical work suggests that migrant remittances are a non-in- creasing function of the number of migrants within the household. If there is a positive selection of migrants, then one would expect that the forgone household income due to migration is higher than when there is a negative selection. Ac- cording to the Ecuadorian data of households with at least 1 migrant, prior to migration the individuals who left had a higher education level than those relatives left behind. The average years of schooling of the migrants are 3.5 years, higher than the non-migrants. It seems that when migration size changes from 2 to 3 and from 3 to 4 migrants within the same household, the forgone household income due to migration might have a positive effect on altruistically motivated remittances, which compensates for the negative effect of the increased number of migrants on the individual amount of remittances (Nash assumption). The results of allowing a non-linear relationship between migrant remittance behavior and household migration are partially distinguished from those reached when there is a linear relationship and also con- trast with the predictions of rent-seeking literature. Moreover, it shows that Ecuadorian migrants who moved to Spain were less likely to remit and remit less than those migrants whose destination country was the United States. Keywords: Remittances; Migration; Private Transfers; Altruism; Ecuador 1. Introduction According to World Bank data, the share of remittances as a percentage of gross domestic product has grown steadily through the last three decades. By the end of the 1970s remittances for all developing countries repre- sented only around 0.5 percent of the GDP while in 2006 it reached around 2.0 percent. Remittances have become the second-largest source of international financial re- sources for developing countries, after foreign direct investment, and in many cases are the largest source of external inflows. Remittances have been regarded as an important source of external funding for stimulating eco- nomic development [1]. Because of these facts, scholars, policy makers and international financial agencies have become worried about the potentially transitory versus permanent nature of remittances. Understanding the determinants of migrant remittance behavior can help to predict the future pattern of remittance flows for deve- loping. Although Ecuador is a small Latin American country of approximately 13.9 million people, Ecuadorians are one of the largest immigrant groups in metro New York and the second largest immigrant group in Spain1. A massive emigration from Ecuador occurred between 1999 and 2004 as a response to the national economic crisis of 1998 and 1999, caused by the closure of the banks, devaluation (from 5,000 sucres to 25,000 sucres to the dollar), company bankruptcies and financial insta- bility. During these two years, Ecuador’s Gross Domestic Product fell by 27 percent, while per capita household consumption was lower in 1999 than 10 years earlier2. According to the Central Bank of Ecuador, from 1996 to 2006 remittances grew at an average rate of 19 percent annually, and since 1999 have become the second-largest source of foreign income after oil exports, exceeding official development aid and foreign direct investment. In 2006 remittances totaled 2.9 billion dollars, which represented 7.0 percent of GDP and 22.2 percent of total 1[2]. 2[3]. C opyright © 2013 SciRes. ME  H. E. MORÁN 536 exports of goods and services. There is a growing body of literature which focuses on the microeconomic motives behind remittances [4-8]. These surveys list three basic motives for remittances: altruism, insurance (indemnifying the human and social development of the family left behind against income shocks), and investment (asset accumulation back home as part of the migration life-cycle planning)3. Similar to [5], this study proposes a behavioral model of remittances based on altruism. It is assumed that an individual migrant takes as given the amount of remit- tances sent by all other migrants within the same house- hold (Nash assumption). Existing studies have used the Nash assumption as well. They predict that the individual remittance behavior is negatively associated with the number of other migrants within the same household [5,6]. This paper contributes both theoretically and empirically to this branch of the literature. In particular, the analytical model emphasizes the relationship between individual migrant remittance behavior and the number of migrants within the same household. The key difference between this model and previous analytical frameworks based on altruism is that, when the migrant opportunity cost of forgone household labor income is taken into account, this model suggests that migrant remittance behavior and household migration size are non-monotonically correlated. In other words, the relationship between individual remittance behavior and the number of other migrants within the same house- hold is not theoretically determined. Whereas remittances decrease with the number of migrants within the same household due to the Nash assumption (more remittances sent by the others migrants, less remittances sent by one), remittances increase with the number of migrants be- cause the household’s labor income is negatively affected by the reduction of the labor supply in the source country. Whether remittances increase or decline will depend on which effect dominates. Hence, this relationship may be empirically addressed. Using household data from Ecuador, the empirical part of this paper presents an analysis to assess the deter- minants of remittances. According to the 2004 “Demo- graphic, Maternal and Infant Health Survey” (ENDEM AIN), Ecuadorian migrants are spread across 30 coun- tries, of which the most significant destination countries are Spain, the US and Italy, respectively. Most of the migrants are close relatives of the household head (80 percent are parents, children or spouses). The survey includes migrants who left the country between 1960 and 2004. Most of those left between 1999 and 2004 (more than 70 percent). While the preferred countries during the last surge of migration were European such as Spain and Italy, the U.S. was a secondary destination. For instance, of the total number of Ecuadorian migrants living in Spain, around 90 percent arrived between 1999 and 2004. During the 1980’s, most of the Ecuadorian migrants paid intermediaries, coyotes or a document forger, for clan- destine passage to the United States, whereas the vast majority of the migrants during the last massive mig- ration chose Spain. The main reason for this was an exis- ting agreement between Spain and Ecuador that allowed Ecuadorians to enter the country as tourists without visas (the law changed in 2003). The main motivations for leaving were to search for work or to accept a job offer in the destination country. The empirical work provides evidence that migrant remittances are a non-increasing function of the number of migrants within the household. If there is a positive selection of migrants in the sense that the more educated individuals within the household are those who migrate, then one would expect that the forgone household income due to migration is higher than when there is a negative selection. According to the Ecuadorian data of households with at least 1 migrant, prior to migration the individuals who left had a higher education level than those relatives left behind. The average years of schooling of the migrants were 3.5 years higher than the non-migrants. It seems that when migration size changes from 2 to 3 and from 3 to 4 migrants within the same household, the forgone household income due to migration might have a positive effect on altruistically motivated remittances, which compensates for the nega- tive effect of the increased number of migrants on the individual amount of remittances. The results of allowing a non-linear relationship between migrant remittance behavior and household migration are partially distin- guished from those reached when there is a linear relationship and also contrast with the predictions of rent-seeking literature4. Moreover, it shows robust evi- dence both for altruistically motivated remittance be- havior and for the fact that the size of remittances de- creases over time since the migration. Finally, the em- pirical section shows that Ecuadorian migrants who moved to Spain were less likely to remit and remit less than those migrants whose destination country was the United States, which might reflect the lower unem- ployment rate and the higher potential earnings in the United States relative to Spain5. The rest of the paper is organized as follows: Section 2 includes a basic theoretical framework and reduced form equation for the migrants’ remittance behavior; Section 3 discusses the empirical strategy and results; and the last section offers some concluding remarks. 4As pointed out by [9], if we allow for multiple migrants competing for inheritance, then “we would expect remittances per migrant to first increase and then decrease with the number of other migrants as the effect of competition is offset by the decrease in one’s probability o inheritance”. 5See [10]. 3For a more comprehensive review of these arguments, see [4] and the survey in [9]. Copyright © 2013 SciRes. ME  H. E. MORÁN 537 2. Basic Theoretical Framework 2.1. The Model Following to [5], this study proposes a behavioral model of remittances based on altruism. It is assumed that an individual migrant takes as given the amount of remittances sent by all other migrants within the same household (Nash assumption). Existing studies have used the Nash assumption as well, but have not formally stated and tested this assumption. They predict that the individual remittance behavior is negatively associated with the number of other migrants within the same household [5,6]. Since here it is assumed that migrants from the same household make a voluntary contribution to finance consumption in that household, non-migrant consumption might be thought of as a public good, where the possibility of migrants that free ride exists in this framework. This model contributes theoretically to this branch of the literature. In particular, the model em- phasizes the relationship between individual migrant remittance behavior and the number of migrants within the same household. The key difference between this model and previous analytical frameworks based on altruism is that, when the migrant opportunity cost of forgone household labor income is taken into account, this model suggests that migrant remittance behavior and household migration size are non-monotonically corre- lated. Consider a two-agent model: the migrant and the non- migrant. The individual migrant worker is represented by from household who lives and works in a foreign country =1,2,,m ilj , ,=1,2, F =1,2,jS , ; the non-migrant refers to household in the source country, which can consist of one or more individuals. There are several assumptions in this framework. First, it ignores the reasons for the migration decision, which implies that the migrants are exogenously located in different host countries6. Second, each migrant is altruistic toward the non-migrant members of her own family7, which means that migrant i, in addition to choosing her own consumption i c, has to decide how much money to transfer to her relatives in the source country (remittance size ij ). Next, an individual migrant takes the amount of remittances sent by all other migrants within the same household as given (Nash assumption), which is denoted as ij ai j a . Prices are the same across the host countries and the source country, and are normalized to 18. Finally, all income in the source country is consumed and all migrant income net of remittances is consumed as well in the host country. Thus, each migrant from household in host country ij , who values both her own utility and the utility of household in the source country, seeks to maximize a log utility function as follows: j {, f ij j } log log h j c ij VMa c ac i x (1) .. t f ij w ij ca (2) hh ij ij h jj a a cn lw ij (3) 0,a (4) for all , =1,,m il=1, , F, and , taking as given non-migrant consumption =1, ,jS h c, the amount of remittances sent by all other migrants within the same household ij a , the exogenous migrant’s labor income w hh j lw , and the exogenous household’s total labor income , where h l is the number of working members within household in the source country, denotes real wages in the source country, j is the number of individuals in household (including children), and j h wn j 0,1 represents a taste parameter that characterizes heterogeneous preferences for each migrant. This taste parameter, in particular, represents the migrant’s degree of altruism toward her relatives in the source country. Expressions (1)-(4) represent the migrant utility function, migrant budget constraint, non- migrant budget constraint and the non-negative of remittances condition, respectively9. The utility maximization problem is: Max loglog hh ij ij fij aij j lw a a wa n 6Some of the leading papers dealing with migration decision theory are [11-14], in which the migration decision is a function of two main variables: wage differential and migration cost. Similar representations also can be found in [15], where the authors construct a discrete time model of equilibrium migration with endogenous moving costs. In this setup the cost of moving also depends on the stock of migrants already settled in the host country, which captures the “networks externality” effect. 7For a general discussion about the different motives for remitting cov- ered in the literature, see [4] and [9]. In addition to the altruistic behav- ior of migrants, these authors include other motives for remitting such as exchange, investment and inheritance-seeking. Under the exchange motive, for instance, the migrants’ remittances may be viewed as re- ayments of loans used to finance the moving costs or the migrants’ investment in human capital. Investment and inheritance-seeking mo- tives are defined by [4] as self-interest motives. .. t 0. ij a 8This assumption does not change any of the substantive predictions o the model considered here. [16-18] consider international migration models in which it is assumed that prices are higher in the host country relative to prices in the source country. This issue is not considered here mainly to maintain simplicity and partially because it would be more relevant if we were modeling return migration as analyzed by [16-18]. 9This approach looks similar to that discussed in the literature of private rovision of public goods. See [19-22]. Copyright © 2013 SciRes. ME  H. E. MORÁN 538 This maximization problem yields a continuous function called the migrant best response function: th i max,0 . 1 fhh jij ij wlwa a (5) As expected, the individual migrant ’s best response function for remittances is a decreasing function of the amount of remittances sent home by all other migrants within the same household, ij . Now, let i am l denote the number of migrants within household such that the total household labor supply is =mh jj . Then, under the assumption of a symmetric equilibrium, let lll =m jij ala denote the total amount received by house- hold in equilibrium. As follows from (5), the indivi- dual migrant’s optimal amount of remittances sent to her relatives left behind is max,0,,, . fmh jj fm ij m j wllw a l a wll (6) From (6), remittances are an increasing function of the migrant’s labor income, w, and of the migrant’s degree of altruism toward non-migrants, , and a decreasing function of the household labor income, . The relationship between the migrant worker remittances and the number of migrants within the same household, however, is ambiguously determined. When household migration increases exogenously, the amount of remittances sent by all other migrants within the house- hold increases, while migrant ’s best response function would predict that migrant i’s remittances would decline. The latter prediction might be counter-balanced, however, by a decrease in the household labor income due to the lower household labor supply in the source country (i.e. forgone migrant wages in the source country), which would imply that remittances increase when household migration increases10. As follows from (6), the derivative of remittances with respect to migration size is given by h w i 2. hf mm www a ll h (7) Since wage differential is positive, > h h w ww , which implies that migrant remittances are negatively associated with migration size. When < h h w ww , migrant remittances are positively associated with the number of migrants within the household. Hence, the relationship between remittance behavior and migration size depends on the wage gap and the unobservable migrant’s degree of altruism. If the migrant’s degree of altruism is sufficiently large (small) and there is a large (small) wage gap between host country and the mig- rant source country, it is more likely that remittance be- havior and migration size are negatively (positively) correlated. Since the relationship between migration size and individual migrant remittance behavior is not de- termined, the empirical work of this paper examines this relationship. To close the model, let f w i be a critical level of migrant labor income such that the migrant equilibrium remittances for each individual from household is given by j if > 0, fmh mh jj jj ff m ij j wllw llw ww al Otherwise (8) where the inequality condition on the right side of (8) states that if the actual migrant labor income is greater than her critical level mh jj llw , then migrant i sends a positive amount of remittances to her relatives in the source country. There are several implications from (8). First, individual remittance behavior is ambiguously associated with the number of other migrants within the same household, which is a direct consequence of the Nash assumption and the altruistically motivated migrant remittance behavior (see Equation (7)). Hence, this relationship may be empirically addressed. Second, migrants with different tastes have different critical levels of income. Conditional on the household labor income and the number of migrants within the same household, the decision to remit or not to remit (free rider) depends on whether the actual migrant labor income is greater than (does remit) or less than (does not remit) her critical level of labor income. Migrants who do not remit are those with relatively low labor income, a low degree of altruism toward their relatives left behind, or both. On the other hand, migrants who remit are those with relatively high labor income, a high degree of altruism, or both. Third, since individual migrants stay in different host countries, migrants who migrate to higher earnings countries are more likely to remit and, they remit more than those who migrate to lower earnings countries. Fi- 10Here, the exogenous change of household migration might be a strong assumption, but it can be thought of as a remarkable change in the immigration policies of a host country that would allow migrant work- ers with particular qualifications or from a specific source country to move to that host country without any significant moving cost. For example, Mexican workers who live next to the Mexican-US border might easily migrate to the US if border enforcement policy in the US was markedl chan ed. Copyright © 2013 SciRes. ME 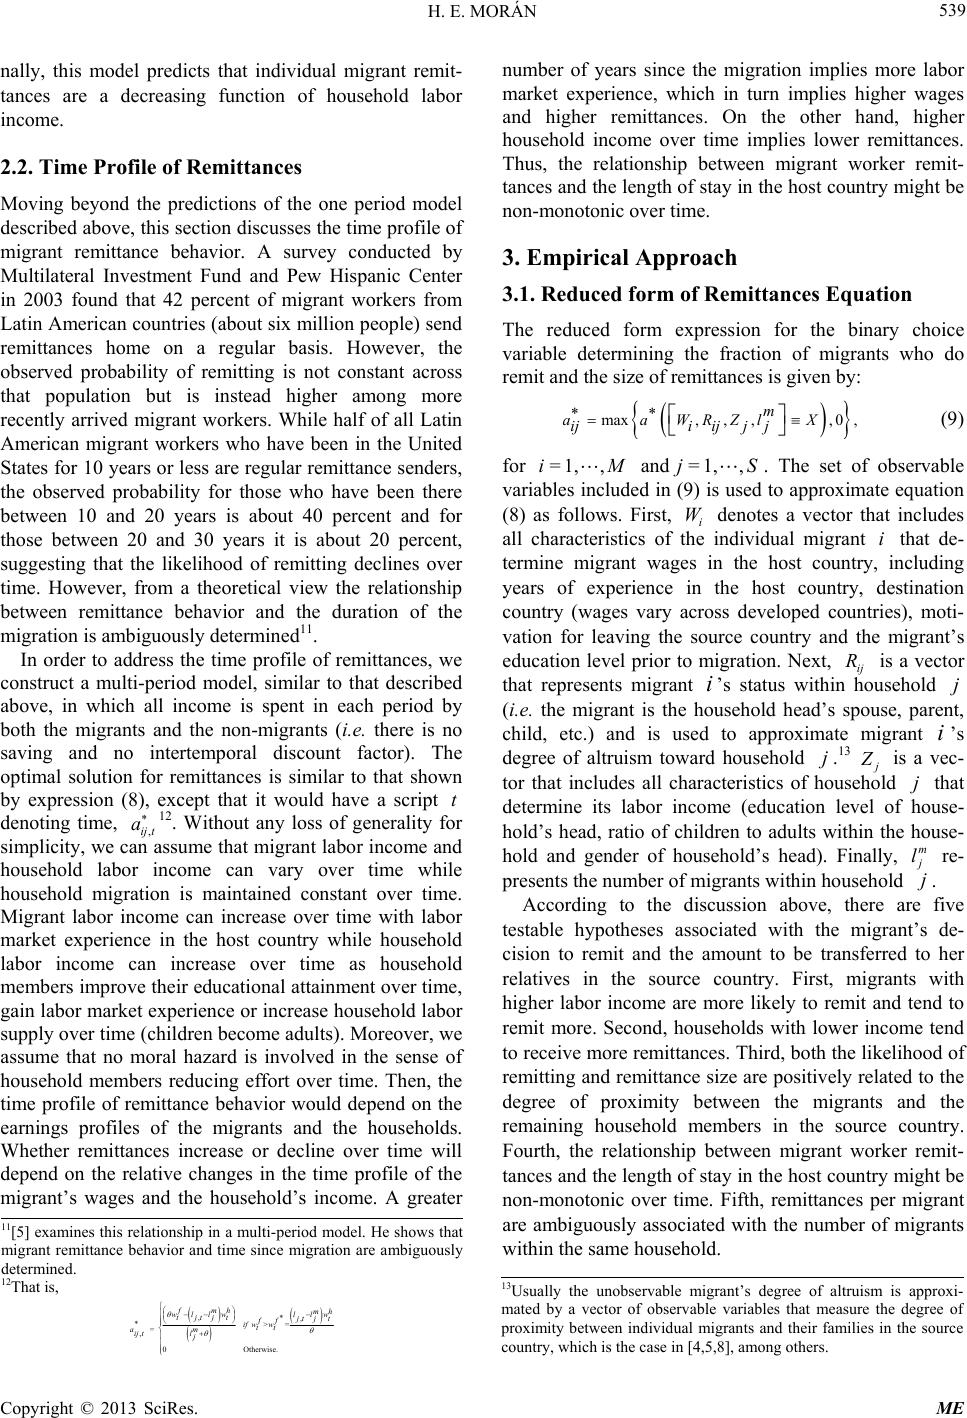 H. E. MORÁN 539 nally, this model predicts that individual migrant remit- tances are a decreasing function of household labor income. 2.2. Time Profile of Remittances Moving beyond the predictions of the one period model described above, this section discusses the time profile of migrant remittance behavior. A survey conducted by Multilateral Investment Fund and Pew Hispanic Center in 2003 found that 42 percent of migrant workers from Latin American countries (about six million people) send remittances home on a regular basis. However, the observed probability of remitting is not constant across that population but is instead higher among more recently arrived migrant workers. While half of all Latin American migrant workers who have been in the United States for 10 years or less are regular remittance senders, the observed probability for those who have been there between 10 and 20 years is about 40 percent and for those between 20 and 30 years it is about 20 percent, suggesting that the likelihood of remitting declines over time. However, from a theoretical view the relationship between remittance behavior and the duration of the migration is ambiguously determined11. In order to address the time profile of remittances, we construct a multi-period model, similar to that described above, in which all income is spent in each period by both the migrants and the non-migrants (i.e. there is no saving and no intertemporal discount factor). The optimal solution for remittances is similar to that shown by expression (8), except that it would have a script denoting time, ,ij t 12. Without any loss of generality for simplicity, we can assume that migrant labor income and household labor income can vary over time while household migration is maintained constant over time. Migrant labor income can increase over time with labor market experience in the host country while household labor income can increase over time as household members improve their educational attainment over time, gain labor market experience or increase household labor supply over time (children become adults). Moreover, we assume that no moral hazard is involved in the sense of household members reducing effort over time. Then, the time profile of remittance behavior would depend on the earnings profiles of the migrants and the households. Whether remittances increase or decline over time will depend on the relative changes in the time profile of the migrant’s wages and the household’s income. A greater number of years since the migration implies more labor market experience, which in turn implies higher wages and higher remittances. On the other hand, higher household income over time implies lower remittances. Thus, the relationship between migrant worker remit- tances and the length of stay in the host country might be non-monotonic over time. t a 3. Empirical Approach 3.1. Reduced form of Remittances Equation The reduced form expression for the binary choice variable determining the fraction of migrants who do remit and the size of remittances is given by: max,,,, 0, m aaWRZlX ijiijjj (9) for and. The set of observable variables included in (9) is used to approximate equation (8) as follows. First, i denotes a vector that includes all characteristics of the individual migrant that de- termine migrant wages in the host country, including years of experience in the host country, destination country (wages vary across developed countries), moti- vation for leaving the source country and the migrant’s education level prior to migration. Next, ij is a vector that represents migrant ’s status within household (i.e. the migrant is the household head’s spouse, parent, child, etc.) and is used to approximate migrant ’s degree of altruism toward household .13 j =1, ,iM=1 , ,j W i S i Rj i j is a vec- tor that includes all characteristics of household that determine its labor income (education level of house- hold’s head, ratio of children to adults within the house- hold and gender of household’s head). Finally, j m lj re- presents the number of migrants within household . According to the discussion above, there are five testable hypotheses associated with the migrant’s de- cision to remit and the amount to be transferred to her relatives in the source country. First, migrants with higher labor income are more likely to remit and tend to remit more. Second, households with lower income tend to receive more remittances. Third, both the likelihood of remitting and remittance size are positively related to the degree of proximity between the migrants and the remaining household members in the source country. Fourth, the relationship between migrant worker remit- tances and the length of stay in the host country might be non-monotonic over time. Fifth, remittances per migrant are ambiguously associated with the number of migrants within the same household. 11[5] examines this relationship in a multi-period model. He shows that migrant remittance behavior and time since migration are ambiguously determined. 12That is, ,, >= = , 0Otherwise. fmh mh wllw llw tjtjt jt jt ff if ww tt am l ij tj 13Usually the unobservable migrant’s degree of altruism is approxi- mated by a vector of observable variables that measure the degree o roximity between individual migrants and their families in the source country, which is the case in [4,5,8], among others. Copyright © 2013 SciRes. ME 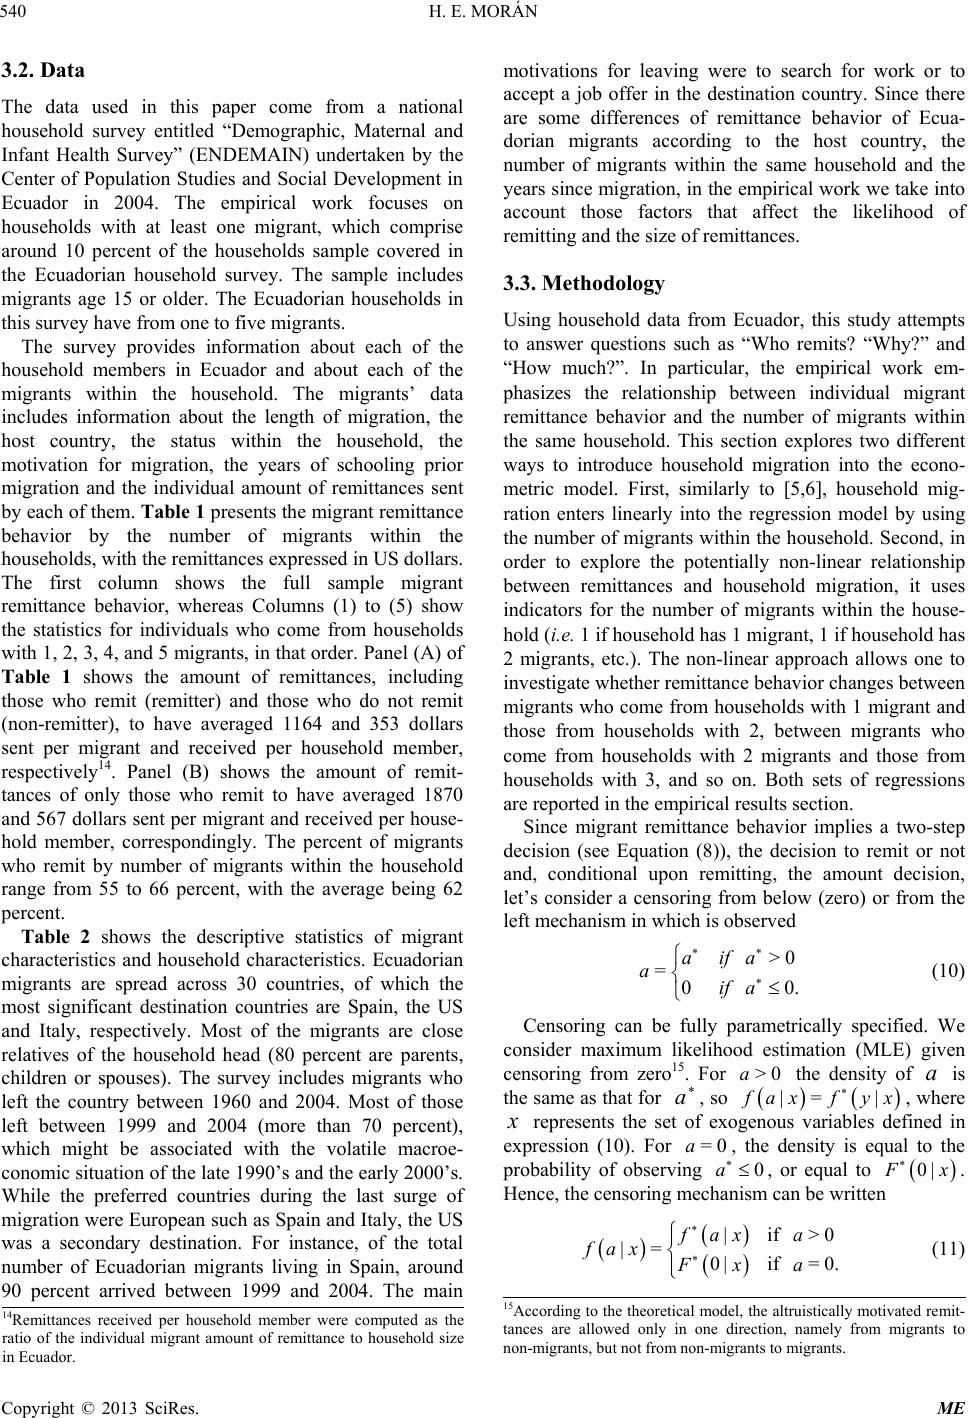 H. E. MORÁN 540 3.2. Data The data used in this paper come from a national household survey entitled “Demographic, Maternal and Infant Health Survey” (ENDEMAIN) undertaken by the Center of Population Studies and Social Development in Ecuador in 2004. The empirical work focuses on households with at least one migrant, which comprise around 10 percent of the households sample covered in the Ecuadorian household survey. The sample includes migrants age 15 or older. The Ecuadorian households in this survey have from one to five migrants. The survey provides information about each of the household members in Ecuador and about each of the migrants within the household. The migrants’ data includes information about the length of migration, the host country, the status within the household, the motivation for migration, the years of schooling prior migration and the individual amount of remittances sent by each of them. Table 1 presents the migrant remittance behavior by the number of migrants within the households, with the remittances expressed in US dollars. The first column shows the full sample migrant remittance behavior, whereas Columns (1) to (5) show the statistics for individuals who come from households with 1, 2, 3, 4, and 5 migrants, in that order. Panel (A) of Table 1 shows the amount of remittances, including those who remit (remitter) and those who do not remit (non-remitter), to have averaged 1164 and 353 dollars sent per migrant and received per household member, respectively14. Panel (B) shows the amount of remit- tances of only those who remit to have averaged 1870 and 567 dollars sent per migrant and received per house- hold member, correspondingly. The percent of migrants who remit by number of migrants within the household range from 55 to 66 percent, with the average being 62 percent. Table 2 shows the descriptive statistics of migrant characteristics and household characteristics. Ecuadorian migrants are spread across 30 countries, of which the most significant destination countries are Spain, the US and Italy, respectively. Most of the migrants are close relatives of the household head (80 percent are parents, children or spouses). The survey includes migrants who left the country between 1960 and 2004. Most of those left between 1999 and 2004 (more than 70 percent), which might be associated with the volatile macroe- conomic situation of the late 1990’s and the early 2000’s. While the preferred countries during the last surge of migration were European such as Spain and Italy, the US was a secondary destination. For instance, of the total number of Ecuadorian migrants living in Spain, around 90 percent arrived between 1999 and 2004. The main motivations for leaving were to search for work or to accept a job offer in the destination country. Since there are some differences of remittance behavior of Ecua- dorian migrants according to the host country, the number of migrants within the same household and the years since migration, in the empirical work we take into account those factors that affect the likelihood of remitting and the size of remittances. 3.3. Methodology Using household data from Ecuador, this study attempts to answer questions such as “Who remits? “Why?” and “How much?”. In particular, the empirical work em- phasizes the relationship between individual migrant remittance behavior and the number of migrants within the same household. This section explores two different ways to introduce household migration into the econo- metric model. First, similarly to [5,6], household mig- ration enters linearly into the regression model by using the number of migrants within the household. Second, in order to explore the potentially non-linear relationship between remittances and household migration, it uses indicators for the number of migrants within the house- hold (i.e. 1 if household has 1 migrant, 1 if household has 2 migrants, etc.). The non-linear approach allows one to investigate whether remittance behavior changes between migrants who come from households with 1 migrant and those from households with 2, between migrants who come from households with 2 migrants and those from households with 3, and so on. Both sets of regressions are reported in the empirical results section. Since migrant remittance behavior implies a two-step decision (see Equation (8)), the decision to remit or not and, conditional upon remitting, the amount decision, let’s consider a censoring from below (zero) or from the left mechanism in which is observed >0 =00 aifa aif a . (10) Censoring can be fully parametrically specified. We consider maximum likelihood estimation (MLE) given censoring from zero15. For the density of is the same as that for , so >0aa a |= | axfyx , where represents the set of exogenous variables defined in expression (10). For , the density is equal to the probability of observing , or equal to =0 a a 0 0| x . Hence, the censoring mechanism can be written |if> |= 0|if =0. fax a fax Fx a 0 (11) 15According to the theoretical model, the altruistically motivated remit- tances are allowed only in one direction, namely from migrants to non-migrants, but not from non-migrants to migrants. 14Remittances received per household member were computed as the ratio of the individual migrant amount of remittance to household size in Ecuador. Copyright © 2013 SciRes. ME  H. E. MORÁN Copyright © 2013 SciRes. ME 541 Table 1. Ecuadorian migrant remittance be havior by number of migrants wi thin the household. Number of Migrants within the Household Variables Full Sample One Two Three Four Five A. Remitter and Non-Remitter Remittances per migrant 1,164 1,539 879 843 808 749 Remittances per household member 353 490 257 261 201 146 Number of observations 1529 705 389 202 149 84 B. Only Remitter Remittances per migrant 1870 2369 1500 1281 1469 1234 Remittances per household member 567 754 438 397 365 241 Number of observations 952 458 228 133 82 51 C. Percentage of migrants who remit 0.62 0.65 0.59 0.66 0.55 0.61 Data Source: 2004 Demographic, Maternal, and Infant Health Survey, Center of Population Studies and Social Development, Ecuador. Remittances are ex- pressed in U.S. dollars. Table 2. Ecuador: Migrant and Non-migrant characteristics. Number of Migrants within the Household Variables Full Sample One Two Three Four Five A. Household characteristics Size of migration 2.030 1 2 3 4 5 Migration rate 0.337 0.235 0.360 0.452 0.470 0.584 Household’s head is female 0.332 0.381 0.254 0.356 0.281 0.309 Years of schooling 6.5 7.4 6.2 5.9 5.2 5.0 Ratio children to adults 19.25 21.92 17.05 15.1 21.1 13.4 B. Migrant characteristics B1. Length of migration From 0 to 1 year 0.147 0.173 0.118 0.173 0.114 0.071 From 2 to 5 years 0.599 0.639 0.614 0.475 0.510 0.654 Years since migration 4.9 4.4 5.3 5.3 5.8 5 B2. Host Country Host country is Spain 0.454 0.496 0.437 0.381 0.463 0.345 Host country is Italy 0.057 0.069 0.061 0.039 0.040 0.011 Host country is other (27 others) 0.068 0.093 0.061 0.034 0.053 0 B3. Status within the household Migrant is not a close relative 0.207 0.194 0.205 0.287 0.154 0.226 B4. motive for migration Left for studying/unifying family 0.170 0.180 0.179 0.138 0.100 0.238 B5. Education Years of schooling 9.8 10.1 9.8 8.9 10.0 9.3 Data Source: 2004 Demographic, Maternal, and Infant Health Survey, Center of Population Studies and Social Development, Ecuador. Total annual and aver- age annual remittances are expressed in US dollars. Household size was computed by adding up the number of migrants within the household and the number of individuals age 15 or older within the household who stay in Ecuador.  H. E. MORÁN 542 Now, let an indicator variable be introduced 1if >0 =0if =0, a da (12) and therefore the conditional density given censoring from zero is given by 1 |= |0| dd faxf axFx . (13) For a sample of independent observations, the censored MLE for the migrant remittance behavior maximizes N =1 =,10 N Niiiii i lnLd lnfaxdlnFx ,, (14) where are the parameters of the distribution of . The censored MLE is consistent and asymptotically normal, provided that the density of the uncensored variable is correctly specified a , ii fax 16. A few econometric issues arise in the estimation of expression (14), however. First, since there is a considerable number of zeros on the left side of (14), 38 percent of migrants do not remit, one has to take into account the zero- inflated issue. Second, since the Tobit estimation makes a strong assumption that the same probability mechanism generates both the zeros and the positive value of remittances, the Tobit estimates are biased if there is heteroscedasticity in the residuals of the participation regression and/or outcome regression. To account for these econometric issues, the zero-inflated nature of the dependent variable and the biased estimates from the standard Tobit model, a censored or two-part model is used, which is more flexible to allow for the possibility that the zero and positive values are generated by different mechanisms.17 Hence, the two-part estimation employs a logit regression for the censoring mechanism (decision to remit or not) and, conditional on the out- come (amount decision) being observed, it uses a log- normal model for remittance size18. The two parts are assumed to be independent and estimated separately as shown in the next section19. Moreover, since correlation among error terms of all migrants experiencing the same shocks within a given host country may bias the sample errors downward, all standard errors ijf are clustered by the migrant’s host country. The econometric work estimates the following model to examine the determinants of remittance behavior: =max,0 , m ijj ijf ijf ijf lR Z aa i W j (15) where ijf is a binary variable which takes the value of one or zero for the migrant decision to remit or not to remit and, conditional on the sending of remittances, it measures the annual amount of remittances sent by individual migrant to household from host country a i , is the migration size or the indicator of the number of migrants from household , ij is a dummy indicating migrant ’s relationship with the household head in the source country, i is a vector of dummy variables that includes all characteristics of migrant including her host country, length of stay, education level prior to migration and motives for leaving the source country, and j m j ljR iW i denotes a vector of household characteristics, which includes the gender of the household’s head and the ratio of children to adults within the household. 4. Results The main results of the estimates of the determinants of remittances in Ecuador are shown in Tables 3-6, in which we report the estimates of the two-part model of Equation (15). The dependent variable for the logit regression model is equal to 1 if the migrant remits and equal to 0 if the migrant does not remit. For the OLS regression model, the dependent variable in Tables 3 and 4 is the log of the annual amount of remittances, in U.S. dollars, sent per each migrant, whereas in Tables 5 and 6 the dependent variable is the annual amount of remit- tances, in US dollars, received per household member in Ecuador. Columns (1) and (2) show the average marginal probability computed from the logit regression model for the decision to remit or not to remit and Columns (3) and (4) report the estimates of OLS regression to examine the determinants of the amount of remittances20. The only difference between Column) and (2) and between 16For a further discussion see [23,24]. 17The distribution that applies to is a mixture of discrete and continu- ous distributions. Under such circumstances, there are a variety of mo- dels that could be estimated to account for the combined nature of the distribution of . See [7] for a discussion on those alternative models. i a i a 18Here, to ensure a positive value for the dependent variable, the density should be that for a positive-valued random variable, such as the log-normal, or an appropriate density such as the normal truncated distribution from below at zero. Also, in a random utility model (RUM) which is compatible with the theoretical model discussed in this paper, assuming that the random component of both utilities are extreme value Type I distributed, it can be shown that the resultant distribution is a logistic distribution for the censoring mechanism. Hence, the logistic distribution assumption for the censoring mechanism is a proper as- sumption here, but also one can assume a probit model and the esti- mates would be unchanged. s (1 19Allowing for the errors to be correlated as assumed in the sample selection model (MLE and the two-step Heckman sample selection model) does not affect the main findings of the empirical work shown in the next section. This is because both the inverse Mill’s ratio and the correlation between errors of the decision to remit or not and the amount decision regression are statistically insignificant (results can be provided upon request to the author). 20Notice that the estimates reported in Columns (1) and (2) of tables 3 and 5 are the same because the dependent variable for the logit regres- sions is the same in both tables, namely equal to 1 if the migrant remits and equal to 0 if the migrant does not remit. For the same reason, the estimates in Columns (1) and (2) of tables 4 and 6 are the same. Copyright © 2013 SciRes. ME  H. E. MORÁN 543 Table 3. Equal to 1 if migrant remits for the logit model and the log of individual migrant remittances in US dollars for the OLS model. Two Part Model Variable Logit Model (AME) OLS Model (1) (2) (3) (4) A. Household (HH) Characteristics Size of migration −0.020** −0.020*** −0.137*** −0.137*** (0.0098) (0.0076) (0.0374) (0.0409) HH head is female 0.119*** 0.119*** 0.347*** 0.347*** (0.0248) (0.0156) (0.0923) (0.1179) Ratio of children to adults 0.0022*** 0.002*** 0.012*** 0.012*** (0.0006) (0.0006) (0.0026) (0.0012) B. Migrant Characteristics Length since migration 0.017** 0.017*** −0.062*** −0.062*** (0.0088) (0.0051) (0.0228) (0.0206) Length since migration squared −0.001* −0.001*** 0.002** 0.002*** (0.0004) (0.0001) (0.0008) (0.0004) Host country is Spain −0.023 −0.023*** −0.201* −0.201*** (0.0269) (0.0075) (0.1031) (0.0328) Host country is Italy −0.009 −0.009 −0.152 −0.152** (0.0527) (0.0102) (0.1920) (0.0560) Host country is other (27 others) −0.208*** −0.208*** −0.151 −0.151 (0.0512) (0.0730) (0.2471) (0.2107) Migrant is not a close relative −0.238*** −0.238*** −0.224* −0.224* (0.0301) (0.0444) (0.1295) (0.1169) Left for studying or unifying family −0.149*** −0.1493*** −0.459*** −0.459* (0.0336) (0.0551) (0.1423) (0.2392) Years of schooling −0.004 −0.0042 0.035*** 0.035** (0.0029) (0.0032) (0.0115) (0.0123) Observations 1529 1529 952 952 Data Source: 2004 Demographic, Maternal and Infant Health Survey, Center of Population Studies and Social Development, Ecuador. While Columns (1) and (3) report robust standard errors, Columns (2) and (4) report cluster—robust standard errors at the migrant host country level. Coefficients of the logit model are the average marginal effects (AME), which are computed using the added command margeff. * significant at 10%, ** significant at 5%, and *** significant at 1%. Copyright © 2013 SciRes. ME  H. E. MORÁN 544 Table 4. Equal to 1 if migrant remits for the logit model and the log of individual migrant remittances in US dollars for the OLS model. Two Part Model Logit Model (AME) OLS Model Variable (1) (2) (3) (4) A. Household (HH) Characteristics HH has 2 migrants −0.051* −0.051 −0.321*** −0.321*** (0.0298) (0.0451) (0.1106) (0.0548) HH has 3 migrants 0.016 0.016 −0.352** −0.352*** (0.0390) (0.0612) (0.1461) (0.1033) HH has 4 migrants −0.137*** −0.137*** −0.239 −0.239** (0.0428) (0.0441) (0.1480) (0.1131) HH has 5 migrants −0.037 −0.037 −0.686*** −0.686* (0.0535) (0.0446) (0.1986) (0.3503) HH head is female 0.114*** 0.114*** 0.344*** 0.344*** (0.0250) (0.0136) (0.0924) (0.1123) Ratio of children to adults 0.002*** 0.002*** 0.012*** 0.012*** (0.0006) (0.0007) (0.0026) (0.0014) B. Migrant Characteristics Length since migration 0.0191** 0.019*** −0.066*** −0.066*** (0.0089) (0.0047) (0.0229) (0.0195) Length since migration squared −0.001* −0.001*** 0.002** 0.002*** (0.0004) (0.0001) (0.0008) (0.0004) Host country is Spain −0.017 −0.017** −0.227** −0.227*** (0.0268) (0.0078) (0.1043) (0.0383) Host country is Italy −0.004 −0.0042 −0.161 −0.161** (0.0521) (0.0128) (0.1928) (0.0588) Host country is other (27 others) −0.200*** −0.200*** −0.178 −0.178 (0.0521) (0.0748) (0.2514) (0.2138) Close relative −0.246*** −0.246*** −0.209 −0.209 (0.0300) (0.0408) (0.1317) (0.1302) Left for studying or unifying Family −0.152*** −0.152*** −0.440*** −0.440* (0.0335) (0.0484) (0.1419) (0.2132) Years of schooling −0.003 −0.003 0.034*** 0.034** (0.0028) (0.0037) (0.0116) (0.0143) Data Source: 2004 Demographic, Maternal and Infant Health Survey, Center of Population Studies and Social Development, Ecuador. While Columns (1) and (3) report robust standard errors, Columns (2) and (4) report cluster—robust standard errors at the migrant host country level. Coefficients of the logit model are the average marginal effects (AME), which are computed using the added command margeff. * significant at 10%, ** significant at 5%, and *** significant at 1%. Copyright © 2013 SciRes. ME  H. E. MORÁN Copyright © 2013 SciRes. ME 545 Table 5. Equal to 1 if migrant remits for the logit model and the log of individual migrant remittances per household member (receivers) in US Dollars for the OLS model. Two Part Model Logit Model (AME) OLS Model Variable (1) (2) (3) (4) A. Household (HH) Characteristics Size of migration −0.020** −0.020*** −0.185*** −0.185*** (0.0098) (0.0076) (0.0370) (0.0307) HH head is female 0.119*** 0.119*** 0.675*** 0.675*** (0.0248) (0.0156) (0.0923) (0.1421) Ratio of children to adults 0.002*** 0.002*** −0.007*** −0.007*** (0.0006) (0.0006) (0.0026) (0.0015) B. Migrant Characteristics Length since migration 0.017** 0.017*** −0.057** −0.057** (0.0088) (0.0051) (0.0224) (0.0247) Length since migration squared −0.001* −0.001*** 0.002*** 0.002*** (0.0004) (0.0001) (0.0007) (0.0006) Host country is Spain −0.023 −0.023*** −0.121 −0.121*** (0.0269) (0.0075) (0.1031) (0.0406) Host country is Italy −0.0098 −0.009 −0.036 −0.036 (0.0527) (0.0102) (0.2057) (0.0443) Host country is other (27 more) −0.208*** −0.208*** −0.059 −0.059 (0.0512) (0.0730) (0.2745) (0.2178) Migrant is not a close relative −0.238*** −0.238*** −0.273** −0.273** (0.0301) (0.0444) (0.1320) (0.1088) Left for studying/unifying family −0.149*** −0.149*** −0.440*** −0.440* (0.0336) (0.0551) (0.1454) (0.2203) Years of schooling −0.004 −0.004 0.044*** 0.044*** (0.0029) (0.0032) (0.0115) (0.0085) Data Source: 2004 Demographic, Maternal and Infant Health Survey, Center of Population Studies and Social Development, Ecuador. While Columns (1) and (3) report robust standard errors, Columns (2) and (4) report cluster—robust standard errors at the migrant host country level. Coefficients of the logit model are the average marginal effect (AME), which are computed using the added stata command margeff* significant at 10%, ** significant at 5%, and *** significant at 1%. Columns (3) and (4) of those tables is that Columns (1) and (3) report the standard-robust errors and Columns (2) and (4) report the cluster-robust standard errors at the migrant host country level. Tables 3 and 5 provide the estimation results for the model with linear household migration (size of migration), whereas Tables 4 and 6 give the results for the model with non-linear household migration (dummies for the number of migrants within the household). The estimates shown by Table 3 are qualitatively similar to those findings reported by Table 5, while the estimates of Table 4 are also similar to those results  H. E. MORÁN 546 Table 6. Equal to 1 if migrant remits for the logit model and the log of individual migrant remittances per household member (receivers) in US dollars for the OLS model. Two Part Model Variable Logit Model (AME) OLS Model (1) (2) (3) (4) A. Household (HH) Characteristics HH has 2 migrants −0.051* −0.051 −0.436*** −0.436*** (0.0298) (0.0451) (0.1122) (0.0431) HH has 3 migrants 0.016 0.016 −0.461*** −0.461*** (0.0390) (0.0612) (0.1509) (0.0909) HH has 4 migrants −0.137*** −0.137*** −0.367** −0.367*** (0.0428) (0.0441) (0.1458) (0.1127) HH has 5 migrants −0.037 −0.037 −0.894*** −0.894*** (0.0535) (0.0446) (0.1943) (0.3011) HH head is female 0.114*** 0.114*** 0.669*** 0.669*** (0.0250) (0.0136) (0.0923) (0.1373) Ratio children to adults 0.002*** 0.002*** −0.008*** −0.008*** (0.0006) (0.0007) (0.0026) (0.0015) B. Migrant Characteristics Length of migration 0.019** 0.019*** −0.061*** −0.061** (0.0089) (0.0047) (0.0226) (0.0234) Length since migration squared −0.001* −0.001*** 0.002*** 0.002*** (0.0004) (0.0001) (0.0007) (0.0006) Host country Spain −0.0170 −0.017** −0.152 −0.152*** (0.0268) (0.0078) (0.1045) (0.0406) Host country is Italy −0.0042 −0.0042 −0.047 −0.047 (0.0521) (0.0128) (0.2058) (0.0487) Host country other (27 others) −0.200*** −0.200*** −0.090 −0.090 (0.0521) (0.0748) (0.2805) (0.2233) Close relative −0.2469*** −0.246*** −0.256* −0.256** (0.0300) (0.0408) (0.1342) (0.1121) Left for studying −0.152*** −0.152*** −0.419*** −0.419** (0.0335) (0.0484) (0.1449) (0.1894) Years of schooling −0.003 −0.003 0.044*** 0.044*** (0.0028) (0.0037) (0.0116) (0.0102) Data Source: 2004 Demographic, Maternal and Infant Health Survey, Center of Population Studies and Social Development, Ecuador. While Columns (1) and (3) report robust standard errors, Columns (2) and (4) report cluster—robust standard errors at the migrant host country level. Coefficients of the logit model are the average marginal effects (AME), which are computed using the added stata command margeff. * significant at 10%, ** significant at 5%, and *** significant at 1%. Copyright © 2013 SciRes. ME  H. E. MORÁN 547 shown by Table 621. Therefore, the estimates shown in this paper seem to be robust to an alternative measure of remittance size. The results for Ecuadorian migrants are generally sup- portive of the predictions of the model. Tables 3 and 5 show that there is a negative relationship between mig- rant remittance behavior and the migration size within the same household. Both the decision to remit and the size of remittance are negatively associated with mig- ration size and are statistically significant22. If the mig- ration size increases by 1 migrant, the likelihood of sen- ding or receiving remittances decline, on average, 2 per- cent and the amount sent per migrant and received per household member decline, on average, 13.7 and 18.5 percent, respectively. Even though this result may be consistent with the prediction of the theoretical model, it might require a deeper inspection23. It could be induced by the large difference between the amount sent by individual migrants who come from households with one migrant and the amount sent by those who come from households with more than one migrant. In fact, the average amount of remittances sent by those individuals who are the sole migrants within their households is almost twice as large as that sent by those who come from households with 2, 3 and 4 migrants (see Table 1). In order to show a more complete picture of the relationship between migrant remittance behavior and household migration, Tables 4 and 6 show the estimates of indicators for those coming from households with 2, 3, 4 or 5 migrants, where the omitted group is migrants who are the sole migrants within their households. As expected, the amount of remittance sent by individual migrants who come from households with 2 to 5 mig- rants is significantly lower than that sent by individuals who are the sole migrants within their household. As follows from Table 4, the migrants who come from households with 2, 3, 4 and 5 migrants remit 32.1, 35.2, 23.9 and 34.4 percent less, respectively, than the mig- rants who come from households with one migrant. Si- milarly from Table 6, the amount received per house- hold member with 2, 3, 4, and 5 migrants is 43.6, 46.1, 36.7 and 89.4 percent lower, in that order, than the amount received by those individuals from households with only one migrant, in that order. However, only those individuals who come from households with 4 migrants have a statistically significant lower likelihood of remit- ting than those from households with only 1 migrant (−13.7 percent). A closer inspection of the estimates of the remittance size regression reveals that coefficients for migrants who come from households with 2, 3 and 4 migrants are not statistically different24. However, migrants who come from households with 5 migrants tend to remit a significantly lower amount of remittances than those migrants who come from households with 2, 3 or 4 migrants. These findings suggest that remittance size and household migration are no increasing associated. Hence, it seems that when migration size changes from 2 to 3 and from 3 to 4 migrants within the same household, the forgone household income due to migration might have a positive effect on altruistically motivated remittances, which compensates for the negative effect of the increased number of migrants on the individual amount of remittances. If there is a positive selection of migrants in the sense that the more educated individuals within the household are those who migrate, then one would expect that the forgone household income due to migration is higher than when there is a negative selection. According to the Ecuadorian data of households with at least 1 migrant, prior to migration the individuals who left had a higher education level than those relatives left behind. The average years of schooling of the migrants was 3.5 years higher than the non-migrants. Moreover, the higher the migration rate within a household, the more the labor supply of that household is reduced25. The results of allowing a non-linear relationship between migrant remi- ttance behavior and household migration are partially distinguished from those reached when there is a linear relationship (Tables 3 and 5) and also contrast with the predictions of rent-seeking literature. Summarizing, the empirical evidence discussed above suggests that migrant worker remittance behavior is a non-increasing function of the number of migrants within the household. 21Notice that the same regressors that are statistically significant in Ta- ble 3 are significant in Table 5 as well. In general, the same applies for the estimates reported by Tables 4 and 6, except for the coefficients o the regressors of both “migrant’s host country is Italy” and “migrant’s status within the family is not a close relative”. The migrant’s host country coefficient is statistically significant in Table 4, but it is not in Table 6 and the migrant’s status within the household is not statistically significant in Table 4, but it is in Table 6. 22Henceforth the magnitude results shown here are taken from Tables 4 and 6. The estimates of the logit regressions are the same in both tables, but the estimates of the OLS regression are different, namely, the esti- mates of Table 4 refer to amount sent per migrant and the estimates o Table 6 refer to the amount received per household member in Ecua- dor. 23The theoretical model described above predicts that more migrants imply lower remittances by the Nash assumption. If this effect over- comes the implied reduction of household income due to the forgone earnings, then migrant remittance behavior and migration size would be ne ativel associated. This paper also finds robust evidence in favor of altruistically motivated remittance behavior. There are several signs that remittances might be altruistically mo- tivated. First, households headed by females are more likely both to receive and to receive more remittances than households whose heads are males. If the house- holds’ heads are females, they are on average, 11.4 per- 24One cannot reject the null hypothesis that coefficients are equal. 25Here, migration rate is defined as the ratio of the number of migrants within the household to the total number of individuals age 15 or olde within the household (including migrants). Copyright © 2013 SciRes. ME  H. E. MORÁN 548 cent more likely to receive remittances than households headed by males and when the former do receive remit- tances, the amount sent per migrant and received per household member is 34.4 and 66.9 percent higher, res- pectively, than the amount sent to and received by the latter households. The facts that the female labor parti- cipation rate is likely lower than the male labor parti- cipation rate in developing countries and that female wages are likely lower than those earned by their male counterparts support the altruistically motivated remit- tance hypothesis. Second, households with higher ratios of children to adults are more likely to receive remit- tances and in greater amounts. When the percentage of children within the households increases 1 percent, the probability of sending or receiving remittances increases 0.2 percent and the amount sent per migrant and received per household member increases 1.2 and 0.8 percent, respectively. A higher child ratio means lower labor income per individual within the household and this result implies that such households are more likely to receive remittances and to receive more than households with a lower ratio of children to adults. According to the Ecuadorian data, of the sample of households with at least one migrant, less than 7 percent of the children were involved in household labor activities or in remunerated labor. The migrant’s status within the household is also relevant in determining remittance behavior. Migrants who are not spouses, parents or children of the remaining household head are less likely to send money and send less than those who are. When the migrant is not a close relative of the household’s head, the likelihood of sen- ding remittances is 24.6 percent lower than when mig- rants are close relative. The amount received per house- hold member from migrants who are not close relatives is 25.6 percent lower than the amount received from mig- rants who are close relatives. Migrants whose motivation for migration was studying or unifying the family are less likely to remit (−15.2 percent) and remit less than migrants whose motivation for migration was the search for work or accepting a labor offer in the host country. The elasticity of the amount sent per migrant and re- ceived per household member with respect to the migrant’s left for studying or unifying family is equal to 44.0 and 41.9 percent, respectively. Finally, the mig- rant’s years of schooling are not significantly correlated with the probability to remit, but of those migrants who remit, the more educated persons tend to send a higher amount of remittances26. The elasticity of the amount sent per migrant and received per household member with respect to the migrant’s years of schooling is equal to 3.4 and 4.4 percent, respectively. Also of note, while the relationship between the likelihood of remitting and the length of time since migration seems to show a kind of U-inverse-shaped curve (increasing at the beginning of the stay in the host country and declining later), the relationship between the amount of remittances and the length of stay appears to show a U-shaped curve27. The migrant’s host country also seems to be important in explaining migrant worker remittance behavior. Ecuadorian migrants who moved to Spain are 1.7 percent less likely to remit and remit 22.7 percent less than those migrants whose destination country was the United States, which might reflect the lower unemployment rate and the higher potential earnings in the United States relative to Spain. According to World Bank data, while the per capita income in the US was 36,451 dollars in 2004 (constant 2000 U.S. dollars), the per capita incomes in Spain was 15,356 dollars in 2004. Likewise, the unemployment rates in the US and Spain in 2004 were 6 percent and 11 percent, respectively. The fact that European countries such as Spain and Italy were choices for Ecuadorian migrants, despite the lower potential earnings there relative to the US, could reveal the depth of the decline of per capita income in Ecuador during the last migration surge (1999 to 2004). Thus, it might suggest that the extent of the income differential became sufficiently high that migration to Spain and Italy was then profitable, which perhaps would not happen given a predominance of long term economic conditions. As a matter of fact, before 1999 the preferred destination country for Ecuadorian migrants was the US. 5. Conclusions and Final Comments The analytical model developed in this paper analyzes the determinants of individual migrant remittance beha- vior and extends the altruism-based frameworks propo- sed by [4,5]. This model predicts that migrants with higher labor income are more likely to remit and tend to remit more, households with lower income tend to re- ceive more remittances, both the likelihood of remitting and remittance size are positively related to the degree of proximity between the migrants and the remaining hou- 27Additional estimations using dummies instead of years of stay show that migrants who left the source country within 5 years tend to remit more than those migrants who stayed in the host country for more than 5 years. However, the probability to remit is not significantly affected y the migrant’s years of stay in the host country. [4] links duration o migration with remittances as follows: “If out of sight, out of mind were the rule, one should expect remittances to fade with duration o absence. If repayment of school costs were the target, again remittances should ultimately cease”. Therefore, another competing hypothesis that may justify the remittance behavior reported here would be “repayment motives”, which may include repayments of incurred moving costs or repayments of education costs. A further discussion can be seen in [9], in which the authors contrast predictions of competing hypotheses. 26This finding is similar to that found by [8], where remittances are more likely motivated by investment motives or saving motives in the source country. It is also consistent with the predictions of repay- ment-motivated remittances. Copyright © 2013 SciRes. ME  H. E. MORÁN 549 sehold members in the source country and the rela- tionship between migrant worker remittances and the length of stay in the host country might be non-mono- tonic over time. It also demonstrates that when forgone household labor income is taken into account the indivi- dual migrant remittance is a non-increasing function of household migration size. The main findings in the empi- rical part of this paper are generally supportive of the predictions of the model. Future research related to remittances might be fo- cused on the consequences of remittances for developing countries. Remittances may prove poverty-alleviating and reduce inequality, either directly through flows to the poor, if not the poorest, or indirectly through a stimulant effect on the local economy. Moreover, remittances may have long-term effects by overcoming liquidity con- straints and allowing investment in the education and health care of receiving families. Similarly, remittances create a stable source of income which has a positive effect on exchange reserves and the balance of payments and might enhance financial development in small cities or towns of the source country. As foreign exchange inflow, remittances enter the economy in a different way than private capital inflows, foreign investment or financial aid, and, until now, there is no systematic study for a better understanding of those differences. In fact, macroeconomic effects remain poorly modeled and poorly understood. What particularly lacking are models that may facilitate the evaluation of both migration and remittance effects. However, many nations, like Ecuador, presume major benefits from remittance inflow and some actively promote additional flow, both through efforts to lower transfer fees and through offers of alternatives for investment with government and inter- national agency support. 6. Acknowledgements I would like to thank Gerhard Glomm, Michael Alexeev, Rubiana Chamarbagwala and Ricardo López for insight- ful comments and suggestions. Any errors are the respon- sibility of the author. The views expressed here are of the author only and do not necessarily reflect the views of the Banco de Guatemala. REFERENCES [1] E. Taylor, “The New Economics of Labor Migration and the Role of Remittances in the Migration Process,” In- ternational Migration, Vol. 37, No. 1, 1999, pp. 63-88. doi:10.1111/1468-2435.00066 [2] B. Jokisch, “Ecuador: Diversity in Migration,” March 01 2007. www.migrationinformation.org [3] I. D. B. América, “Why emigrate?”. www.iadb.org/idbamerica/index.cfm [4] R. Lucas and O. Stark, “Motivations to Remit: Evidence from Botswana,” Journal of Political Economy, Vol. 93, No. 5, 1985, pp. 901-918. doi:10.1086/261341 [5] E. Funkhouser, “Remittances from International Migra- tion: A Comparison of el Salvador and Nicaragua,” The Review of Economics and Statistics, Vol. 77, No. 1, 1995, pp. 137-146. doi:10.2307/2109999 [6] R. Agarwal and A. Horowitz, “Are International Remit- tances Altruism or Insurance? Evidence from Guyana Using Multiple-Migrant Households,” World Develop- ment, Vol. 30, No. 11, 2002, pp. 2033-2044. doi:10.1016/S0305-750X(02)00118-3 [7] C. Amuedo-Dorantes and S. Pozo, “Remittances as In- surance: Evidence from Mexican Immigrants,” Journal of Population Economics, Vol. 19, No. 2, 2006, pp. 227-254. doi:10.1007/s00148-006-0079-6 [8] U. Osili, “Remittances and Savings from International Migration: Theory and Evidence Using a Matched Sam- ple,” Journal of Development Economics, Vol. 82, No. 3, 2007, pp. 446-465. doi:10.1016/j.jdeveco.2006.06.003 [9] F. Docquier and H. Rapoport, “The Economics of Mi- grants’ Remittances,” In: A. Gerard-Varet, C. Kolm, and J. Mercier-Ythier, Eds., Handbook on the Economics of Giving, Reciprocity, and Altruism, Vol. 2, Elevier, Am- sterdam, 2006, pp. 1135-1198. [10] World Bank, “World Development Indicators,”. www.worldbank.org [11] L. Sjaastad, “The Costs and Returns of Human Migra- tion,” Journal of Political Economy, Vol. 70, No. 5, 1962, pp. 80-93. doi:10.1086/258726 [12] M. Todaro, “A Model of Labour Migration and Urban Unemployment in LDCS,” American Economic Review, Vol. 59, No. 1, 1969, pp. 138-148, 1969. [13] G. Borjas, “Self-Selection and the Earnings of Immi- grants,” American Economic Review, Vol. 77, No. 4, 1987, pp. 531-553. doi:10.2307/2546424 [14] G. Borjas, “Economic Theory and International Migra- tion,” International Migration Review, Vol. 23, No. 3, 1989, pp. 457-485. [15] W. Carrington, E. Detragiache and T. Vishwanath, “Mi- gration with Endogenous Moving Costs,” American Eco- nomic Review, Vol. 86, No. 4, 1996, pp. 909-930. [16] S. Djajic, “Skills and the pattern of migration: the role of qualitative and quantitative restrictions on international labor mobility,” International Economic Review, Vol. 30, No. 4, 1989, pp. 795-809. doi:10.2307/2526752 [17] C. Dustmann, “Return Migration, Uncertainty and Pre- cautionary Savings,” Journal of Development Economics, Vol. 52, No. 2, 1997, pp. 295-316. doi:10.1016/S0304-3878(96)00450-6 [18] C. Dustmann, “Temporary Migration, Human Capital, and Language Fluency of Migrants,” Scandinavian Jour- nal of Economics, Vol. 101, No. 2, 1999, pp. 297-314. doi:10.1111/1467-9442.00158 [19] T. Bergstrom, L. Blume and H. Varian, “On the Private Provision of Public Goods,” Journal of Public Economics, Vol. 29, No. 1, 1986, pp. 25-49. doi:10.1016/0047-2727(86)90024-1 Copyright © 2013 SciRes. ME  H. E. MORÁN Copyright © 2013 SciRes. ME 550 [20] J. Andreoni, “Privately Provided Public Goods in a Large Economy: The Limits of Altruism,” Journal of Public Economics, Vol. 35, No. 1, 1988, pp. 57-73. doi:10.1016/0047-2727(88)90061-8 [21] J. Andreoni, “Impure Altruism and Donations to Public Goods: A Theory of Warm-Glow Giving,” Economic Journal, Vol. 100, No. 401, 1990, pp. 464-477. doi:10.2307/2234133 [22] M. Kotchen and M. Moore, “Private Provision of Envi- ronmental Public Goods: Household Participation in Green-Electricity Programs,” Journal of Environmental Economics and Management, Vol. 53, No. 1, 2007, pp. 1-16. doi:10.1016/j.jeem.2006.06.003 [23] A. Cameron and P. Trivedi, “Microeconometrics, Meth- ods and Applications,” Cambridge University Press, Cambridge, 2005. doi:10.1017/CBO9780511811241 [24] A. Cameron and P. Trivedi, “Microeconometrics Using Stata, “Stata Press, College Station, 2009.
|