Journal of Environmental Protection, 2013, 4, 24-27
http://dx.doi.org/10.4236/jep.2013.48A1004 Published Online August 2013 (http://www.scirp.org/journal/jep)
California’s Agriculture-Related Local Air Pollution Policy
C.-Y. Cynthia Lin
Faculty of Agricultural and Resource Economics, University of California at Davis, Davis, USA.
Email: cclin@primal.ucdavis.edu
Received May 8th, 2013; accepted June 13th, 2013; accepted July 25th, 2013
Copyright © 2013 C.-Y. Cynthia Lin. This is an open access article distributed under the Creative Commons Attribution License,
which permits unrestricted use, distribution, and reproduction in any medium, provided the original work is properly cited.
ABSTRACT
Air pollution is a critical environmental issue for California, which has some of the nation’s most polluted air basins
and also the nation’s most stringent set of state and local air qu ality standards. This paper reviews my previous work in
Lin (2011), in which I examine the effects of agriculture-related lo cal regulations in California on air quality, as meas-
ured by the number of exceedances of the CO and NO2 standards, by exploiting the natural variation in policy among
the different air districts in California. Agricultural burning policies and penalty fees reduce the pollution from CO.
Other policies such as the prohibition on visible emission, fu gitiv e du st, particulate matter, nitrog en and th e redu ction of
animal matter are correlated with higher levels of CO. Regulations on orchard and citrus heaters have no significant
effect on the number of exceedances of the CO and NO2 standards.
Keywords: Air Quality; Air Pollution; Pollution Control; Agriculture
1. Introduction
Air pollution has been recognized as a significant envi-
ronmental problem in California since the early 20th
century. Between 1905 and 1912, regulations were en-
acted by the city council of Los Angeles to regulate
emissions [1]. As motor vehicle traffic increased, a new
type of smog was observed and described: the “Los An-
geles” or photochemical smog, as distinct from the
“London” smog that resulted from coal combustion. Arie
Haagen-Smit from Caltech characterized the chemistry
of this smog and identified ozone as the principal oxidant
in the early 1950’s. Meanwhile, the first air district in the
U.S. was created in Los Angeles in 1947, and was later
merged with other local districts in 1977 to form the
South Coast Air Quality Management District [1].
Negative effects of air pollution have been extensively
documented, and include impairment of human lung
function, degradation of materials, and injury to plants.
In addition to affecting human health, the high ambient
ozone levels found in Southern California and the San
Joaquin Valley also cau se yield reductions up to 30 % for
some crops [2].
In addition to having some of the nation’s most pol-
luted air basins, California also has the nation’s most
stringent set of state and local air quality standards. Al-
though regulation has led to improvements in air quality
[3], exceedances of air quality standards still take place.
For example, between 1990 and 1998, the San Joaquin
Valley Air Basin experienced an average of 97 days per
year above the eight-hour ozone standard, while the Sac-
ramento Valley Air Basin experienced an average of 30
days per year above the standard during the same time
period [4].
Farming and livestock operations are significant sources
of emissions in California, and bear the negative effects
of specific air pollutants as well. Agriculture-related air
pollution results from pri mary emissions from machinery
and vehicles employed in production, chemical com-
pounds used in the course of production, e.g. pesticides,
as well as emissions from the agricultural systems them-
selves. For example, agricultural livestock emit nitrogen
compounds such as oxides of nitrogen (NOx) and ammo-
nia. Vehicles used in agricultural production emit volatile
organic compounds (VOCs), NOx and carbon monoxide
(CO) [5]. These emissions may lead to the formation of
secondary air pollutants, such as ozone, that are deleteri-
ous to worker s as we ll as crops [6].
This paper reviews my previous work in [7], in which
I examine whether existing air pollution control policies,
particularly those targeted at agriculture, have succeeded
in improving air quality, as measured by the number of
exceedances of the CO and NO2 standards. The follow-
ing air pollution control policies are examined: policies
and regulations for agricultural burning, visible emis-
sions, fugitive dust, emission of particulate matter (PM)
Copyright © 2013 SciRes. JEP
California’s Agriculture-Related Local Air Pollution Policy 25
and PM precursors, emissions of nitrogen compounds,
orchard and citrus heaters that release black carbon, and
penalty fees.
My work in [7] builds upon the ex isting environ mental
economics literature on air quality, most notably the
econometric analysis of the impact of federal particulate
matter regulation on infant health conducted by [8] and
the study of the impact of air pollution on infant death in
California by [9], in several ways. First, [7] focuses on
the effects of regulation rather than on the effects of air
quality. The results therefore have direct implication s for
policy. Second, the econo metric methodology used in [7]
exploits the natural variation in policy among the differ-
ent air districts in California to identify the effects of
these policies. Third, [7] examines multiple policies, not
just one.
Results from the multivariable regressions point to
mixed effects of the air pollution control policies on air
quality. Agricultural burning policies and penalty fees
reduce the pollution from CO. Other policies such as the
prohibition on visible emission, fugitive dust, particulate
matter, nitrogen and the reduction of animal matter are
correlated with higher levels of CO. Regulations on or-
chard and citrus heaters have no significant effect on the
number of exceedances of the CO and NO2 standards.
Results of this research will lead to a better under-
standing of the regulations affecting air quality, and will
provide insight into the appropriate development of
management practice to mitigate air pollution problems.
The remainder of the paper proceeds as follows. The
next section provides background information on the
state of California with respect to air quality manag ement.
Section 3 describes the data. Section 4 presents the
methods and results from the econometric analysis. Sec-
tion 5 concl u d e s.
2. California’s Air Pollution Policy
The state of California is divided into fifty-eight different
counties and is overseen by the Governor of California.
California is divided into thirty-five air districts, which
are called either Air Pollution Control Districts or Air
Quality Management Districts. These air districts are
responsible for controlling air pollution from stationary
sources. Several air districts span the areas of many
counties, while some counties belong to different air dis-
tricts. Some air districts, such as the Great Basin Unified
air district, trace the division lines marking the regional
air basin [10].
The different air districts in California have their own
set of laws and regulations regarding stationary sources.
These laws and regulations are written by the authorities
within the air district and are applicable to the entire air
district. These laws and regulations must be at least as
stringent as the standards set by the federal government
[11].
The fact that each air district has its own set of laws
and regulations is crucial to the analysis of the policies
presented in this paper. The variation between the poli-
cies of the different air districts within the state of Cali-
fornia provides a setting for a natural experiment. Since
the different air districts all fall in the same state, they are
subject to the same federal and state laws. The districts
also share many other similar characteristics, for example
climate, geographical location, etc. The variation in air
quality over the time the different policies take place,
then, must be due mostly to the policies themselves and
not due to geographical location, climate or different
state laws. Thus, the variation in similar policies across
air districts enables one to better single out the effect of
policies on air quality and health.
Among the many different laws and regulations gov-
erning each of the thirty-five air districts in California,
this paper focuses on the following eight types of policy:
1) Agricultural burning: This policy regulates open
outdoor fires used in agricultural operations in the grow-
ing of crops, the raising of animals, the disposal of agri-
business waste, or for purposes such as forest manage-
ment, range improvement, irrigation system management,
etc. The policy requires burning permits and imposes
no-burn days.
2) Visible emissions: This policy provides limits for
visible emissions. In many districts, emissions from ag-
ricultural operations are exempt.
3) Fugitive dust: The purpose of this policy is to re-
duce the amount of particulate matter entrained in the air
as a result of anthropogenic fugitive dust sources by re-
quiring actions to prevent, reduce or mitigate fugitive
dust emissions.
4) Particulate matter: This policy imposes limits on
particulate matter emissions.
5) Nitrogen: This policy imposes limits on NOx emis-
sions.
6) Reduction of animal matter: This policy requires
that the gases, vapors and gas-entrained effluents from
any article, machine equipment, or other contrivance
used for the reduction of animal matter to be incinerated
or processed.
7) Orchard and citrus heaters: This policy regulates
orchard and citrus heaters.
8) Penalty fee: Station ary sources with the potential to
emit regulated pollutants (including nitrogen oxides,
VOCs, CO and PM10) above a certain amount need to
obtain permits to operate consistent with the require-
ments of Title V of the federal Clean Air Act as amended
in 1990. This policy req uires operators of units requiring
Title V permits to pay a penalty if they fail to pay for
their permit within a certain number of days after it is
issued.
Copyright © 2013 SciRes. JEP
California’s Agriculture-Related Local Air Pollution Policy
26
These eight policies were chosen because they were
similar in theme across the different counties in the dif-
ferent air districts but they either vary in whether they
were implemented at all, or differ in the date of imple-
mentation. For example, the prohibition on fugitive dust
applies in Amador and Imperial Counties but not in El
Dorado and Monterey Counties. Of Amador and Imperial
Counties, the dates of implementation of the prohibition
policy differ. In Amador County the policy did not take
effect until the year 2000, while the policy was imple-
mented in Imperial County prio r to 1994 [12].
The similarity of theme in the different policies chosen
and the difference in the details of each of the policy add
to the quality of th e analysis. Since the policies are simi-
lar in theme but are different in details, comparisons can
be made and the effect of each policy can be examined.
For example, once controls are taken into account, dif-
ferences between air quality in Amador County and El
Dorado County can be said to be attributable to the pro-
hibition on fugitive dust which is effective in Amador
County but not in El Dorado County. Likewise, the dif-
ferences in air quality in Amador County and Imperial
County can be attributed to the differences in the date of
implementation of the prohibition on fugitive dust.
3. Data Description
My work in [7] uses annual county-level data from 1980-
2000.
The policy variables used in [7] are constructed from
the California Air Resources Board’s online database of
state and county laws and regulations concerning air
quality in the different air districts [12]. For each of the
eight policies chosen, dummy variables for whether or
not the policy is in place for each county for each year
since 1980 to 2000 were constructed.
To measure air quality, [7] focuses on two agricu lture-
related air pollutants: CO and nitrogen dioxide (NO2).
For each pollutant, data on the number of days per year
exceeding the state standards as compiled by the Califor-
nia Air Resources Board are used. In particular, for CO,
the number of days exceeding the state’s 1-hour standard
for CO of 20 parts per million (ppm) and the number of
days exceeding the state’s 8-hour standard for CO of 9.0
ppm are used. For NO2, the number of days exceeding
state’s 1-hour stand ard for NO2 of 0.18 ppm is used.
The socio-economic data used in [7] are obtained from
the US Bureau of Health Professions’ Area Resource File.
Socio-economic data used in this paper include popula-
tion, per capita income and the percentage of county area
occupied by farms.
4. Econometric Analysis
In order to identify the effects of the chosen air quality
policies on air q uality, [7] estimates multivariable regr es-
sions that exploit the natural variation in policy among
the different air districts in California.
It is possible that the correlation between the regula-
tions and air quality reflect some omitted characteristics
such as socio-economic status that are correlated with
both regulations and air quality. To address the possibil-
ity of omitted variab les b ias, in [7 ] I u se a method similar
to that used by [9]: I include a rich set of covariates and
employ county fixed effects to capture any unobserved
characteristics of counties that are constant over time.
The control variables used are year, population, popula-
tion density, per capita income, and acres of farmland.
The Hausman test was used to determine whether con-
trolling for fixed effects was more appropriate than con-
trolling for rando m effects.
The natural variation of policy among air districts
mitigates the potential endogeneity of regulation, since
two neighboring counties that may share similar charac-
teristics and that may have similar levels of pollution
prior to the implementation of a particular policy, all else
equal, may still belong to different air districts.
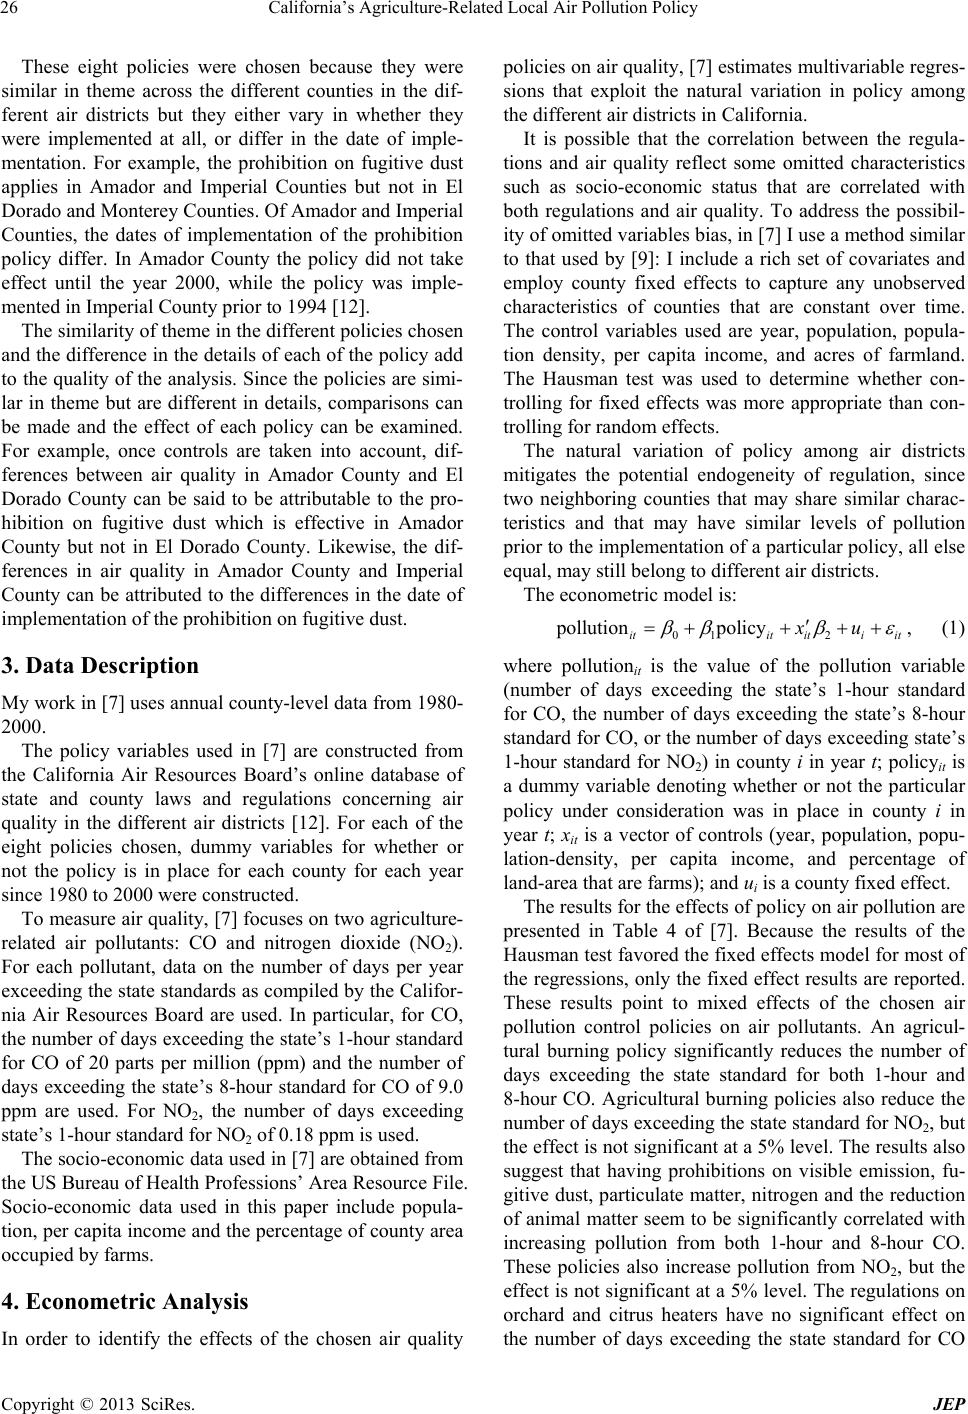
The econometric model is:
01 2
pollution policy
itititi it
xu

, (1)
where pollutionit is the value of the pollution variable
(number of days exceeding the state’s 1-hour standard
for CO, the number of days exceeding the state’s 8-hour
standard for CO, or the number of days exceeding state’s
1-hour standard for NO2) in county i in year t; policyit is
a dummy variable denoting whether or not the particular
policy under consideration was in place in county i in
year t; xit is a vector of controls (year, population, popu-
lation-density, per capita income, and percentage of
land-area that are farms); and ui is a county fixed effect.
The results for the effects of policy on air pollution are
presented in Table 4 of [7]. Because the results of the
Hausman test favored the fixed effects model for most of
the regressions, only the fixed effect results are reported.
These results point to mixed effects of the chosen air
pollution control policies on air pollutants. An agricul-
tural burning policy significantly reduces the number of
days exceeding the state standard for both 1-hour and
8-hour CO. Agricultural burning policies also reduce the
number of days exceeding the state standard for NO2, but
the effect is not significant at a 5% level. The results also
suggest that having prohibitions on visible emission, fu-
gitive dust, particulate matter, nitrogen and the reduction
of animal matter seem to be significantly correlated with
increasing pollution from both 1-hour and 8-hour CO.
These policies also increase pollution from NO2, but the
effect is not significant at a 5% level. The regulations on
orchard and citrus heaters have no significant effect on
the number of days exceeding the state standard for CO
Copyright © 2013 SciRes. JEP
California’s Agriculture-Related Local Air Pollution Policy
Copyright © 2013 SciRes. JEP
27
or NO2. A penalty fee has a significant negative effect on
the number of days exceeding the state standard for both
1-hour and 8-hour CO, but no significant effect on the
number of days exceeding the state standard for NO2.
None of the p olicies examined had a significant effect on
the number of days exceeding the state standard for NO2.
5. Conclusions
This paper reviews my previous work in [7], in which I
examine whether existing air pollution control policies,
particularly those targeted at agriculture, have succeeded
in improving air quality, as measured by the number of
exceedances of the CO and NO2 standards. Results from
the multivariable regressions point to mixed effects of air
pollution control policies on air quality, as measured by
the number of exceedances of the CO and NO2 standards.
Agricultural burning policies and penalty fees reduce the
pollution from CO. Other policies such as the prohibition
on visible emission, fugitive dust, particulate matter, ni-
trogen and the reduction of animal matter are correlated
with higher levels of CO. Regulations on orchard and
citrus heaters have no significan t effect on the number of
exceedances of the CO and NO2 standards.
The regulations that were most effective in improving
air quality were the regulations on agricultural burning
and the penalty fees for noncompliance with the stan-
dards.
These results provide insight into the appropriate de-
sign of policy to mitigate air p ollutio n problems and their
associated adverse health effects.
6. Acknowledgements
Kanittha Tambunlertchai provided excellent research
assistance. I thank Gary Chamberlain and John Karlik for
discussions. I received financial support from the Gian-
nini Foundation for Agricultural Economics, an EPA
Science to Achieve Results graduate fellowship, a Na-
tional Science Foundation graduate research fellowship,
and a Repsol YPF—Harvard Kennedy School Pre-Doc-
toral Fellowship in energy policy. I am a member of the
Giannini Foundation for Agricultural Economics. All
errors are my own.
REFERENCES
[1] M. Z. Jacobson, “Atmospheric Pollution,” Cambridge
University Press, Cambridge, 2002.
[2] J. V. Hall, A. M. Winer, M. T. Kleinman, F. W. Lurmann,
V. Brajer and S. D. Colome, “Valuing the Health Benefits
of Clean Air,” Science, Vol. 255, No. 5046, 1992, pp.
812-817. doi:10.1126/science.1536006
[3] C.-Y. C. Lin, D. J. Jacob and A. M. Fiore, “Trends in
Exceedances of the Ozone Air Quality Standard in the
Continental United States, 1980-1998,” Atmospheric En-
vironment, Vol. 35, No. 19, 2001, pp. 3217-3228.
doi:10.1016/S1352-2310(01)00152-2
[4] California Air Resources Board (ARB), “Top 4 Summary:
Top 4 Measurements and Days above the Standard,” 2006.
http://www.arb.ca.gov/adam/cgi-bin/db2www/adamtop4b
.d2w/start
[5] Canadian Environmental Protection Agency (EPA), “En-
vironment Canada,” 2004.
http://www.ec.gc.ca/environment_e.html
[6] A. M. Winer, D. M. Olszyk and R. E. Howitt, “Air Qual-
ity Impacts on California Agriculture, 1990-2010,” In:
Agriculture in California: On the Brink of a New Millen-
nium, 1990-2010, University of California Agricultural
Issues Center, Davis, 1990, pp. 89-112.
[7] C.-Y. C. Lin, “An Assessment of the Effectiveness of
California’s Local Air Pollution Controls on Agricultural
Sources,” In: M. Khallaf, Ed., The Impact of Air Pollution
on Health, Economy, Environment and Agricultural
Sources, InTech—Open Access Publisher, Manhattan,
2011.
[8] K. Chay and M. Greenstone, “Air Quality, Infant Mortal-
ity, and the Clean Air Act of 1970,” NBER Working Pa-
per Series, Working Paper No. 10053, Massachusetts In-
stitute of Technology, Cambridge, 2003.
[9] J. Currie and M. Neidell, “Air Pollution and Infant Health:
What Can We Learn from California’s Recent Experi-
ence?” Quarterly Journal of Economics, Vol. 120, No. 3,
2005, pp. 1003-1030. doi:10.1093/qje/120.3.1003
[10] California Air Resources Board (ARB), “Organizations in
the California Air Resources Board,” 2004.
http://www.arb.ca.gov/html/org/org.htm
[11] U.S. Environment al Prot ect io n Agency (EPA), “The Pl ain
English Guide to the Clean Air Act,” 2004.
http://www.epa.gov/oar/oaqps/peg_caa/pegcaain.html
[12] California Air Resources Board (ARB), “Laws and Regu-
lations Database,” 2004.
http://www.arb.ca.gov/html/lawsregs.htm