Paper Menu >>
Journal Menu >>
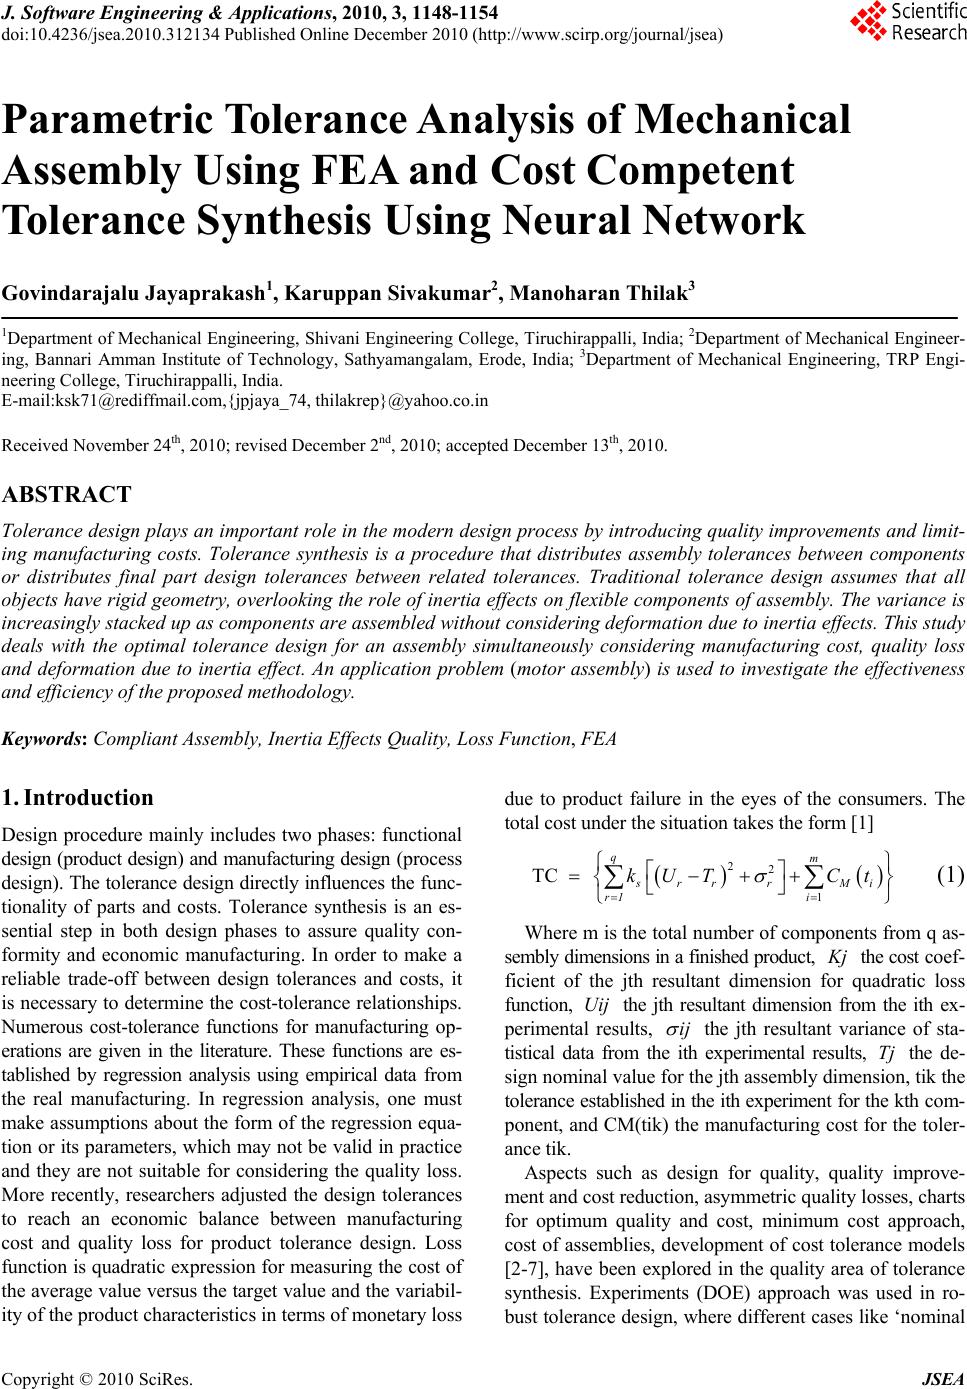 J. Software Engineering & Applications, 2010, 3, 1148-1154 doi:10.4236/jsea.2010.312134 Published Online December 2010 (http://www.scirp.org/journal/jsea) Copyright © 2010 SciRes. JSEA Parametric Tolerance Analysis of Mechanical Assembly Using FEA and Cost Competent Tolerance Synthesis Using Neural Network Govindarajalu Jayaprakash1, Karuppan Sivakumar2, Manoharan Thilak3 1Department of Mechanical Engineering, Shivani Engineering College, Tiruchirappalli, India; 2Department of Mechanical Engineer- ing, Bannari Amman Institute of Technology, Sathyamangalam, Erode, India; 3Department of Mechanical Engineering, TRP Engi- neering College, Tiruchirappalli, India. E-mail:ksk71@rediffmail.com,{jpjaya_74, thilakrep}@yahoo.co.in Received November 24th, 2010; revised December 2nd, 2010; accepted December 13th, 2010. ABSTRACT Tolerance design plays an important role in the modern design process by introducing quality improvements and limit- ing manufacturing costs. Tolerance synthesis is a procedure that distributes assembly tolerances between components or distributes final part design tolerances between related tolerances. Traditional tolerance design assumes that all objects have rigid geometry, overlooking the role of inertia effects on flexible components of assembly. The variance is increasingly stacked up as components are assembled without considering deformation due to inertia effects. This study deals with the optimal tolerance design for an assembly simultaneously considering manufacturing cost, quality loss and deformation due to inertia effect. An application problem (motor assembly) is used to investigate the effectiveness and efficiency of the proposed methodology. Keywords: Compliant Assembly, Inertia Effects Quality, Loss Function, FEA 1. Introduction Design procedure mainly includes two phases: functional design (product design) and manufacturing design (process design). The tolerance design directly influences the func- tionality of parts and costs. Tolerance synthesis is an es- sential step in both design phases to assure quality con- formity and economic manufacturing. In order to make a reliable trade-off between design tolerances and costs, it is necessary to determine the cost-tolerance relationships. Numerous cost-tolerance functions for manufacturing op- erations are given in the literature. These functions are es- tablished by regression analysis using empirical data from the real manufacturing. In regression analysis, one must make assumptions about the form of the regression equa- tion or its parameters, which may not be valid in practice and they are not suitable for considering the quality loss. More recently, researchers adjusted the design tolerances to reach an economic balance between manufacturing cost and quality loss for product tolerance design. Loss function is quadratic expression for measuring the cost of the average value versus the target value and the variabil- ity of the product characteristics in terms of monetary loss due to product failure in the eyes of the consumers. The total cost under the situation takes the form [1] 22 1 TC qm srr rMi r1 i kUT Ct (1) Where m is the total number of components from q as- sembly dimensions in a finished product, K j the cost coef- ficient of the jth resultant dimension for quadratic loss function, Uij the jth resultant dimension from the ith ex- perimental results, ij the jth resultant variance of sta- tistical data from the ith experimental results, Tj the de- sign nominal value for the jth assembly dimension, tik the tolerance established in the ith experiment for the kth com- ponent, and CM(tik) the manufacturing cost for the toler- ance tik. Aspects such as design for quality, quality improve- ment and cost reduction, asymmetric quality losses, charts for optimum quality and cost, minimum cost approach, cost of assemblies, development of cost tolerance models [2-7], have been explored in the quality area of tolerance synthesis. Experiments (DOE) approach was used in ro- bust tolerance design, where different cases like ‘nominal 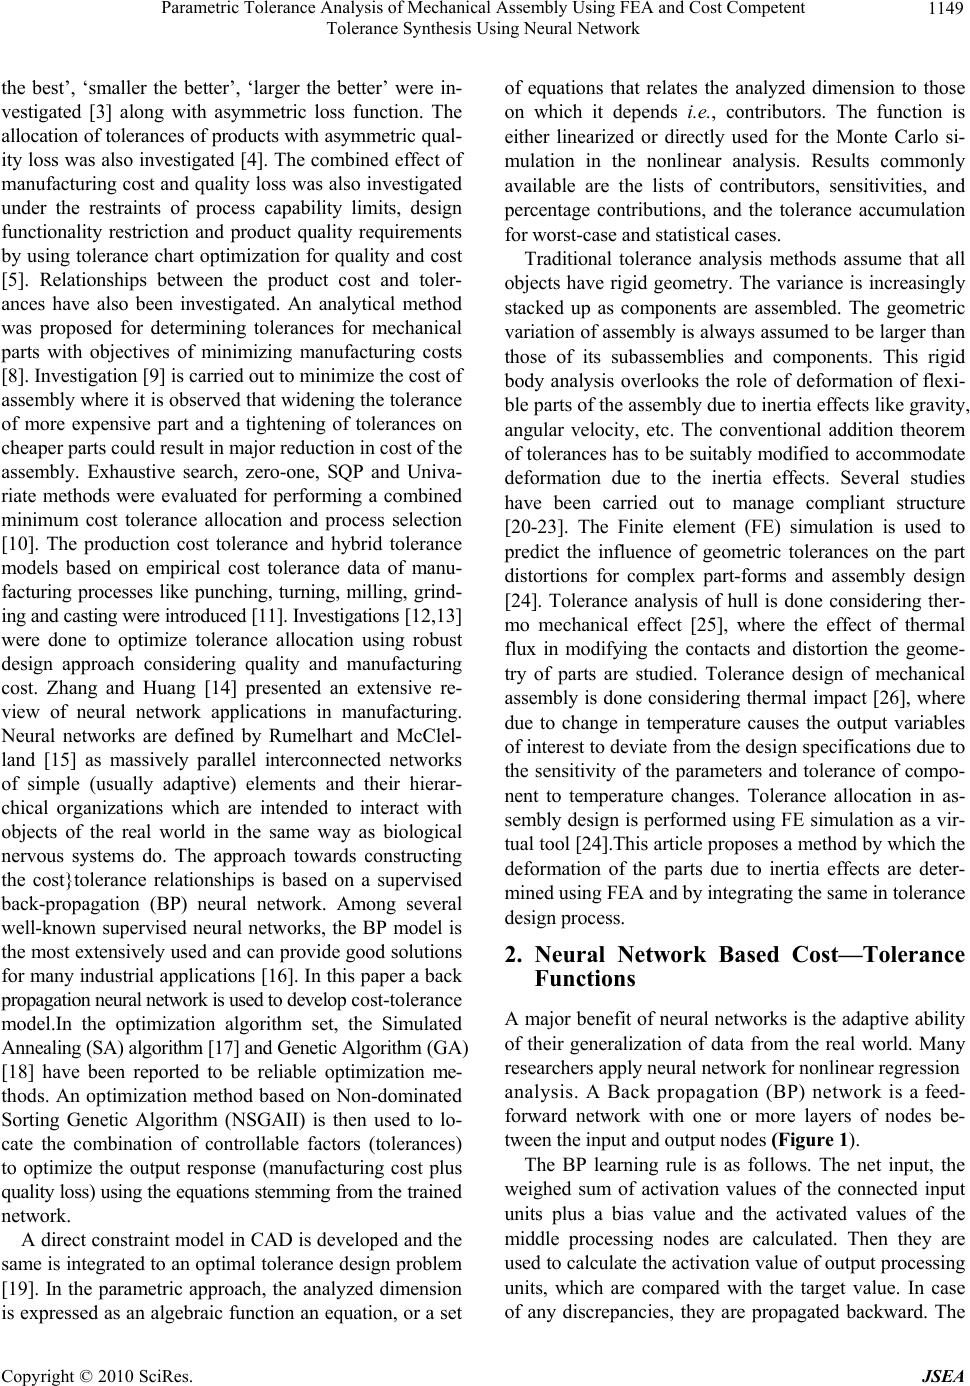 Parametric Tolerance Analysis of Mechanical Assembly Using FEA and Cost Competent Tolerance Synthesis Using Neural Network Copyright © 2010 SciRes. JSEA 1149 the best’, ‘smaller the better’, ‘larger the better’ were in- vestigated [3] along with asymmetric loss function. The allocation of tolerances of products with asymmetric qual- ity loss was also investigated [4]. The combined effect of manufacturing cost and quality loss was also investigated under the restraints of process capability limits, design functionality restriction and product quality requirements by using tolerance chart optimization for quality and cost [5]. Relationships between the product cost and toler- ances have also been investigated. An analytical method was proposed for determining tolerances for mechanical parts with objectives of minimizing manufacturing costs [8]. Investigation [9] is carried out to minimize the cost of assembly where it is observed that widening the tolerance of more expensive part and a tightening of tolerances on cheaper parts could result in major reduction in cost of the assembly. Exhaustive search, zero-one, SQP and Univa- riate methods were evaluated for performing a combined minimum cost tolerance allocation and process selection [10]. The production cost tolerance and hybrid tolerance models based on empirical cost tolerance data of manu- facturing processes like punching, turning, milling, grind- ing and casting were introduced [11]. Investigations [12,13] were done to optimize tolerance allocation using robust design approach considering quality and manufacturing cost. Zhang and Huang [14] presented an extensive re- view of neural network applications in manufacturing. Neural networks are defined by Rumelhart and McClel- land [15] as massively parallel interconnected networks of simple (usually adaptive) elements and their hierar- chical organizations which are intended to interact with objects of the real world in the same way as biological nervous systems do. The approach towards constructing the cost}tolerance relationships is based on a supervised back-propagation (BP) neural network. Among several well-known supervised neural networks, the BP model is the most extensively used and can provide good solutions for many industrial applications [16]. In this paper a back propagation neural network is used to develop cost-tolerance model.In the optimization algorithm set, the Simulated Annealing (SA) algorithm [17] and Genetic Algorithm (GA) [18] have been reported to be reliable optimization me- thods. An optimization method based on Non-dominated Sorting Genetic Algorithm (NSGAII) is then used to lo- cate the combination of controllable factors (tolerances) to optimize the output response (manufacturing cost plus quality loss) using the equations stemming from the trained network. A direct constraint model in CAD is developed and the same is integrated to an optimal tolerance design problem [19]. In the parametric approach, the analyzed dimension is expressed as an algebraic function an equation, or a set of equations that relates the analyzed dimension to those on which it depends i.e., contributors. The function is either linearized or directly used for the Monte Carlo si- mulation in the nonlinear analysis. Results commonly available are the lists of contributors, sensitivities, and percentage contributions, and the tolerance accumulation for worst-case and statistical cases. Traditional tolerance analysis methods assume that all objects have rigid geometry. The variance is increasingly stacked up as components are assembled. The geometric variation of assembly is always assumed to be larger than those of its subassemblies and components. This rigid body analysis overlooks the role of deformation of flexi- ble parts of the assembly due to inertia effects like gravity, angular velocity, etc. The conventional addition theorem of tolerances has to be suitably modified to accommodate deformation due to the inertia effects. Several studies have been carried out to manage compliant structure [20-23]. The Finite element (FE) simulation is used to predict the influence of geometric tolerances on the part distortions for complex part-forms and assembly design [24]. Tolerance analysis of hull is done considering ther- mo mechanical effect [25], where the effect of thermal flux in modifying the contacts and distortion the geome- try of parts are studied. Tolerance design of mechanical assembly is done considering thermal impact [26], where due to change in temperature causes the output variables of interest to deviate from the design specifications due to the sensitivity of the parameters and tolerance of compo- nent to temperature changes. Tolerance allocation in as- sembly design is performed using FE simulation as a vir- tual tool [24].This article proposes a method by which the deformation of the parts due to inertia effects are deter- mined using FEA and by integrating the same in tolerance design process. 2. Neural Network Based Cost—Tolerance Functions A major benefit of neural networks is the adaptive ability of their generalization of data from the real world. Many researchers apply neural network for nonlinear regression analysis. A Back propagation (BP) network is a feed- forward network with one or more layers of nodes be- tween the input and output nodes (Figure 1). The BP learning rule is as follows. The net input, the weighed sum of activation values of the connected input units plus a bias value and the activated values of the middle processing nodes are calculated. Then they are used to calculate the activation value of output processing units, which are compared with the target value. In case of any discrepancies, they are propagated backward. The 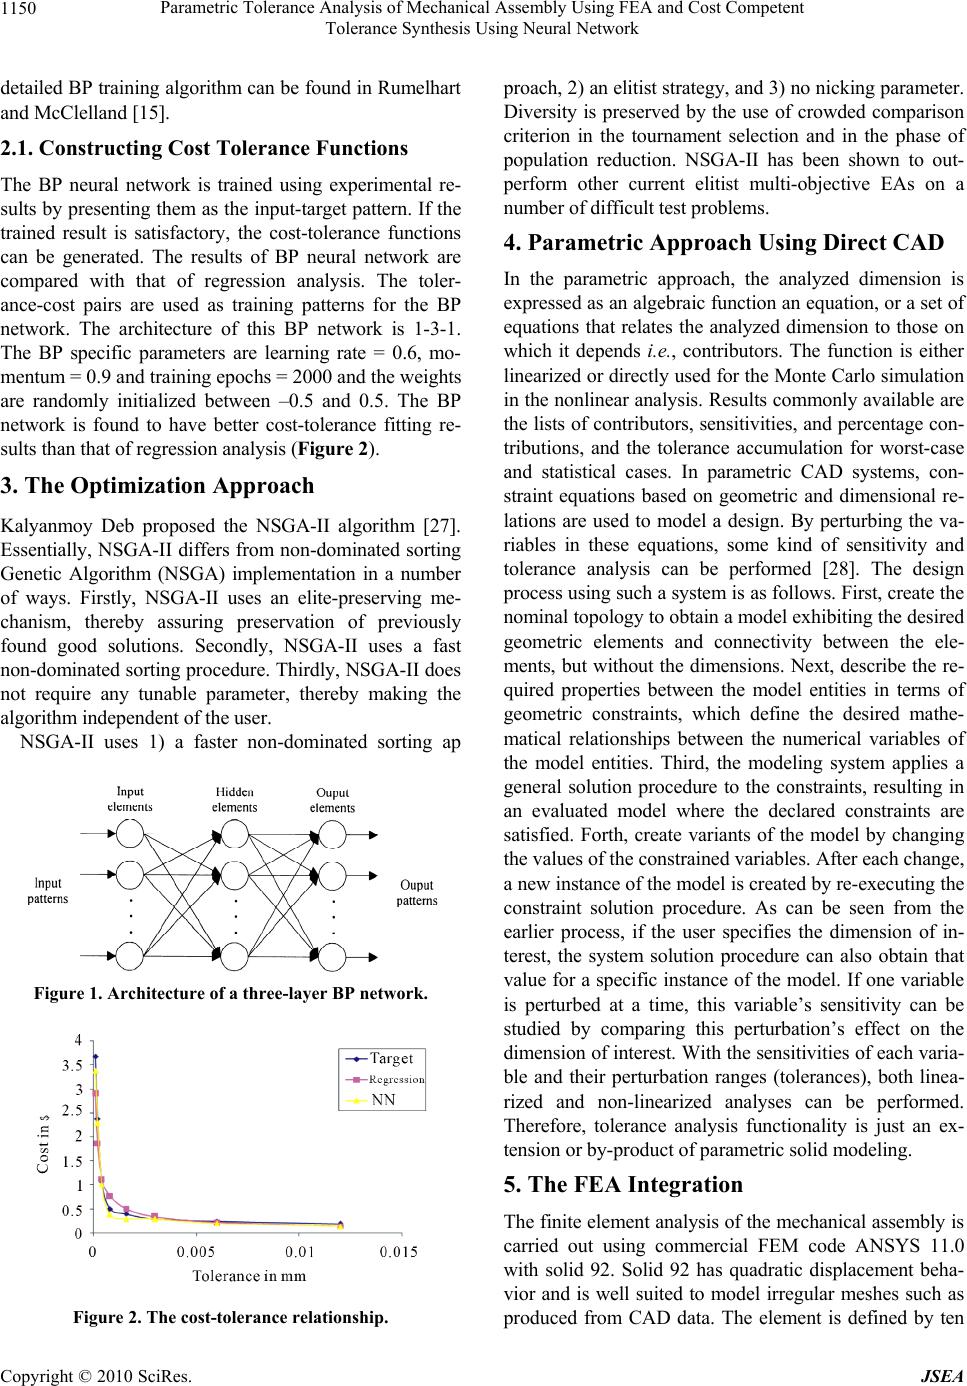 Parametric Tolerance Analysis of Mechanical Assembly Using FEA and Cost Competent Tolerance Synthesis Using Neural Network Copyright © 2010 SciRes. JSEA 1150 detailed BP training algorithm can be found in Rumelhart and McClelland [15]. 2.1. Constructing Cost Tolerance Functions The BP neural network is trained using experimental re- sults by presenting them as the input-target pattern. If the trained result is satisfactory, the cost-tolerance functions can be generated. The results of BP neural network are compared with that of regression analysis. The toler- ance-cost pairs are used as training patterns for the BP network. The architecture of this BP network is 1-3-1. The BP specific parameters are learning rate = 0.6, mo- mentum = 0.9 and training epochs = 2000 and the weights are randomly initialized between –0.5 and 0.5. The BP network is found to have better cost-tolerance fitting re- sults than that of regression analysis (Figure 2). 3. The Optimization Approach Kalyanmoy Deb proposed the NSGA-II algorithm [27]. Essentially, NSGA-II differs from non-dominated sorting Genetic Algorithm (NSGA) implementation in a number of ways. Firstly, NSGA-II uses an elite-preserving me- chanism, thereby assuring preservation of previously found good solutions. Secondly, NSGA-II uses a fast non-dominated sorting procedure. Thirdly, NSGA-II does not require any tunable parameter, thereby making the algorithm independent of the user. NSGA-II uses 1) a faster non-dominated sorting ap Figure 1. Architecture of a three-layer BP network. Figure 2. The cost-tolerance relationship. proach, 2) an elitist strategy, and 3) no nicking parameter. Diversity is preserved by the use of crowded comparison criterion in the tournament selection and in the phase of population reduction. NSGA-II has been shown to out- perform other current elitist multi-objective EAs on a number of difficult test problems. 4. Parametric Approach Using Direct CAD In the parametric approach, the analyzed dimension is expressed as an algebraic function an equation, or a set of equations that relates the analyzed dimension to those on which it depends i.e., contributors. The function is either linearized or directly used for the Monte Carlo simulation in the nonlinear analysis. Results commonly available are the lists of contributors, sensitivities, and percentage con- tributions, and the tolerance accumulation for worst-case and statistical cases. In parametric CAD systems, con- straint equations based on geometric and dimensional re- lations are used to model a design. By perturbing the va- riables in these equations, some kind of sensitivity and tolerance analysis can be performed [28]. The design process using such a system is as follows. First, create the nominal topology to obtain a model exhibiting the desired geometric elements and connectivity between the ele- ments, but without the dimensions. Next, describe the re- quired properties between the model entities in terms of geometric constraints, which define the desired mathe- matical relationships between the numerical variables of the model entities. Third, the modeling system applies a general solution procedure to the constraints, resulting in an evaluated model where the declared constraints are satisfied. Forth, create variants of the model by changing the values of the constrained variables. After each change, a new instance of the model is created by re-executing the constraint solution procedure. As can be seen from the earlier process, if the user specifies the dimension of in- terest, the system solution procedure can also obtain that value for a specific instance of the model. If one variable is perturbed at a time, this variable’s sensitivity can be studied by comparing this perturbation’s effect on the dimension of interest. With the sensitivities of each varia- ble and their perturbation ranges (tolerances), both linea- rized and non-linearized analyses can be performed. Therefore, tolerance analysis functionality is just an ex- tension or by-product of parametric solid modeling. 5. The FEA Integration The finite element analysis of the mechanical assembly is carried out using commercial FEM code ANSYS 11.0 with solid 92. Solid 92 has quadratic displacement beha- vior and is well suited to model irregular meshes such as produced from CAD data. The element is defined by ten 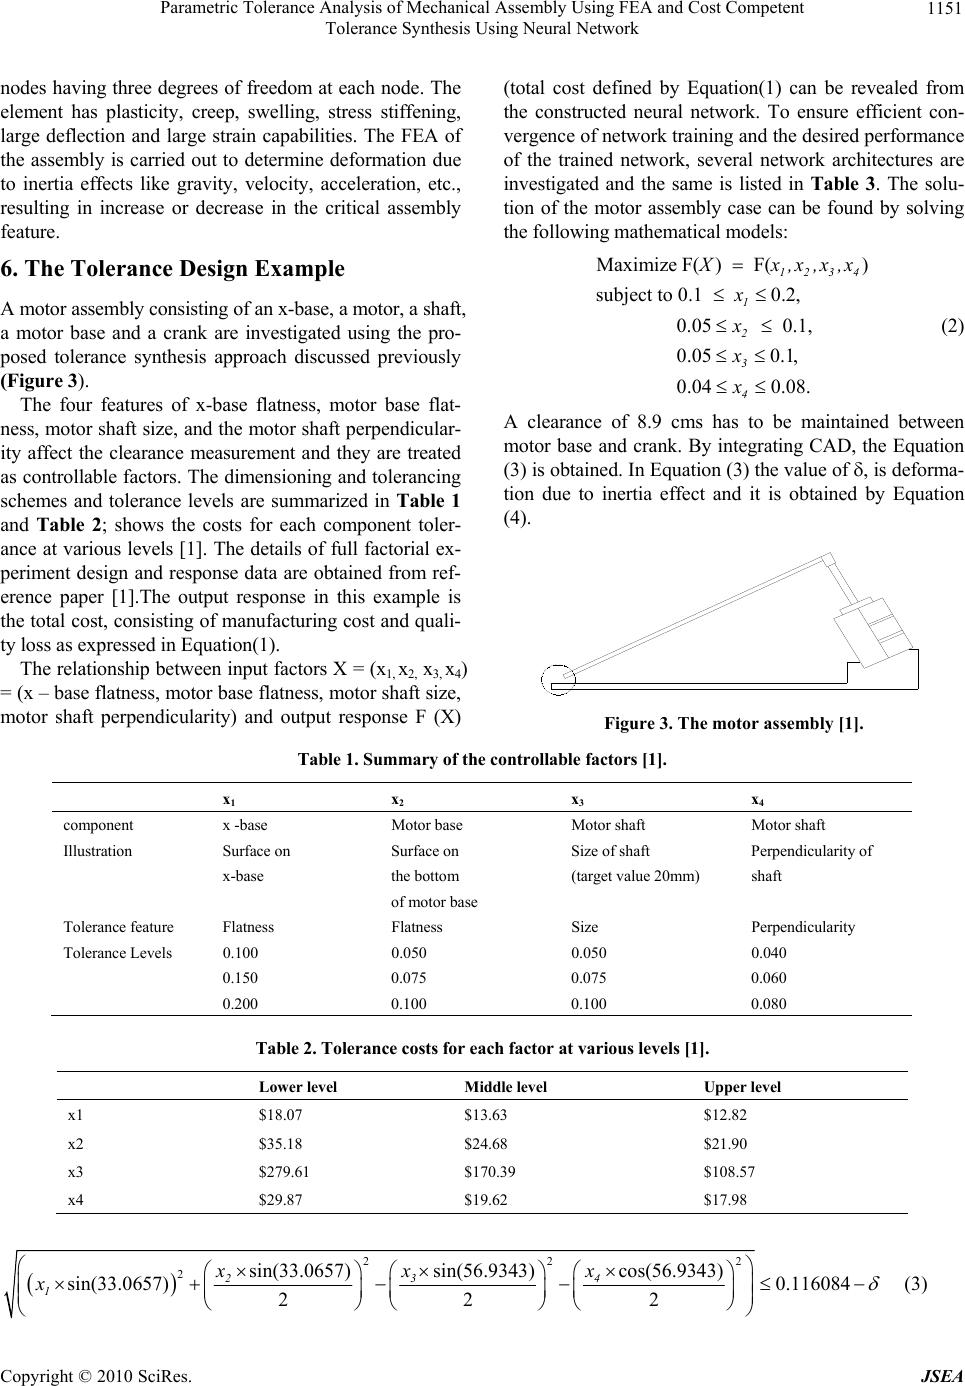 Parametric Tolerance Analysis of Mechanical Assembly Using FEA and Cost Competent Tolerance Synthesis Using Neural Network Copyright © 2010 SciRes. JSEA 1151 nodes having three degrees of freedom at each node. The element has plasticity, creep, swelling, stress stiffening, large deflection and large strain capabilities. The FEA of the assembly is carried out to determine deformation due to inertia effects like gravity, velocity, acceleration, etc., resulting in increase or decrease in the critical assembly feature. 6. The Tolerance Design Example A motor assembly consisting of an x-base, a motor, a shaft, a motor base and a crank are investigated using the pro- posed tolerance synthesis approach discussed previously (Figure 3). The four features of x-base flatness, motor base flat- ness, motor shaft size, and the motor shaft perpendicular- ity affect the clearance measurement and they are treated as controllable factors. The dimensioning and tolerancing schemes and tolerance levels are summarized in Table 1 and Table 2; shows the costs for each component toler- ance at various levels [1]. The details of full factorial ex- periment design and response data are obtained from ref- erence paper [1].The output response in this example is the total cost, consisting of manufacturing cost and quali- ty loss as expressed in Equation(1). The relationship between input factors X = (x1, x2, x3, x4) = (x – base flatness, motor base flatness, motor shaft size, motor shaft perpendicularity) and output response F (X) (total cost defined by Equation(1) can be revealed from the constructed neural network. To ensure efficient con- vergence of network training and the desired performance of the trained network, several network architectures are investigated and the same is listed in Table 3. The solu- tion of the motor assembly case can be found by solving the following mathematical models: Maximize F() F() subject to 0.1 0.2, 0.05 0.1, 0.050.1, 0.040.08. 1234 1 2 3 4 X x,x,x,x x x x x (2) A clearance of 8.9 cms has to be maintained between motor base and crank. By integrating CAD, the Equation (3) is obtained. In Equation (3) the value of , is deforma- tion due to inertia effect and it is obtained by Equation (4). Figure 3. The motor assembly [1]. Table 1. Summary of the contr o llab le factors [1]. x1 x2 x3 x4 component x -base Motor base Motor shaft Motor shaft Illustration Surface on Surface on Size of shaft Perpendicularity of x-base the bottom (target value 20mm) shaft of motor base Tolerance feature Flatness Flatness Size Perpendicularity Tolerance Levels 0.100 0.050 0.050 0.040 0.150 0.075 0.075 0.060 0.200 0.100 0.100 0.080 Table 2. Tolerance costs for each factor at various levels [1]. Lower le ve l Middle l e ve l Upper le ve l x1 $18.07 $13.63 $12.82 x2 $35.18 $24.68 $21.90 x3 $279.61 $170.39 $108.57 x4 $29.87 $19.62 $17.98 22 2 2sin(56.9343) cos(56.9343) sin(33.0657) sin(33.0657) 0.116084 222 34 2 1 xx x x (3) 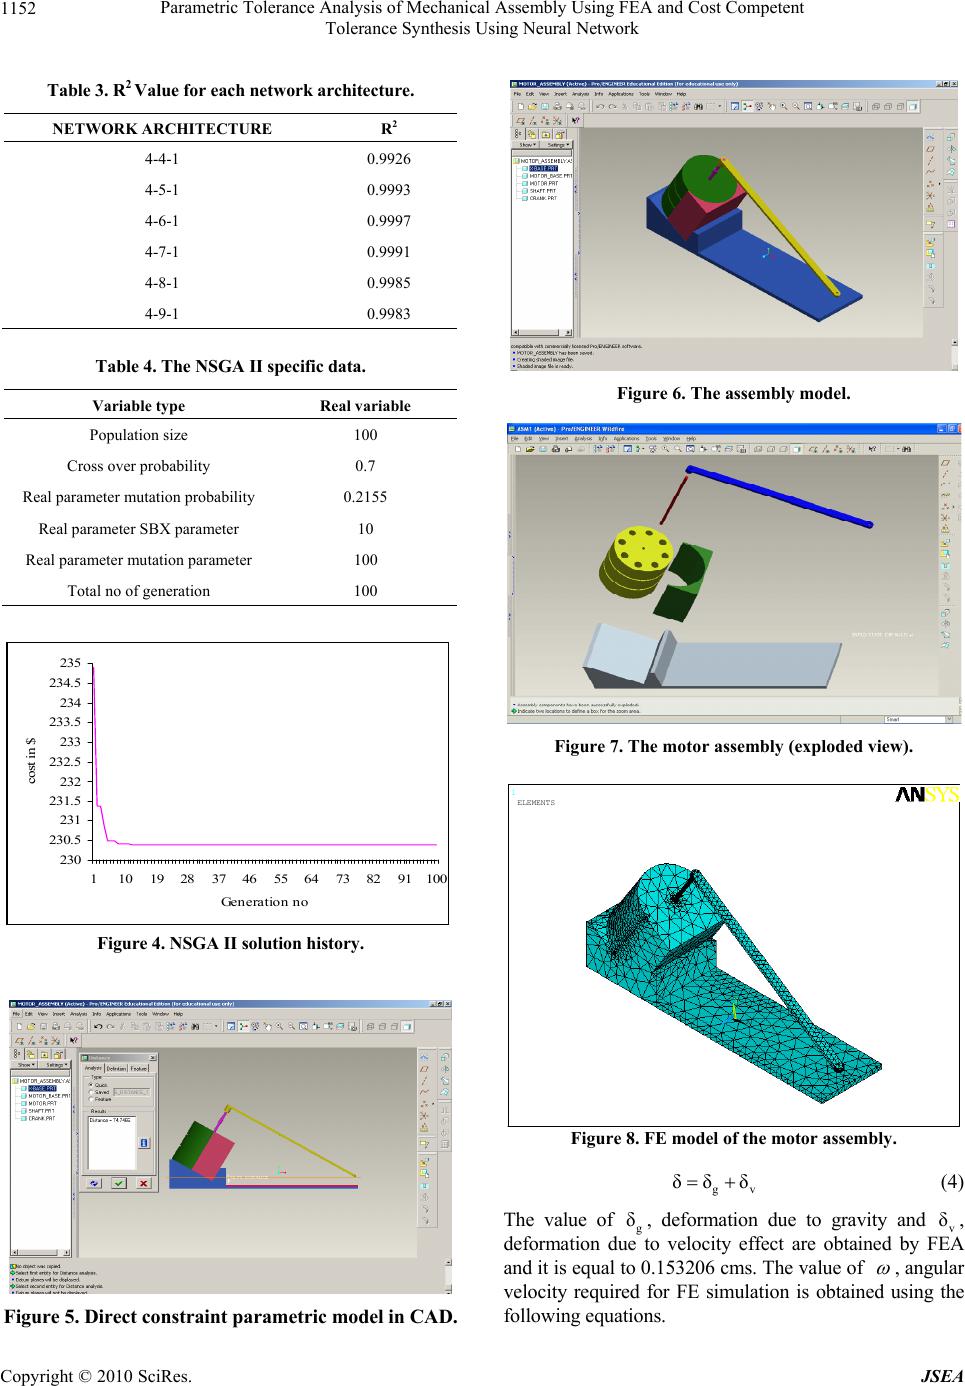 Parametric Tolerance Analysis of Mechanical Assembly Using FEA and Cost Competent Tolerance Synthesis Using Neural Network Copyright © 2010 SciRes. JSEA 1152 Table 3. R2 Value for each network architecture. NETWORK ARCHITECTURE R2 4-4-1 0.9926 4-5-1 0.9993 4-6-1 0.9997 4-7-1 0.9991 4-8-1 0.9985 4-9-1 0.9983 Table 4. The NSGA II specific da ta. Variable type Real variable Population size 100 Cross over probability 0.7 Real parameter mutation probability 0.2155 Real parameter SBX parameter 10 Real parameter mutation parameter 100 Total no of generation 100 230 230.5 231 231.5 232 232.5 233 233.5 234 234.5 235 1 10192837465564738291100 Generation no cost in $ Figure 4. NSGA II solution history. Figure 5. Direct constraint parametric model in CAD. Figure 6. The assembly model. Figure 7. The motor assembly (exploded view). 1 X Y Z ELEMENTS Figure 8. FE model of the motor assembly. gv δδ δ (4) The value of g δ, deformation due to gravity and v δ, deformation due to velocity effect are obtained by FEA and it is equal to 0.153206 cms. The value of , angular velocity required for FE simulation is obtained using the following equations. 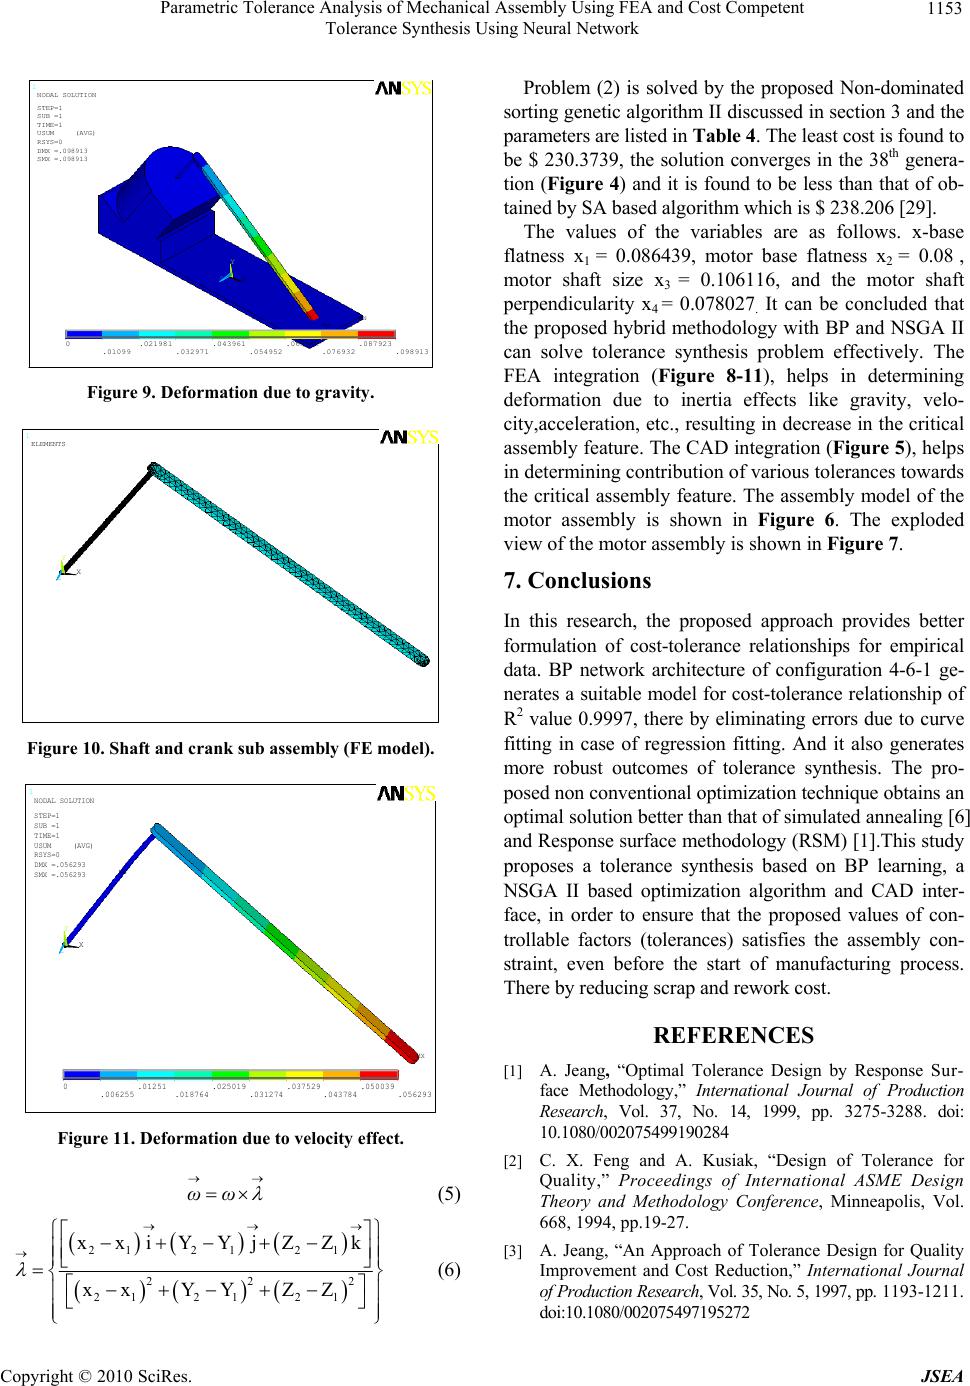 Parametric Tolerance Analysis of Mechanical Assembly Using FEA and Cost Competent Tolerance Synthesis Using Neural Network Copyright © 2010 SciRes. JSEA 1153 1 MN MX X Y Z 0.01099 .021981 .032971.043961 .054952 .065942 .076932.087923 .098913 NODAL SOLUTION STEP=1 SUB =1 TIME=1 USUM (AVG) RSYS=0 DMX =.098913 SMX =.098913 Figure 9. Deformation due to gravity. 1 X Y Z ELEMENTS Figure 10. Shaft and crank sub assembly (F E model). 1 MN MX X Y Z 0.006255.01251 .018764.025019 .031274 .037529.043784.050039 .056293 NODAL SOLUTION STEP=1 SUB =1 TIME=1 USUM (A VG) RSYS=0 DMX =.05629 3 SMX =.05629 3 Figure 11. Deformation due to velocity effect. ωω (5) 21 2121 222 21 2121 xxiYYjZZk xxYY ZZ (6) Problem (2) is solved by the proposed Non-dominated sorting genetic algorithm II discussed in section 3 and the parameters are listed in Table 4. The least cost is found to be $ 230.3739, the solution converges in the 38th genera- tion (Figure 4) and it is found to be less than that of ob- tained by SA based algorithm which is $ 238.206 [29]. The values of the variables are as follows. x-base flatness x1 = 0.086439, motor base flatness x2 = 0.08 , motor shaft size x3 = 0.106116, and the motor shaft perpendicularity x4 = 0.078027. It can be concluded that the proposed hybrid methodology with BP and NSGA II can solve tolerance synthesis problem effectively. The FEA integration (Figure 8-11), helps in determining deformation due to inertia effects like gravity, velo- city,acceleration, etc., resulting in decrease in the critical assembly feature. The CAD integration (Figure 5), helps in determining contribution of various tolerances towards the critical assembly feature. The assembly model of the motor assembly is shown in Figure 6. The exploded view of the motor assembly is shown in Figure 7. 7. Conclusions In this research, the proposed approach provides better formulation of cost-tolerance relationships for empirical data. BP network architecture of configuration 4-6-1 ge- nerates a suitable model for cost-tolerance relationship of R2 value 0.9997, there by eliminating errors due to curve fitting in case of regression fitting. And it also generates more robust outcomes of tolerance synthesis. The pro- posed non conventional optimization technique obtains an optimal solution better than that of simulated annealing [6] and Response surface methodology (RSM) [1].This study proposes a tolerance synthesis based on BP learning, a NSGA II based optimization algorithm and CAD inter- face, in order to ensure that the proposed values of con- trollable factors (tolerances) satisfies the assembly con- straint, even before the start of manufacturing process. There by reducing scrap and rework cost. REFERENCES [1] A. Jeang, “Optimal Tolerance Design by Response Sur- face Methodology,” International Journal of Production Research, Vol. 37, No. 14, 1999, pp. 3275-3288. doi: 10.1080/002075499190284 [2] C. X. Feng and A. Kusiak, “Design of Tolerance for Quality,” Proceedings of International ASME Design Theory and Methodology Conference, Minneapolis, Vol. 668, 1994, pp.19-27. [3] A. Jeang, “An Approach of Tolerance Design for Quality Improvement and Cost Reduction,” International Journal of Production Research, Vol. 35, No. 5, 1997, pp. 1193-1211. doi:10.1080/002075497195272 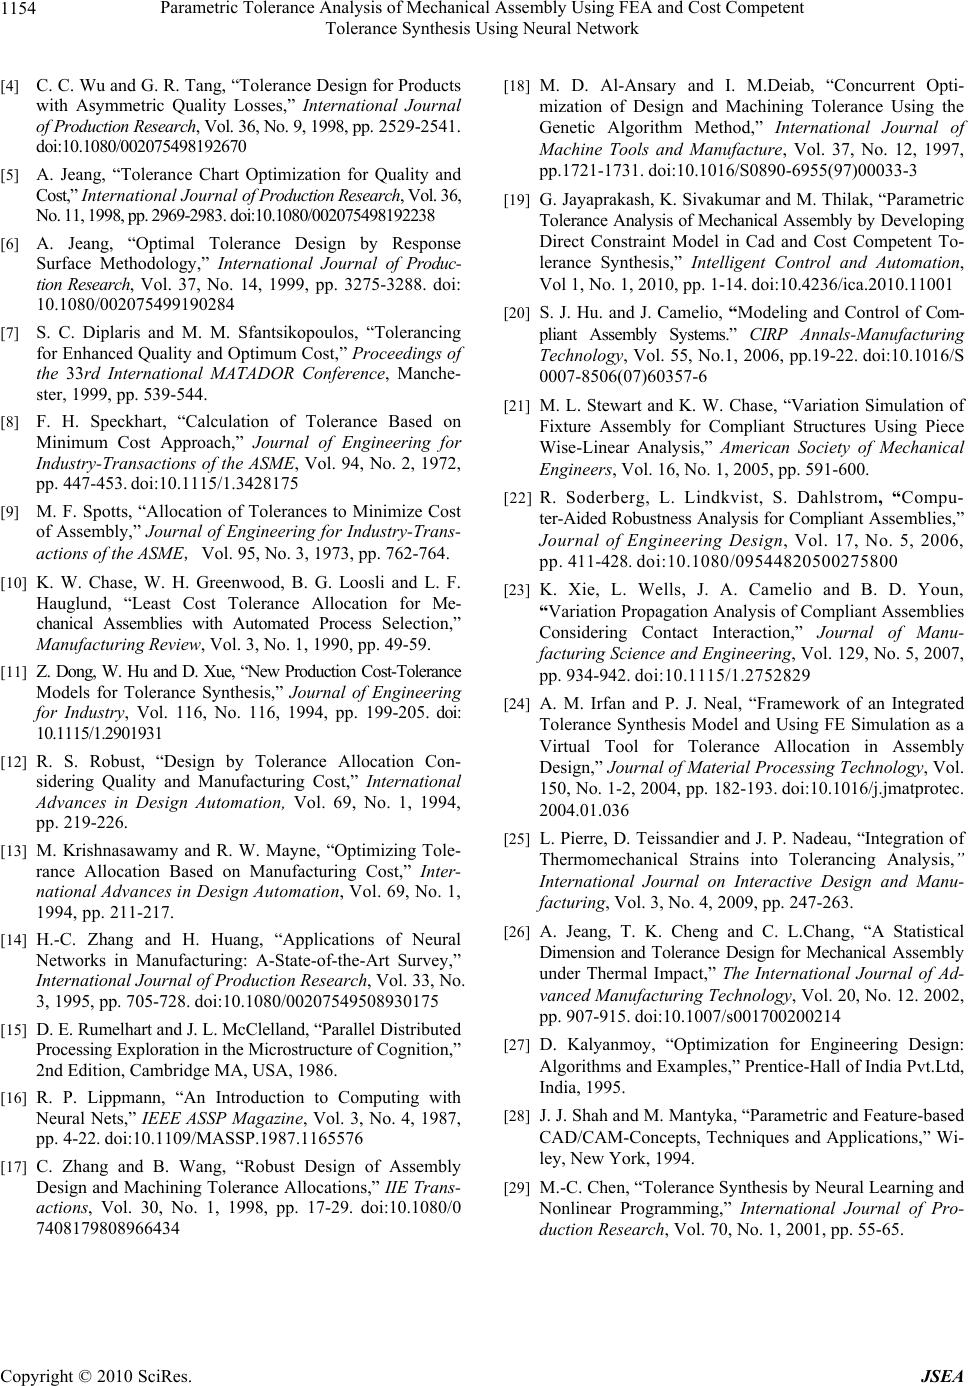 Parametric Tolerance Analysis of Mechanical Assembly Using FEA and Cost Competent Tolerance Synthesis Using Neural Network Copyright © 2010 SciRes. JSEA 1154 [4] C. C. Wu and G. R. Tang, “Tolerance Design for Products with Asymmetric Quality Losses,” International Journal of Production Research, Vol. 36, No. 9, 1998, pp. 2529-2541. doi:10.1080/002075498192670 [5] A. Jeang, “Tolerance Chart Optimization for Quality and Cost,” International Journal of Production Research, Vol. 36, No. 11, 1998, pp. 2969-2983. doi:10.1080/002075498192238 [6] A. Jeang, “Optimal Tolerance Design by Response Surface Methodology,” International Journal of Produc- tion Research, Vol. 37, No. 14, 1999, pp. 3275-3288. doi: 10.1080/002075499190284 [7] S. C. Diplaris and M. M. Sfantsikopoulos, “Tolerancing for Enhanced Quality and Optimum Cost,” Proceedings of the 33rd International MATADOR Conference, Manche- ster, 1999, pp. 539-544. [8] F. H. Speckhart, “Calculation of Tolerance Based on Minimum Cost Approach,” Journal of Engineering for Industry-Transactions of the ASME, Vol. 94, No. 2, 1972, pp. 447-453. doi:10.1115/1.3428175 [9] M. F. Spotts, “Allocation of Tolerances to Minimize Cost of Assembly,” Journal of Engineering for Industry-Trans- actions of the ASME, Vol. 95, No. 3, 1973, pp. 762-764. [10] K. W. Chase, W. H. Greenwood, B. G. Loosli and L. F. Hauglund, “Least Cost Tolerance Allocation for Me- chanical Assemblies with Automated Process Selection,” Manufacturing Review, Vol. 3, No. 1, 1990, pp. 49-59. [11] Z. Dong, W. Hu and D. Xue, “New Production Cost-Tolerance Models for Tolerance Synthesis,” Journal of Engineering for Industry, Vol. 116, No. 116, 1994, pp. 199-205. doi: 10.1115/1.2901931 [12] R. S. Robust, “Design by Tolerance Allocation Con- sidering Quality and Manufacturing Cost,” International Advances in Design Automation, Vol. 69, No. 1, 1994, pp. 219-226. [13] M. Krishnasawamy and R. W. Mayne, “Optimizing Tole- rance Allocation Based on Manufacturing Cost,” Inter- national Advances in Design Automation, Vol. 69, No. 1, 1994, pp. 211-217. [14] H.-C. Zhang and H. Huang, “Applications of Neural Networks in Manufacturing: A-State-of-the-Art Survey,” International Journal of Production Research, Vol. 33, No. 3, 1995, pp. 705-728. doi:10.1080/00207549508930175 [15] D. E. Rumelhart and J. L. McClelland, “Parallel Distributed Processing Exploration in the Microstructure of Cognition,” 2nd Edition, Cambridge MA, USA, 1986. [16] R. P. Lippmann, “An Introduction to Computing with Neural Nets,” IEEE ASSP Magazine, Vol. 3, No. 4, 1987, pp. 4-22. doi:10.1109/MASSP.1987.1165576 [17] C. Zhang and B. Wang, “Robust Design of Assembly Design and Machining Tolerance Allocations,” IIE Trans- actions, Vol. 30, No. 1, 1998, pp. 17-29. doi:10.1080/0 7408179808966434 [18] M. D. Al-Ansary and I. M.Deiab, “Concurrent Opti- mization of Design and Machining Tolerance Using the Genetic Algorithm Method,” International Journal of Machine Tools and Manufacture, Vol. 37, No. 12, 1997, pp.1721-1731. doi:10.1016/S0890-6955(97)00033-3 [19] G. Jayaprakash, K. Sivakumar and M. Thilak, “Parametric Tolerance Analysis of Mechanical Assembly by Developing Direct Constraint Model in Cad and Cost Competent To- lerance Synthesis,” Intelligent Control and Automation, Vol 1, No. 1, 2010, pp. 1-14. doi:10.4236/ica.2010.11001 [20] S. J. Hu. and J. Camelio, “Modeling and Control of Com- pliant Assembly Systems.” CIRP Annals-Manufacturing Technology, Vol. 55, No.1, 2006, pp.19-22. doi:10.1016/S 0007-8506(07)60357-6 [21] M. L. Stewart and K. W. Chase, “Variation Simulation of Fixture Assembly for Compliant Structures Using Piece Wise-Linear Analysis,” American Society of Mechanical Engineers, Vol. 16, No. 1, 2005, pp. 591-600. [22] R. Soderberg, L. Lindkvist, S. Dahlstrom, “Compu- ter-Aided Robustness Analysis for Compliant Assemblies,” Journal of Engineering Design, Vol. 17, No. 5, 2006, pp. 411-428. doi:10.1080/09544820500275800 [23] K. Xie, L. Wells, J. A. Camelio and B. D. Youn, “Variation Propagation Analysis of Compliant Assemblies Considering Contact Interaction,” Journal of Manu- facturing Science and Engineering, Vol. 129, No. 5, 2007, pp. 934-942. doi:10.1115/1.2752829 [24] A. M. Irfan and P. J. Neal, “Framework of an Integrated Tolerance Synthesis Model and Using FE Simulation as a Virtual Tool for Tolerance Allocation in Assembly Design,” Journal of Material Processing Technology, Vol. 150, No. 1-2, 2004, pp. 182-193. doi:10.1016/j.jmatprotec. 2004.01.036 [25] L. Pierre, D. Teissandier and J. P. Nadeau, “Integration of Thermomechanical Strains into Tolerancing Analysis,” International Journal on Interactive Design and Manu- facturing, Vol. 3, No. 4, 2009, pp. 247-263. [26] A. Jeang, T. K. Cheng and C. L.Chang, “A Statistical Dimension and Tolerance Design for Mechanical Assembly under Thermal Impact,” The International Journal of Ad- vanced Manufacturing Technology, Vol. 20, No. 12. 2002, pp. 907-915. doi:10.1007/s001700200214 [27] D. Kalyanmoy, “Optimization for Engineering Design: Algorithms and Examples,” Prentice-Hall of India Pvt.Ltd, India, 1995. [28] J. J. Shah and M. Mantyka, “Parametric and Feature-based CAD/CAM-Concepts, Techniques and Applications,” Wi- ley, New York, 1994. [29] M.-C. Chen, “Tolerance Synthesis by Neural Learning and Nonlinear Programming,” International Journal of Pro- duction Research, Vol. 70, No. 1, 2001, pp. 55-65. |