Paper Menu >>
Journal Menu >>
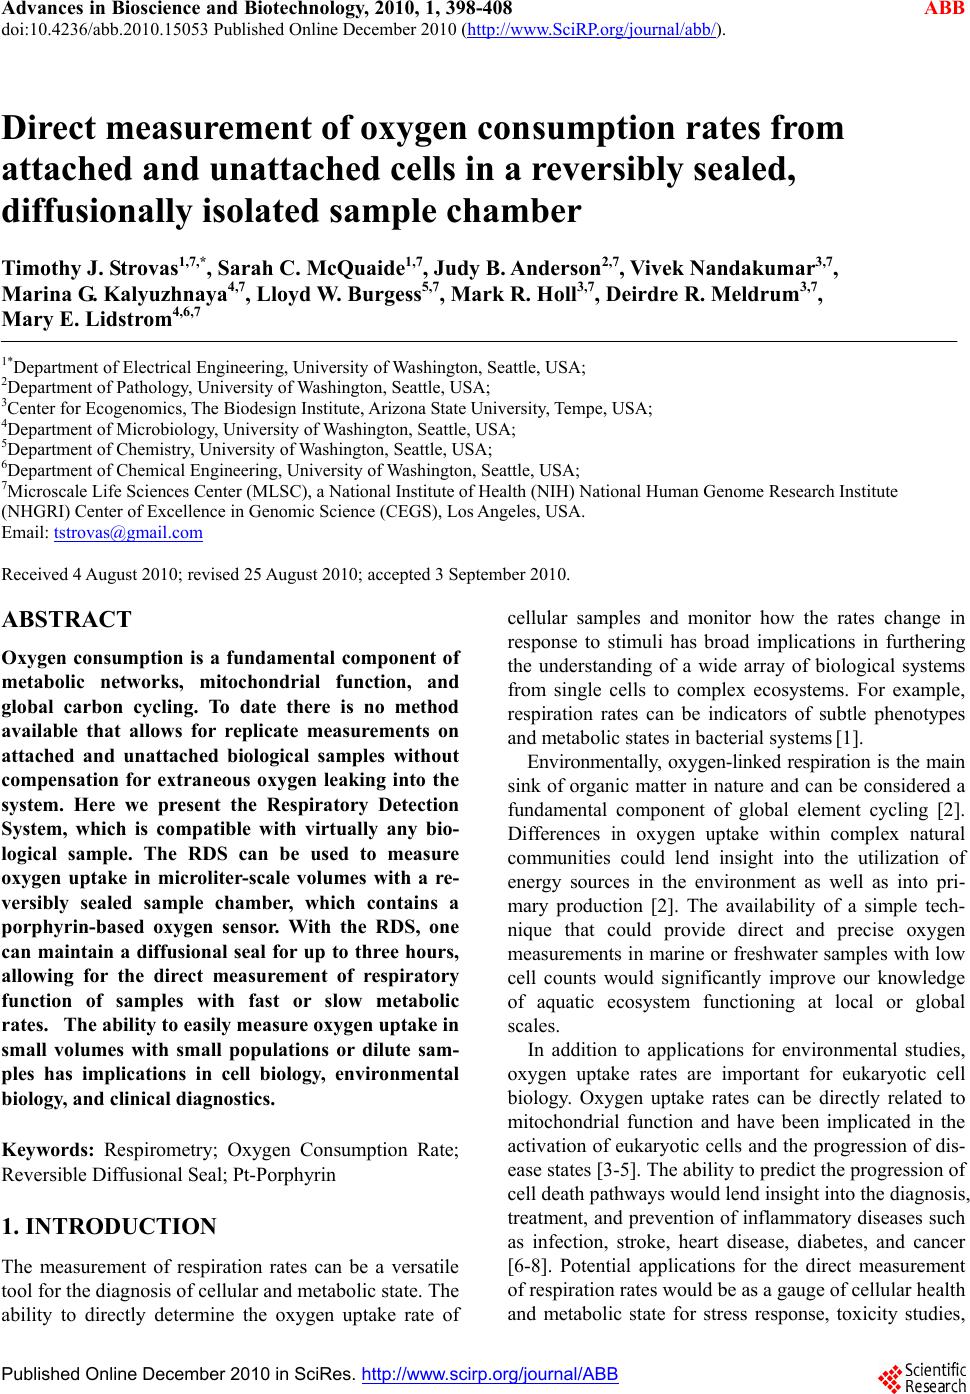 Advances in Bioscience and Biotechnology, 2010, 1, 398-408 ABB doi:10.4236/abb.2010.15053 Published Online December 2010 (http://www.SciRP.org/journal/abb/). Published Online December 2010 in SciRes. http://www.scirp.org/journal/ABB Direct measurement of oxygen consumption rates from attached and unattached cells in a reversibly sealed, diffusionally isolated sample chamber Timothy J. Strovas1,7,*, Sarah C. McQuaide1,7, Judy B. Anderson2,7, V ivek Nandakumar3,7, Marina G. Kalyuzhnaya4,7, Lloyd W. Burgess5,7, Mark R. Holl3,7, Deirdre R. Meldrum3,7, Mary E. Lidstrom4,6,7 1*Department of Electrical Engineering, University of Washington, Seattle, USA; 2Department of Pathology, University of Washington, Seattle, USA; 3Center for Ecogenomics, The Biodesign Institute, Arizona State University, Tempe, USA; 4Department of Microbiology, University of Washington, Seattle, USA; 5Department of Chemistry, University of Washington, Seattle, USA; 6Department of Chemical Engineering, University of Washington, Seattle, USA; 7Microscale Life Sciences Center (MLSC), a National Institute of Health (NIH) National Human Genome Research Institute (NHGRI) Center of Excellence in Genomic Science (CEGS), Los Angeles, USA. Email: tstrovas@gmail.com Received 4 August 2010; revised 25 August 2010; accepted 3 September 2010. ABSTRACT Oxygen consumption is a fundamental component of metabolic networks, mitochondrial function, and global carbon cycling. To date there is no method available that allows for replicate measurements on attached and unattached biological samples without compensation for extraneous oxygen leaking into the system. Here we present the Respiratory Detection System, which is compatible with virtually any bio- logical sample. The RDS can be used to measure oxygen uptake in microliter-scale volumes with a re- versibly sealed sample chamber, which contains a porphyrin-based oxygen sensor. With the RDS, one can maintain a diffusional seal for up to three hours, allowing for the direct measurement of respiratory function of samples with fast or slow metabolic rates. The ability to easily measure oxygen uptake in small volumes with small populations or dilute sam- ples has implications in cell biology, environmental biology, and clinical diagnostics. Keywords: Respirometry; Oxygen Consumption Rate; Reversible Diffusional Seal; Pt-Porphyrin 1. INTRODUCTION The measurement of respiration rates can be a versatile tool for the diagnosis of cellular and metabolic state. The ability to directly determine the oxygen uptake rate of cellular samples and monitor how the rates change in response to stimuli has broad implications in furthering the understanding of a wide array of biological systems from single cells to complex ecosystems. For example, respiration rates can be indicators of subtle phenotypes and metabolic states in bacterial systems [1]. Environmentally, oxygen-linked respiration is the main sink of organic matter in nature and can be considered a fundamental component of global element cycling [2]. Differences in oxygen uptake within complex natural communities could lend insight into the utilization of energy sources in the environment as well as into pri- mary production [2]. The availability of a simple tech- nique that could provide direct and precise oxygen measurements in marine or freshwater samples with low cell counts would significantly improve our knowledge of aquatic ecosystem functioning at local or global scales. In addition to applications for environmental studies, oxygen uptake rates are important for eukaryotic cell biology. Oxygen uptake rates can be directly related to mitochondrial function and have been implicated in the activation of eukaryotic cells and the progression of dis- ease states [3-5]. The ability to predict the progression of cell death pathways would lend insight into the diagnosis, treatment, and prevention of inflammatory diseases such as infection, stroke, heart disease, diabetes, and cancer [6-8]. Potential applications for the direct measurement of respiration rates would be as a gauge of cellular health and metabolic state for stress response, toxicity studies,  T. J. Strovas et al. / Advances in Bioscience and Biotechnology 1 (2010) 398-408 Copyright © 2010 SciRes. ABB 399 and the assessment of the effects on tissues from extra- neous perturbation. To date the most common method for measuring res- piration rates has been electrochemical measurements via traditional Clark electrodes [1,9-11]. However, the drawbacks of electrodes include low sensitivities, signal drift, and consumption of oxygen by the electrode itself [10,11]. Other recent methods have entailed scanning electrochemical microscopy (SECM) and utilization of nanobead sensors attached to the outer membrane of cells [12,13]. However, these techniques have been em- ployed in openly diffusible environments and only indi- cate oxygen flux near the cell membrane or the oxygen sensor. Optical methods for the measurement of oxygen con- sumption rates (OCRs) have become both widely used and accessible in the last several years [14,15]. While palladium and ruthenium based phosphores are used for oxygen sensing, Pt-phosphores have become the most relied upon oxygen sensor dye and have been used rou- tinely in research and industry for over twenty years [1,5,15-21]. In addition, calibration, signal acquisition, and signal processing have become routine in the utiliza- tion of phosphorescent oxygen sensors. Many of the approaches employing optical sensors are based on fab- ricated well arrays or on standard well plate formats commercially available [5,18,20,22-26]. In general with well and plate based systems, the sensor is deposited into the bottom of a well or positioned above the well for oxygen concentration measurements. Plate-based sys- tems have the advantage of low costs associated with the production of mold injected plastic plates compared to the fabrication of well systems. However, the main drawback of plate-based sensing platforms is that the materials used in these techniques are themselves per- meable to oxygen and require extensive characterization to separate the actual respiration rates from the leakage or diffusion of extraneous oxygen into the sample chamber [20,22,25,27-28]. In addition, difficulties with reproducible sealing of these devices present additional variability. The result is that the signal acquired for op- tical probes is that of flux of the oxygen near the sensor and not of a direct measurement of the OCR. Thus far, the only known method for directly measuring the OCR of cells has been an optical technique employed in a dif- fusionally sealed borosilicate chamber [1,18]. Herein, we describe the development of the Respira- tory Detection System (RDS), which is capable of di- rectly measuring the respiration rate of biological sam- ples in a simple and reproducible manner. The RDS is unique in its ability to measure OCR’s of dilute biologi- cal samples in a reversibly sealed sample chamber that can maintain a diffusional seal for over two hours. Commercially-available slides as well as fabricated glass well systems were tested as components of the RDS, and the latter was shown to provide rapid and reproducible measurement of OCRs for attached mammalian cell lines, low optical density bacterial cultures, and envi- ronmental samples. 2. METHODS 2.1. Cellular Samples and Growth Conditions Methylobacterium extorquens AM1 was grown in batch culture at 28℃ in minimal salts medium using either 0.3% (vol/vol) methanol or 0.4% succinate as a carbon source [29]. 2.2. Lake Washington Sediment Lake Washington sediment core samples were collected as described previously [30]. Sediment cores were transported to the laboratory on ice and stored at 9℃. The samples of the top layer of the sediment were ana- lyzed within 24 hours after collection. 2.3. Mammalian Cell Cultures Human lung carcinoma cells (A549) and human colon carcinoma cells (HCT-116) were gifts from the Rabino- vitch Lab (Department of Pathology, University of Washington). The mouse macrophage-like cell line, RAW 267.4 was a gift from the Cookson Lab (Department of Laboratory Medicine, University of Washington). A549 and HCT cells were cultured under identical conditions as previously described with the exception that 5% Fetal Cone III (HyClone, Logan, UT) was used [18]. RAW 267.4 cells were cultured as previously de- scribed [18]. Normal human bronchial epithelial (NHBE) cells were purchased from Lonza (Allendale, NJ). Cell cul- tures were grown in bronchial cell growth media (BEGM) with supplemental factors for NHBE cells (Lonza, Allendale, NJ). 2.4. Prototype System Glass slides containing three concave depressions (Erie Scientific, Portsmouth NH) were employed as macro- wells. The slides were cut into thirds (with a diamond tipped pen) to separate the three depressions. In order to normalize the data as oxygen consumption rate per cell, the volumes of the depressions were measured by accu- rately weighing the macrowell and cover slip dry and then again with the depression filled with water and sealed with the cover slip. The calculated volume and the estimated number of cells were used to convert the oxygen concentration depletion rates in the macrowell to average oxygen consumption rate per cell.  T. J. Strovas et al. / Advances in Bioscience and Biotechnology 1 (2010) 398-408 Copyright © 2010 SciRes. ABB 400 2.5. Respiratory Detection System Description The glass chips containing the RDS-wells were fabri- cated in borosilicate glass as previously described re- sulting in square RDS-wells with dimensions of 5, 8, and 10 mm2 and a well depth of 45 μm resulting in well volumes of 1.2, 3.2 and 4.5 μl respectively (Figure 1), [18]. In addition, RDS-wells with a volume of 1.2, 3.2 and 4.5 μl had a corresponding lip area of 100, 49, and 25 mm2. The fabrication process yielded 24, 15 x 15 x 0.5 mm chips per wafer, each containing one etched square well. Lids for sealing the glass RDS-wells for experiments on biological samples were fabricated from borosilicate glass by dicing 4-inch wafers into 20 x 20 mm squares. During experiments, RDS-wells were housed within a miniature cell incubator (MCI), which consisted of a microscope platen, a quartz viewing window, and a del- rin structure to form a 4 ml MCI-well (Figure 1), [18]. The MCI-well containing 2 ml growth medium was mounted directly onto the microscope stage. RDS-wells were held in place within the MCI-well with a 0.4 mm thick stainless steel chip holder. For routine experiments a quartz coverslip (VWR, West Chester, PA) was used as a lid. 2.6. Oxygen Sensor The oxygen sensors used were 1 μm Pt phosphor car- boxylate-modified microspheres (Invitrogen, Eugene, OR) rinsed in deionized water (dH2O; 1 μm beads dis- continued, 40 nm beads available as product #F-20886). Approximately 0.1 μl of beads were pipetted into the RDS-wells after a 1 minute plasma etch to ensure that the surface of the well was hydrophilic. Sensor patches were cured for 10 minutes at 170℃ to ensure surface adhesion by melting the microspheres. Following sensor deposition, the RDS-wells were ethanol sterilized and stored in sterile 12 well plates. 2.7. Sensor Calibration Sensor patches were calibrated by saturating the liquid in the RDS wells with gas containing 0, 10, and 20% oxy- gen (5% CO2, N2 balance). The gasses were passed through 5 ml of water to humidify them and bathed over 2 ml of dH2O or the mammalian cell culture medium DMEM (Dulbecco’s Modified Eagle’s Medium) in the MCI at 24℃ and 37℃. 2.8. Seal Tests The lid used for seal testing the glass RDS-wells (seal test lid) was made of 5 layers of 0.5 mm thick, 20 x 20 mm borosilicate glass affixed to a piston comprised of 0.25” stainless steel drillstock with a tapered end, fabri- cated in-house. A thin layer of polydimethylsiloxane (PDMS) the size of the tapered tip was glued to the tip of the piston between the stainless steel and the glass as a conformal layer. The thick layers of glass ensured that no significant flexing of the piston tip would occur under pressure. All layers were glued together using medi- cal-grade biocompatible UV-curable adhesive (Dymax Corp, Torrington, CT) and all parts were cleaned in an air plasma (Harrick Plasma Corp, Ithaca, NY) before gluing to strengthen the adhesive bond. The diffusional seal tests were conducted in water and DMEM at 24℃ by equilibrating 1ml of fluid to 0% dis- solved oxygen with nitrogen, placing the seal test lid over the 4.5, 3.2, and 1.2 μl RDS-well sizes with corre- sponding lip areas of 100, 49, and 25 mm2 at 0 and 15 pounds psi, and turning off the gas line to allow the sur- rounding liquid outside of the sealed RDS-well to re-equilibrate to ambient oxygen concentrations. Sen- sor signal was acquired before the lid was added to en- sure that the fluid was properly equilibrated and for up to 18 hours after the gas line was turned off. Figure 1. Schematic of a sealed RDS-well housed in the miniature cell incubator (Molter et al. 2009). (a) Aluminum platen; (b) Delrin structure that forms the MCI-well to hold cell media; (c) Glass lid; (d) RDS-well with prophyrin sensor; (e) Chip holder; (f) Quartz viewing window.  T. J. Strovas et al. / Advances in Bioscience and Biotechnology 1 (2010) 398-408 Copyright © 2010 SciRes. ABB 401 2.9. Bacterial Culture and Environmental Sample Manipulation Prior to the measurement of respiration rates, the RDS- wells were seeded with the cells of interest. For cul- tures of M. extorquens AM1 and Lake Washington sediment, 2 ml samples were pipetted directly into the MCI-well. Aliquots of M. extorquens AM1 cultures in logarithmic growth were diluted to OD600nm of ~0.10. The number of M. extorquens AM1 cells in the sample was calculated via the equation y = 4 x 10⁸x – 4 x 10⁶ such that y = colony forming units and x = OD600nm [31]. For the mammalian cell lines, A549, HCT, and RAW 267.4 cell suspensions were centrifuged for 10 minutes at 24℃ at 1200 RPM. The pellet was resuspended in fresh medium and counted using a hemacytometer with 0.1% Trypan Blue (Invitrogen, Carlsbad, CA). 2.10. Mammalian Culture Spot Seeding Method A spot seeding method was used for all experiments with RAW 267.4 cells with the prototype system wells, initial baseline experiments with A549 cells in RDS-wells, and hypoxic experiments with A549 cells in RDS wells. Spot seeding entailed pipetting cells directly into a well con- taining a sensor patch, ensuring that the cell solution did not spill over onto the lip of the well. Cell suspensions of 50-150 μl RAW 267.4 cells (~200,000 cells) and 15-30 μl A549 cells (~20,000 cells) were used. The seeded prototype macrowells and RDS-wells were incubated under standard culture conditions for one hour to allow cells to attach to the glass surface. The prototype ma- crowells and RDS-wells, housed in a sterile 100 mm petri dish, were then immersed in 20 ml DMEM prior to the measurement of oxygen uptake rates. Prior to the measurement of OCRs using the prototype macrowells, 350 µL of medium was added to the de- pression and the macrowell was sealed by the addition of a glass cover slip with the excess medium removed by pushing down on the cover slip with light force. The sealed macrowell was placed directly on a glass slide for imaging and maintained at 37℃ [24]. RDS-wells spot seeded with A549 cells were manipulated for experi- mentation as described above. 2.11 . Mammalian Culture Masked-Well Seeding Method Prior to RDS-well seeding, Blue Tack (Semiconductor Equipment Corporation, Moorpark, CA) was applied to the surface of the sterilized chip and tape covering the well was removed leaving the tape only on the lip of the chip around the well, which will be referred to as a masked RDS-well. The masked RDS-wells were subse- quently placed into one well of a 12-well plate. 100,000 A549, HCT, or NHBE cells were seeded in a 2ml vol- ume and incubated overnight to allow cells to settle and fully attach. NHBE seeding was conducted with the ad- dition of 0.01% fibronectin (Invitrogen, Carlsbad, CA) Prior to experiments the tape covering the lip of the RDS-well was removed and the seeded RDS-wells were manipulated as described above. 2.12. Experimental Design Hypoxic recovery experiments were carried out by in- cubating A549 cultures at 1% oxygen (5% CO2, N2 bal- ance) in a triple gas incubator (Thermo, Asheville, NC) 24 hours prior to well seeding. Once spot seeded, the wells were maintained at 1% oxygen until measurements were made. For NHBE cells, RDS-wells were masked- well seeded as described above. 24 hours prior to ex- periments, the 12 well plates containing seeded RDS- wells were placed within a 1% oxygen atmosphere. For respiratory inhibition experiments, RDS-wells masked-well seeded with A549 cells were incubated in the presence of 1, 10, or 100 nM rotenone (Sigma Al- drich, St. Louis, MO) for 15 minutes. Treated RDS-wells were immediately placed into a petri dish containing 10 ml growth medium without rotenone and transferred into a MCI-well for the detection of oxygen uptake rates. To seal an RDS-well seeded with cells, a glass lid was placed directly on top of the well and moderate pressure was applied to achieve a good surface tension seal. Measurements were conducted on a Zeiss LSM 510 META (Thornwood, NY) using a 10 × 0.3 N.A. objec- tive at 24℃ for M. extorquens AM1 cultures and Lake Washington sediment, and 37℃ for mammalian cell lines. Temperature control was maintained as previously described [24]. Sensor signal acquisition was carried out from 10-60 minutes depending on conditions and cell type. All data collection and analysis was conducted as previously described [18]. For RDS-wells seeded with cells 24-48 hrs prior to experiments, the cells were stained with Calcien AM (Invitrogen, Carlsbad, CA) for 30 minutes and the entire well was imaged using the tile feature in the Zeiss LSM software (version 4.0 SP2) resulting in a 13.5 × 13.5mm image (15 × 15 tiles). Ex- citation was conducted with a 488nm argon laser at 1% power and detected in transmission or fluorescence de- tection mode. In order to count the number cells in the RDS-wells, the tile images obtained were first converted to TIF files using the Zeiss LSM software. The constituent tiles were separated using Matlab 7.3.0.267 (Mathworks, Novi, MI) resulting in 225 tiles of 512 × 512 pixels. Each tile im- age was converted to its grayscale equivalent using Im- ageJ (http://rsbweb.nih.gov/ij /), [32], processed to re- move image noise, and segmented using a modified wa- tershed algorithm in Cell-Profiler (www.cellprofiler.org), [33], which accounted for segmentation errors due to 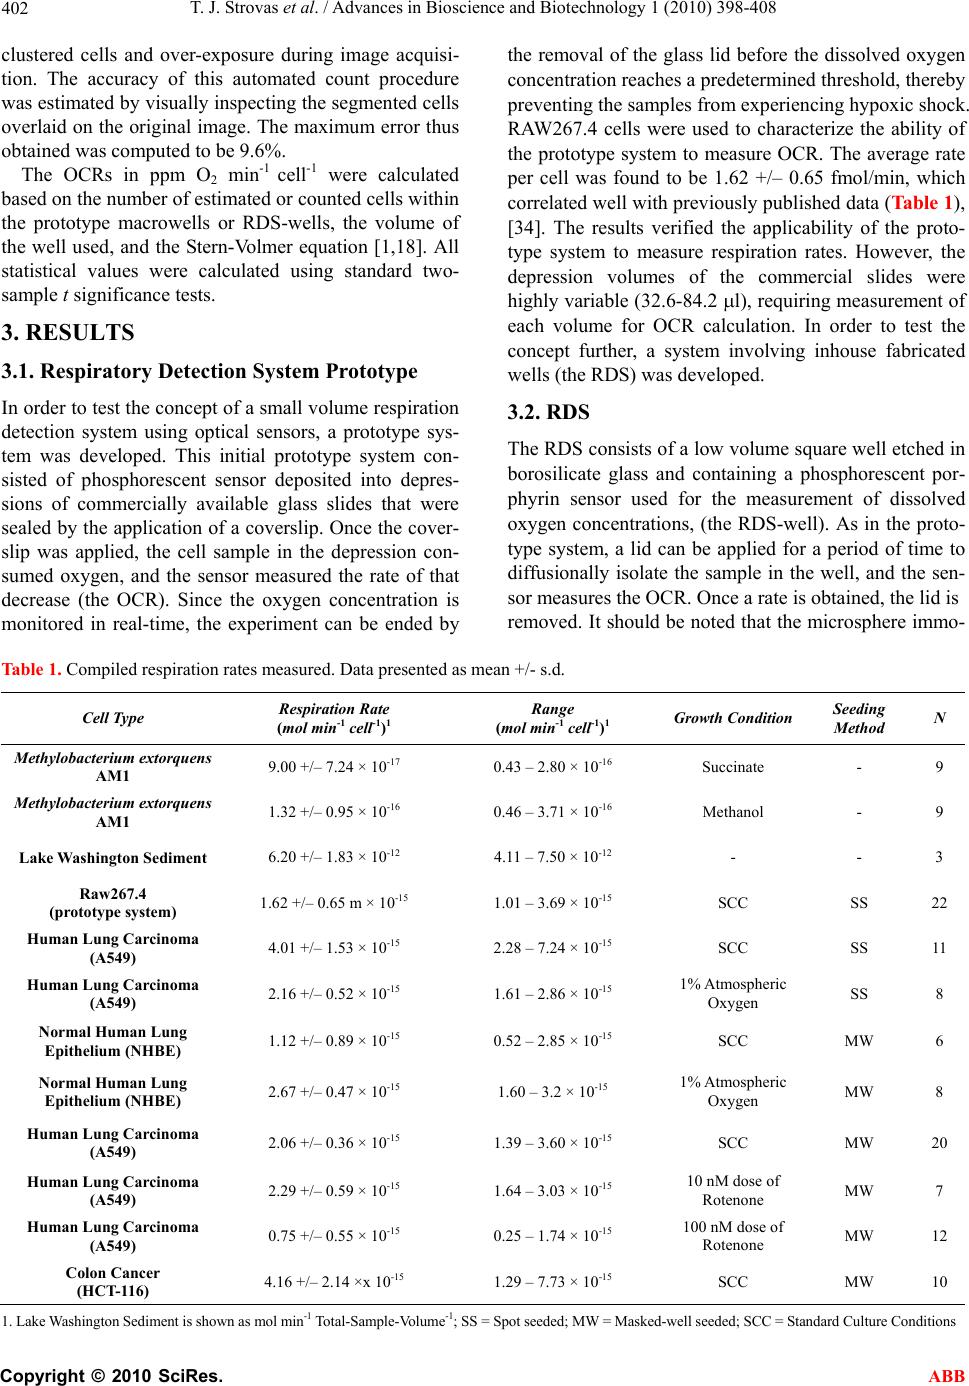 T. J. Strovas et al. / Advances in Bioscience and Biotechnology 1 (2010) 398-408 Copyright © 2010 SciRes. ABB 402 clustered cells and over-exposure during image acquisi- tion. The accuracy of this automated count procedure was estimated by visually inspecting the segmented cells overlaid on the original image. The maximum error thus obtained was computed to be 9.6%. The OCRs in ppm O2 min-1 cell-1 were calculated based on the number of estimated or counted cells within the prototype macrowells or RDS-wells, the volume of the well used, and the Stern-Volmer equation [1,18]. All statistical values were calculated using standard two- sample t significance tests. 3. RESULTS 3.1. Respiratory Detection System Prototype In order to test the concept of a small volume respiration detection system using optical sensors, a prototype sys- tem was developed. This initial prototype system con- sisted of phosphorescent sensor deposited into depres- sions of commercially available glass slides that were sealed by the application of a coverslip. Once the cover- slip was applied, the cell sample in the depression con- sumed oxygen, and the sensor measured the rate of that decrease (the OCR). Since the oxygen concentration is monitored in real-time, the experiment can be ended by the removal of the glass lid before the dissolved oxygen concentration reaches a predetermined threshold, thereby preventing the samples from experiencing hypoxic shock. RAW267.4 cells were used to characterize the ability of the prototype system to measure OCR. The average rate per cell was found to be 1.62 +/– 0.65 fmol/min, which correlated well with previously published data (Table 1), [34]. The results verified the applicability of the proto- type system to measure respiration rates. However, the depression volumes of the commercial slides were highly variable (32.6-84.2 l), requiring measurement of each volume for OCR calculation. In order to test the concept further, a system involving inhouse fabricated wells (the RDS) was developed. 3.2. RDS The RDS consists of a low volume square well etched in borosilicate glass and containing a phosphorescent por- phyrin sensor used for the measurement of dissolved oxygen concentrations, (the RDS-well). As in the proto- type system, a lid can be applied for a period of time to diffusionally isolate the sample in the well, and the sen- sor measures the OCR. Once a rate is obtained, the lid is removed. It should be noted that the microsphere immo- Table 1. Compiled respiration rates measured. Data presented as mean +/- s.d. Cell Type Respiration Rate (mol min-1 cell-1)1 Range (mol min-1 cell-1)1 Growth Condition Seeding Method N Methylobacterium extorquens AM1 9.00 +/– 7.24 × 10⁻¹⁷ 0.43 – 2.80 × 10⁻¹⁶ Succinate - 9 Methylobacterium extorquens AM1 1.32 +/– 0.95 × 10⁻¹⁶ 0.46 – 3.71 × 10⁻¹⁶ Methanol - 9 Lake Wa shington Sedime nt 6.20 +/– 1.83 × 10⁻¹² 4.11 – 7.50 × 10⁻¹² - - 3 Raw267.4 (prototype system) 1.62 +/– 0.65 m × 10-15 1.01 – 3.69 × 10⁻¹⁵ SCC SS 22 Human Lung Carcinoma (A549) 4.01 +/– 1.53 × 10⁻¹⁵ 2.28 – 7.24 × 10⁻¹⁵ SCC SS 11 Human Lung Carcinoma (A549) 2.16 +/– 0.52 × 10⁻¹⁵ 1.61 – 2.86 × 10⁻¹⁵ 1% Atmospheric Oxygen SS 8 Normal Human Lung Epithelium (NHBE) 1.12 +/– 0.89 × 10⁻¹⁵ 0.52 – 2.85 × 10⁻¹⁵ SCC MW 6 Normal Human Lung Epithelium (NHBE) 2.67 +/– 0.47 × 10⁻¹⁵ 1.60 – 3.2 × 10⁻¹⁵ 1% Atmospheric Oxygen MW 8 Human Lung Carcinoma (A549) 2.06 +/– 0.36 × 10⁻¹⁵ 1.39 – 3.60 × 10⁻¹⁵ SCC MW 20 Human Lung Carcinoma (A549) 2.29 +/– 0.59 × 10⁻¹⁵ 1.64 – 3.03 × 10⁻¹⁵ 10 nM dose of Rotenone MW 7 Human Lung Carcinoma (A549) 0.75 +/– 0.55 × 10⁻¹⁵ 0.25 – 1.74 × 10⁻¹⁵ 100 nM dose of Rotenone MW 12 Colon Cancer (HCT-116) 4.16 +/– 2.14 ×x 10-15 1.29 – 7.73 × 10⁻¹⁵ SCC MW 10 1. Lake Washington Sediment is shown as mol min-1 Total-Sample-Volume-1; SS = Spot seeded; MW = Masked-well seeded; SCC = Standard Culture Conditions  T. J. Strovas et al. / Advances in Bioscience and Biotechnology 1 (2010) 398-408 Copyright © 2010 SciRes. ABB 403 bilization protocol used in this study had no effect on sensor response. Preliminary experiments with RAW 267.4 cells demonstrated the feasibility of using the RDS to measure OCRs. Therefore, the RDS was assessed further. 3.3. Sensor Calibration and Seal Verification for the RDS Sensor calibration was carried out as described previ- ously, and the calibration data generated were consistent with the previous study (data not shown), [18]. Next, the RDS was tested to determine whether pressure on the lid was required to obtain an oxygen barrier for the time period expected for experimental protocols. Seal tests were conducted in triplicate on RDS-wells with lip areas of 100, 49, and 25 mm2 using 0 and 15 lbs pressure for up to 18 hours after the seal test lid was applied (Figure 2). The time for which the diffusional seal was main- tained, or the seal time, ranged from 38.35 to 66.95 min for 0 lbs (force applied onto seal lid) and 94.84 to 178.88 min for 15 lbs for all RDS-well sizes combined. Figure 2(b)-(c) demonstrates that the RDS-well lip area had a negligible effect on seal times and the corresponding diffusional rate after the seal expired. However, it was found that diffusional rates of oxygen into the wells after the seal expired modestly correlated with the length of the seal time with 0 and 15 lbs force (Figure 2(d)). 3.4. Detection of Respiration Rates from Bacterial Cultures and Environmental Samples To test the use of the RDS with bacterial cultures, loga- rithmically growing cultures of the gram-negative bacte- rium Methylobacterium extorquens AM1 were diluted and tested at an OD600nm of ~0.10 during growth on suc- cinate or methanol (Figure 3(a)). Respiration rates/cell were calculated to be 90 +/- 73 amol min-1 cell-1 and 132 +/- 95 amol min-1 cell-1 during growth on succinate and methanol respectively. The calculated rates had a range of 43 – 280 amol min-1 cell-1 for succinate growth and 46-371 amol min-1 cell-1 for methanol growth. To test the use of the RDS with environmental sam- 0 20 40 60 80 100 120 140 160 180 200 0 lbs15 lbs Seal T ime ( min ) 1.2 l Well 3.2 l Well 4.5 l Well 0 1 2 3 4 5 6 7 0200 400 600 8001000 ppm Oxyg en Time (min) (a) (b) 0 0.00002 0.00004 0.00006 0.00008 0.0001 0.00012 0.00014 0.00016 0 lbs15 lbs 1.2 l Well 3.2 l Well 4.5 l Well y = -3E-06x + 0.000 R² = 0.498 y = -2E -07x + 4E -05 R² = 0.3 0 0.00002 0.00004 0.00006 0.00008 0.0001 0.00012 0.00014 0.00016 050100 150 200 Seal Ti me ( mi n) 0 lb s 15 lbs Linear (0 lbs) Line ar ( 15 lbs) (c) (d) Figure 2. Summary of seal tests for RDS-wells with volumes of 1.2, 3.2, and 4.5 l using 0 and 15 lbs of force. RDS-wells with volumes of 1.2, 3.2, and 4.5 l correspond to lip areas of 100, 49, 25 mm2 respectively. (a) Represen- tative data from a 4.5 l RDS-well after a seal was initiated with 15 lbs and the diffusion rate of oxygen into the well after the seal expired (8.8 × 10⁻⁶ ppm O2 min-1 mm-2). The arrow marks the expiration of the diffusional seal after 154.7 minutes. (b) Average seal time for all well volumes using 0 and 15 lbs. (c) Average diffusional rate of oxygen into the RDS-wells after the diffusional seal expired. (d) Diffusion rates of oxygen after the seal expired versus seal times. Data displayed as mean +/– s.d.  T. J. Strovas et al. / Advances in Bioscience and Biotechnology 1 (2010) 398-408 Copyright © 2010 SciRes. ABB 404 y = - 0 .112x + 6.608 R² = 0.954 y = -0.072x + 4.440 R² = 0.947 0 1 2 3 4 5 6 7 0 10203040 ppm Oxygen Time (min) Methanol Succinate Linear (Methanol) y = - 0 .0 69x + 4.537 R² = 0.990 y = -0.041x + 6.648 R² = 0.73 3 y = - 0 .0 75x + 4.961 R² = 0.985 0 1 2 3 4 5 6 7 0 1020304050 ppm Oxygen Time (min) Figure 3. Oxygen uptake data acquired from bacterial cultures and Lake Washington sediment. (a) Example oxygen consumption rates obtained from ~ 1.7 × 10⁵ M. extorquens AM1 cells grown on succinate or methanol with an optical density (600 nm) of ~0.10. (b) Summary of respiration rates obtained from 3 replicates for the top aerobic layer of Lake Washington sediment. ples, the oxygen consumption rate from the top aerobic layer (1 cm) of Lake Washington sediment cores was measured. The minimum incubation time required for a rate calculation was 30-40 minutes, which was more than 40 times shorter compared to routine incubation approaches (Figure 3(b)), [2]. The rate of oxygen con- sumption in the RDS system for the sediment samples was 6.20 1.83 × 10⁻¹² mol min-1 Total-Sample-Volume-1 or 116.25 +/– 34.27 mmol O2 m -3 hr-1. The values ob- tained fall within the range previously reported for fresh- water lakes [2]. 3.5. Oxygen Consumption Rates of Mammalian Cell Lines and the Effects of Extraneous Perturbation Experiments were carried out to demonstrate efficacy of the RDS for assessing response to perturbations with cultured mammalian cells. The respiration rates from A549, HCT-116, and NHBE cells were tested under standard tissue culture conditions and were found to be similar to literature values for the cell lines A549 [5,18] and HCT-116 [35], (Table 1). For one set of perturbation experiments, the effects of anoxic conditions on respiration rates were tested for A549 and NHBE cells grown at 20% or 1% oxygen for 24 hours prior to the measurement of respiration rates. For these experiments, A549 cells were spot seeded and NHBE cells were masked-well seeded. A549 cells grown in a 1% oxygen environment displayed an oxygen up- take rate that was half of the rate observed from control cells, matching trends in the literature (p-value < 0.005), [36], while NHBE cells displayed a two-fold increase in respiration rates compared to control cells (p-value < 0.01; Figure 4). NHBE cells were attached to the glass surface of the RDS-wells via the addition of 0.01% fi- bronectin to the cell seeding solution. Precoating the RDS-wells with fibronectin or adding the fibronectin to the cell solution were both found to be effective in fa- cilitating cell attachment. However, if the lip of an RDS-well became coated with fibronectin, a diffusional seal was not possible. This problem was alleviated by applying Blue Tack Tape to the lip of an RDS-well and then removing it after seeding, which was effective in allowing both cell attachment in the wells and sealing of the wells. This process is termed masked-well seeding. As a second perturbation test, masked-well seeded A549 cells were treated with 0, 1, 10, and 100 nM rote- none, a respiratory inhibitor. Concentrations greater than 100 nM were observed to completely arrest oxygen up- take rates, while a concentration of 1 nM rotenone had no effect (data not shown). Cells treated with 100 nM rotenone showed a three-fold decrease in respiration rates compared to controls (p-value < 0.0005) and cells treated with 10 nM exhibited no effect (p-value > 0.15; Figure 5). After the respiration rates from cells seeded on masked RDS-wells were measured, the cells were stained with Calcien AM and imaged (Figure 6). Since cells were seeded into the wells 24-48 hours prior to measurements, it was necessary to count the number of live cells in the wells for an accurate calculation of respiration rates per cell (see methods section). Two approaches were used for counting, hemacytometer and image analysis. Com- parisons of baseline data of A549 cells spot seeded ver- sus masked-well seeded indicate that spot seeding cells based on cell counts generated by a hemacytometer greatly underestimated the number of cells within the sample chamber when compared to directly counting the number of seeded cells via image analysis. 4. CONCLUSION AND DISCUSSION In this report we demonstrate the applicability of the Respiratory Detection System for directly measuring OCRs from different types of cell samples. Previous efforts have focused on the measurement of single cell respiration rates, and here we show that the RDS is a  T. J. Strovas et al. / Advances in Bioscience and Biotechnology 1 (2010) 398-408 Copyright © 2010 SciRes. ABB 405 y = -0.501x + 5.147 R² = 0.990 y = - 0 .2 32x + 3.792 R² = 0.995 0 1 2 3 4 5 6 7 0510 15 ppm Oxygen Time (min) 20% Oxygen 1% Oxyge n Linear (20% Oxygen) y = -0.084x + 7.13 R² = 0.903 y = -0.193x + 3.349 R² = 0.996 0 1 2 3 4 5 6 7 0 10203040 ppm Oxygen Time (min) 20% Oxygen 1% Oxygen Linear (20% Oxygen) Figure 4. Oxygen uptake data obtained from mammalian cell lines. (a) Example data from A549 cells grown 24 hours under standard tissue culture conditions and in a 1% oxygen environment. (b) Example data from NHBE cells main- tained 24 hours under a 20% and 1% oxygen environment. 0.00E+00 5.00E-16 1.00E-15 1.50E-15 2.00E-15 2.50E-15 3.00E-15 3.50E-15 Control10nM Rotenone100nM Rotenone Respiration Rate (mol O2 min-1 cell-1) Figure 5. Summary of respiration rates obtained from A549 cultures treated with 10 and 100 nM rotenone. Data displayed as mean +/– s.d. viable alternative for use with bulk populations. The RDS was demonstrated to be compatible with attached mammalian cell lines, low optical density bacterial cul- tures, and environmental samples. In addition, the RDS was demonstrated to maintain a diffusional seal for up to three hours to allow for OCR measurements on highly diluted or slowly respiring samples. These features and the ability to directly measure the OCR are a significant improvement compared to oxygen flux-based measure- ments in sample chambers made from plastics. The de- sign parameters of the RDS integrate large glass-glass interfaces which allows for long diffusional seals. Due to the fabrication method to make RDS-wells, well dimen- sions can be easily changed to accommodate different sample types with the potential to measure OCR’s from larger multi-cellular organisms (e.g. nematodes, zebraf- ish embryos). In addition to these novel characteristics, the simple design, inexpensive fabrication, and straight- forward implementation of the RDS would readily allow for its integration into a preexisting plate reader format, on an optical microscope system, or as a portable device for use in the field. Our results indicate that repeatable oxygen uptake rates could be measured with experimental times as short as ten minutes in the largest RDS-well, depending on the cellular sample. The versatility of the RDS is demon- strated by the broad spectrum of biological samples that can be tested, including mammalian cell strains that re- quire special coatings to assist in cell attachment and proliferation. The RDS utilizes a commercially available phospho- rescent oxygen sensor to measure oxygen uptake rates. However, any optically based oxygen sensor could be employed with the RDS. Since phosphorescence-based oxygen reporters are detected by the lifetime decay of the excited phosphor [15], the RDS can be used to per- form both fluorescence-based and phosphorescence-based measurements due to the difference in decay timescales, nanoseconds vs. microseconds respectively. The ability to multiplex oxygen sensing with additional fluorescence reporters allows for a wide array of fluorescence-based reporters to be used simultaneously, which could be im- aged on a microscope, detected with a plate reader, or with a basic filter-based light emitting diode/photo mul- tiplier tube optical train [5,9]. The RDS is a device that can be used to directly measure the respiration rate of bulk samples in a reversi- ble diffusionally sealed sample chamber. The simplicity of the device and the ability to use microliter-scale cell samples makes it a logical alternative or enhancement to other established methods for measuring oxygen. By integrating the RDS design with existing systems, OCR measurements would directly reflect oxygen consump- tion rather than the flux of oxygen near the sensor. These characteristics of the RDS would allow the system to be employed as a portable device, a stand-alone bench top system, a microscope mounted device, or it could be integrated into a standard plate reader format. The latter approach would allow taking advantage of the absorb- ance, fluorescence, and luminescence detection capabili- ties of microplate readers to multiplex a wide array of assays with the detection of oxygen uptake rates [37]. The respiration rate of a cell can be used as a gauge of  T. J. Strovas et al. / Advances in Bioscience and Biotechnology 1 (2010) 398-408 Copyright © 2010 SciRes. ABB 406 (a) (b) (c) (d) Figure 6. Images of an RDS-well seeded with NHBE cells. (a) A transmission tile image in channel D. (b) Tile image of NHBE cells stained with Calcien AM. (c) Single image from a transmission tile scan showing the edge of the sensor ring. (d) Single image from the fluorescence tile scan of NHBE cells stained with Calcien AM. metabolic state and cellular health. Thus, the RDS has a broad range of possible applications, especially in cases in which the sample size is limited. The ability to main- tain a diffusional seal allows for greater sensitivity when measuring subtle changes in OCRs and when the sample exhibits a slow respiration rate such as dilute bacterial cultures or environmental samples. This sensitivity could be beneficial in the study of the effects of experimental drugs on target cells as an assay in a commercial envi- ronment or as a clinical screen of fertilized embryos to be used for in vitro fertilization [16]. This same concept is relevant in gauging the effects of stimuli on cells in the investigation of stress response and toxicity studies. Lastly, the compatibility of the RDS with attached cells  T. J. Strovas et al. / Advances in Bioscience and Biotechnology 1 (2010) 398-408 Copyright © 2010 SciRes. ABB 407 and an optically based oxygen sensor allows for fast replicate measurements without the need for stirring, as compared to detection methods utilizing openly diffus- ible sample chambers. These characteristics impart sig- nificant improvements to existing methods for the meas- urement of respiration rates from biological samples. This work was supported by an NIH National Human Genome Research Institute (NHGRI) Centers of Excel- lence in Genomic Sciences grant (P50 HG 002360) and the U. S. Department of Energy (DE-PS02-07ER07-14). REFERENCES [1] Strovas, T.J., Dragavon, J.M., Hankins, T.J., Callis, J.B., Burgess, L.W. and Lidstrom, M.E. (2006) Measurement of respiration rates of Methylobacterium extorquens AM1 cultures by use of a phosphorescence-based sensor. Applied Environmental Microbiology, 72, 1692-1695. [2] Bidanda, B. (2005) Respiration in aquatic ecosystems. In: Del Giorgio, P.A. and Williams, P.J. le B., Eds., Journal of Plankton Research, Oxford University Press, New York. [3] Fink, S.L. and Cookson, B.T. (2005) Apoptosis, pyrop- tosis, and necrosis: mechanistic description of dead and dying eukaryotic cells. Infection and Immunity, 73, 1907-1916. [4] Weissig, V., Boddapati, S.V., Jabr L., and D'Souza, G.G. (2007) Mitochondria-specific nanotechnology. Nano- medicine, 2, 275-285. [5] Wu, M., Neilson, A., Swift, A.L., Moran, R., Tamagnine, J., Parslow, D., Armistead, S., Lemire, K., Orrell, J., Teich, J., Chomicz, S. and Ferrick, D.A. (2007) Multi- parameter metabolic analysis reveals a close link be- tween attenuated mitochondrial bioenergetic function and enhanced glycolysis dependency in human tumor cells. American Journal of Physiology: Cellular Physiology, 292, 125-136. [6] Bell, E.L. andChandel, N.S. (2007) Mitochondrial oxy- gen sensing: Regulation of hypoxia-inducible factor by mitochondrial generated reactive oxygen species. Essays in Biochemistry, 43, 17-27. [7] Fink, S.L. and Cookson, B.T. (2007) Pyroptosis and host cell death responses during Salmonella infection. Cellu- lar Microbiology, 9, 2562-2570. [8] Maley, C.C. (2007) Multistage carcinogenesis in Bar- rett’s esophagus. Cancer Letters, 245, 22-32. [9] Eklund, S.E., Thompson, R.G., Snider, R.M., Carney, C. K., Wright, D.W., Wikswo, J. and Cliffel, D.E. (2009) Metabolic discrimination of select list agent by monitor- ing cellular responses in a multianalyte microphysiome- ter. Sensors, 9, 2117-2133. [10] Ramamoorthy, R., Dutta, P.K. and Akbar, S.A. (2003) Oxygen sensors: Materials, methods, designs, and appli- cations. Journal of Material Science, 38, 4271-4282. [11] Renger, G. and Hanssum, B. (2009) Oxygen detection in biological systems. Photosynthesis Research, 102, 487- 498. [12] Kuang, Y. and Walt, D.R. (2007) Detecting oxygen con- sumption in the proximity of Saccharomyces cerevisiae cells using self-assembled fluorescent nanosensors. Bio- technology Bio engineering, 96, 318-325. [13] Saito, T., Wu, C.C., Shiku, H., Yasukawa, T., Yokoo, M., Ito-Sasaki, T., Abe, H., Hoshi, H. and Matsue, T. (2006) Oxygen consumption of cell suspension in a poly (di- methylsiloxane) (PDMS) microchannel estimated by scanning electrochemical microscop. Analyst, 131, 1006- 1011. [14] Warkentin, M., Freese, H.M., Karsten, U. and Schumann, R. (2007) New and fast method to quantify respiration rates of bacterial and plankton communities in freshwater ecosystems by using optical oxygen sensor spots. Ap- plied Environmental Microbiology, 73, 6722-6729. [15] Papkovsky, D.B. and O’Riordan, T.C. (2007) Emerging applications of phosphorescent metalloporphyrins. Jour- nal of Fluorescence, 15, 569-584. [16] Abe, H. (2007) A non-invasive and sensitive method for measuring cellular respiration with a scanning electro- chemical microscopy to evaluate embryo quality. Journal of Mammalian Ova Research, 24, 70-78. [17] Borisov, S.M., Nuss, G. and Klimant, I. (2008) Red light-ex- citable oxygen sensing materials based on platinum(II) and palladium(II) benzoporphyrins. Ana- lytical Chemistry, 80, 9435-9442. [18] Molter, T.W., McQuaide, S.C., Suchorolski, M.T., Strovas, T.J., Burgess, L.W., Meldrum, D.R. and Lid- strom, M.E. (2009) A microwell array device capable of measuring single-cell-oxygen consumption rates. IEEE Sensors and Actuators B, 135, 678-686. [19] O’Donovan, C., Twomey, E., Alderman, J., Moore, T. and Papkovsky, D. (2006) Development of a respiromet- ric biochip for embryo assessment. Lab on a Chip, 6, 1438-1444. [20] O'Mahony, F.C., O’Donovan, C., Hynes, J., Moore, T., Davenport, J. and Papkovsky, D.B. (2005) Optical oxy- gen microrespirometry as a platform for environmental toxicology and animal model studies. Environmental Science and Technology, 39, 5010-5014. [21] Wilson, D.F., Vanderkooi, J.M., Green, T.J., Maniara, G., Defeo, S.P. and Bloomgarden, D.C. (1987) A versatile and sensitive method for measuring oxygen. Advances in Experimental Medical Biology, 215, 71-77. [22] Alderman, J., Hynes, J., Floyd, S.M., Krüger, J., O’Conner, R. and Papkovsky, D.B. (2004) A low-volume platform for cell-respirometric screening based on quenched- luminescence oxygen sensing. Biosensors and Bioelectronics, 19, 1529-1535. [23] Birmele, M., Roberts, M. and Garland, J. (2006) Charac- terization of methods for determining sterilization effi- cacy and reuse efficiency of oxygen biosensor multiwell plates. Journal of Microbiological Methods, 67, 619-623. [24] Dragavon, J., Molter, T., Young, C., Strovas, T., McQuaide, S., Holl, M., Zhang, M., Cookson, B., Jen, A., Lidstrom, M. and Burgess, L. (2008) A cellular isolation system for real-time single-cell oxygen consumption monitoring. Journal of the Royal Society Interface, 5(S2), S151-S159. [25] Will, Y., Hynes, J., Ogurtsov, V.I. and Papkovsky, D.B. (2007) Analysis of mitochondrial function using phos- phorescent oxygen-sensitive probes. Nature Protocols, 1, 2563-2572. [26] Wodnicka, M., Guarino, R.D., Hemperly, J.J., Timmins, M.R., Stitt, D. and Pitner, J.B. (2000) Novel fluorescent  T. J. Strovas et al. / Advances in Bioscience and Biotechnology 1 (2010) 398-408 Copyright © 2010 SciRes. ABB 408 technology platform for high throughput cytotoxicity and proliferation assays. Journal of Biomolecular Screening, 5, 141-152. [27] Arain, S., Weiss, S., Heinzle, E., John, G.T., Krause, C. and Klimant, I. (2005) Gas sensing in microplates with optodes: Influence of oxygen exchange between sample, air, and plate material. Biotechnology and Bioengineer- ing, 90, 271-280. [28] Gerencser, A.A., Neilson, A., Choi, S.W., Edman, U., Yadava, N., Oh, R.J., Ferrick, D.A., Nicholls, D.G. and Brand, M.D. (2009) Quantitative microplate-based res- pirometry with correction for oxygen diffusion. Analyti- cal Chemistry, 81, 6868-6878. [29] Strovas, T.J., Sauter, L.M., Guo, X. and Lidstrom, M.E. (2007) Cell-to-cell heterogeneity in growth rate and gene expression in Methylobacterium extorquens AM1. Jour- nal of Bacteriology, 189, 7127-7133. [30] Kalyuzhnaya, M.G., Bowerman, S., Nercessian, O., Lid- strom, M.E. and Chistoserdova, L. (2005) Highly diver- gent genes for methanopterin-linked C1 transfer reac- tions in Lake Washington, assessed via metagenomic analysis and mRNA detection. Applied Environmental Microbiology, 71, 8846-8854. [31] Guo, X. (2006) Intergrative study of metabolism of Me- thylobacterium extorquens AM1 from a metabolomic perspective. Ph.D. dissertation, University of Washington, Department of Chemical Engineering. [32] Abramoff, M.D., Magelhaes, P.J. and Ram, S.J. (2004) Image processing with ImageJ. Biophotonics Interna- tional, 11, 36-42. [33] Carpenter, A.E., Jones, T.R., Lamprecht, M.R., Clarke, C. Kang, I.H., Friman, O., Guertin, D.A., Chang, J.H., Lindquist, R.A., Moffat, J., Golland, P. and Sabatini, D. M. (2006) CellProfiler: image analysis software for iden- tifying and quantifying cell phenotypes. Genome Biology, 7, R100. [34] Nalwaya, N. and Deen, W.M. (2005) Nitric oxide, oxy- gen, and superoxide formation and consumption in macrophage cultures. Chemical Research in Toxicology, 18, 486-93. [35] Leschelle, X., Goubern, M., Andriemihaja, M., Blottiere, H.M., Coupland, E., Gonzalez-Barroso, M.D., Petite, C., Pagniez, A., Chaumentet, C., Mignotte, B., Bouillaud, F. and Blachier, F. (2005) Adaptative metabolic response of human colonic epithelial cells to the adverse effects of the luminal compound sulfide. Biochimica et Biophysica Acta, 1725, 201-212. [36] Heerlein, K., Schulze, A., Hotz, L., Bartsch, P. and Mairbaurl, H. (2005) Hypoxia decreases cellular ATP demand and inhibits mitochondrial respiration of A549 cells. American Journal of Respiratory Cell and Mo- lecular Biology, 32, 44-51. [37] Lidstrom, M.E. and Meldrum, D.R. (2003) Life-on-a- chip. Nature Reviews Microbiolo gy, 1, 158-164. |