H. Va va di et al. / J. Biomedical Science and Engineering 3 (2010) 1182-1189
1188
sub-bands have separation rate over 99.99%. distin-
guishment for this pair of group in beta sub-band is 54.
99% and for delta sub-band is 89.08%.
Comparing O with S shows up to 99.99% separation
probability for EEG, gamma, beta, delta and theta sub-
bands and 99.98% for alpha subband.
For groups F and N the EEG signal has separation
with over 99.99% probability and 99.98% for gamma
sub-band. For alpha sub-band we can’t tabulate P-value
since both of the t-score and degree of freedom were
zero. Beta and theta sub-bands don’t show good separa-
tion rate (41.17% and 0.269%) but delta sub-band has
99.57% probability for separation rate.
For comparing interictal and ictal states (F and S, and
N and S) EEG signal and alpha, beta and theta sub- band s
have separation probability ov er 99.99 % for both pa irs F,
S and N, S. As we see in table 3 separation probability
between F and S for gamma sub-band is 96.47% and
86.29% for delta sub-band.
Separation rate for pair N, S in gamma sub-band isn’t
good not at all (1.84%) but for alpha sub-band is suitable
(99.13%).
4. DISCUSSION
Some other studies have been done in feature extraction
for epilepsy detection. But most of them just have used
for separate 3 groups of these 5 groups and have ignored
the other ones [3,23]. The extracted parameters in this
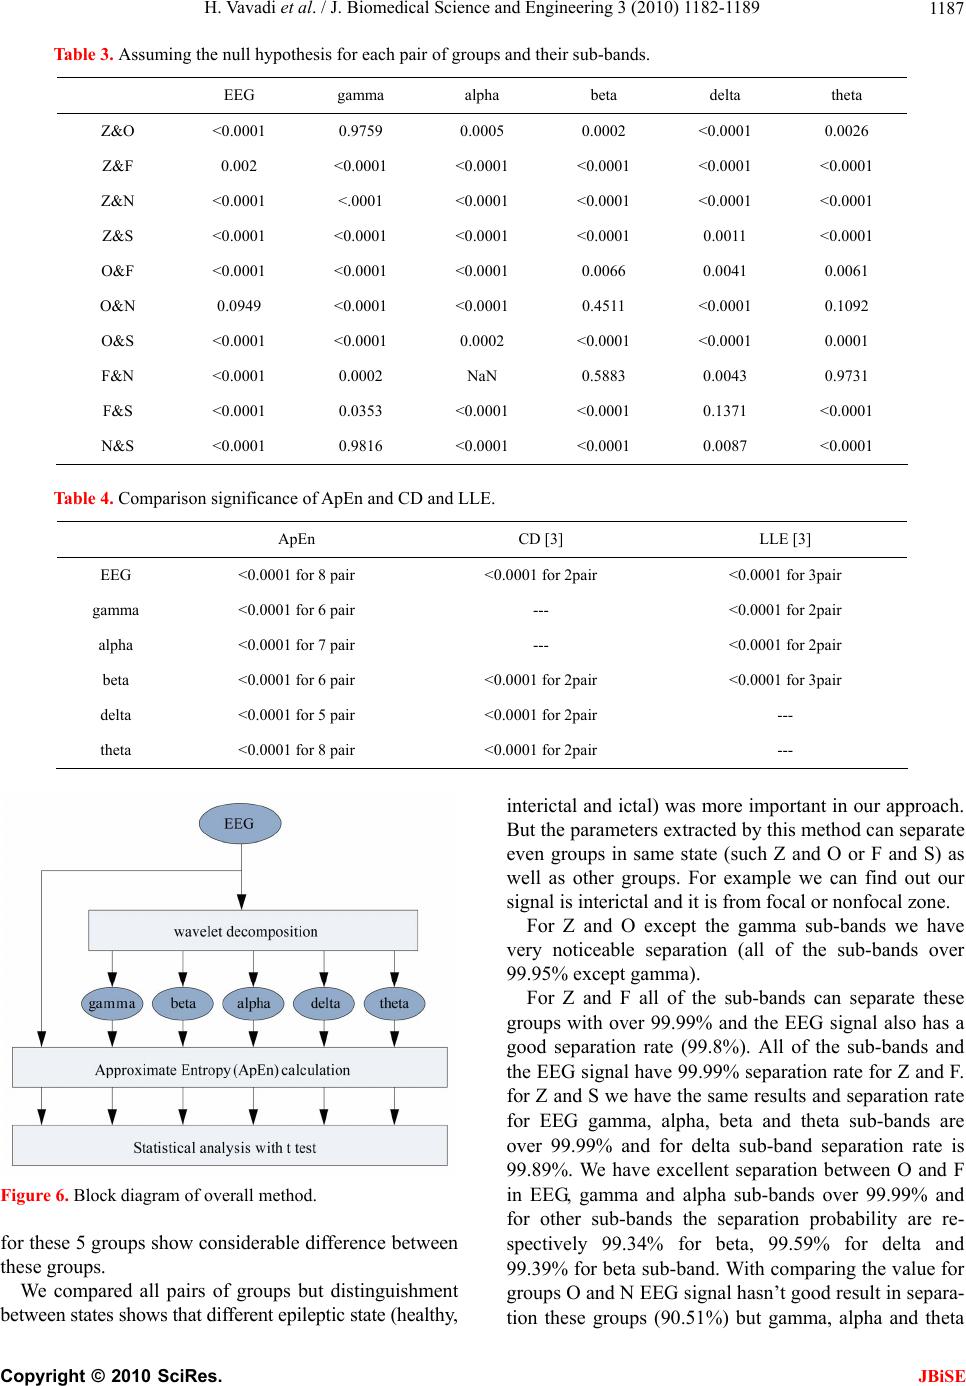
study can separate all of these 5 groups. Considering just
3 groups of these 5 groups shows significant difference
(see Figure 5). In comparison ApEn with CD and LLE
[3] we can see two major improvements.
1) We calculate separation rates for all 10 pairs with
all of 5 groups but in [3] and some other studies just 3
groups have been considered.
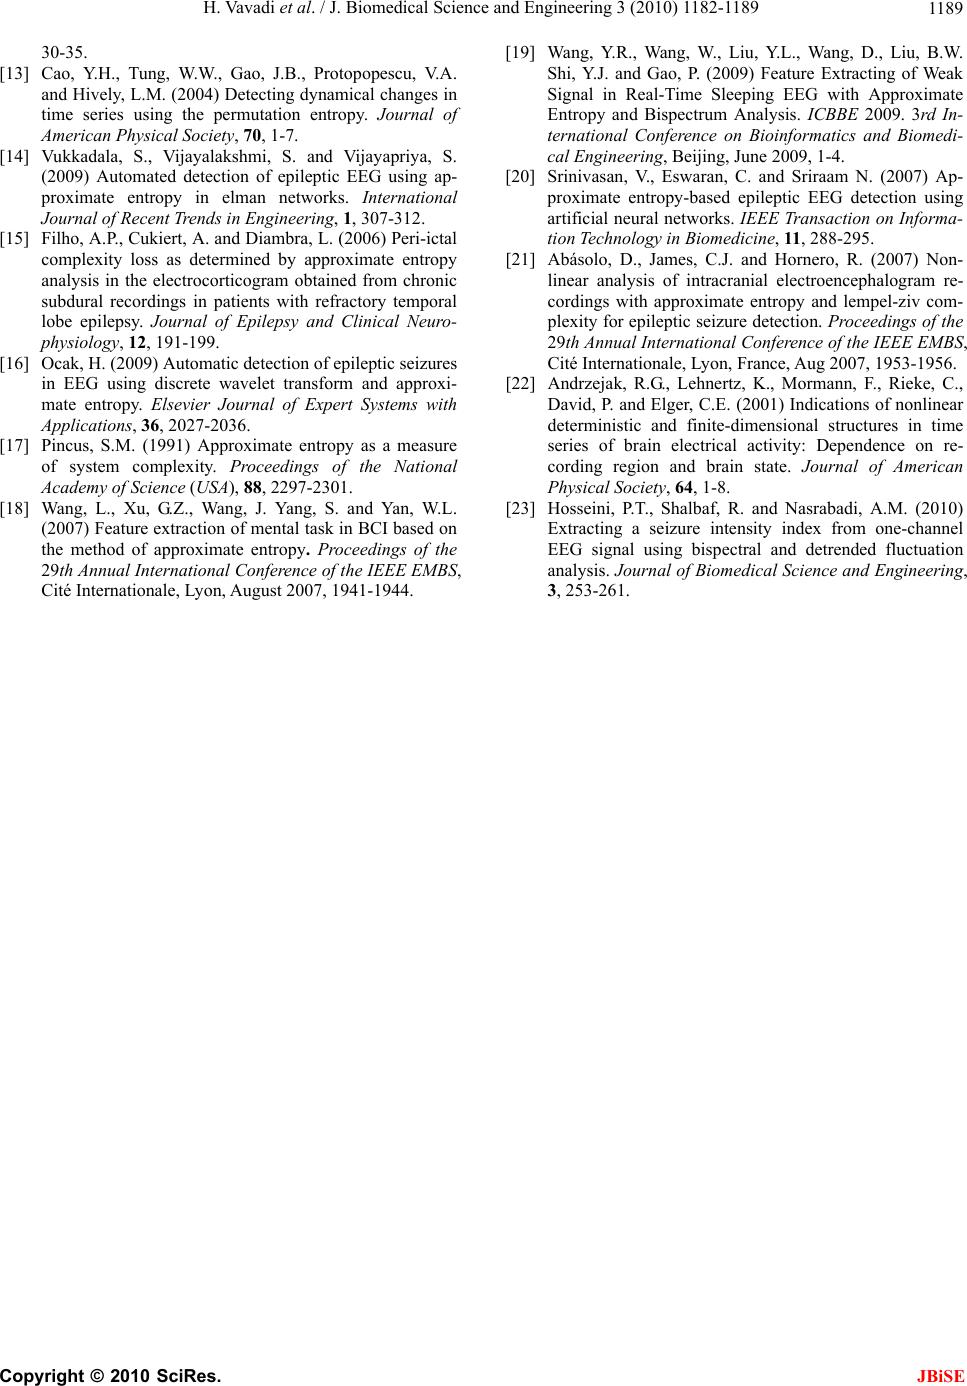
2) ApEn values can separate most sub-bands of each
pair but as we see in Tab l e 4 . In some sub-bands corre-
lation dimension or largest lyapanov exponent don't
show significant difference. And in other sub-bands
these values just can separate 2 or 3 pair of groups.
5. Conclusion
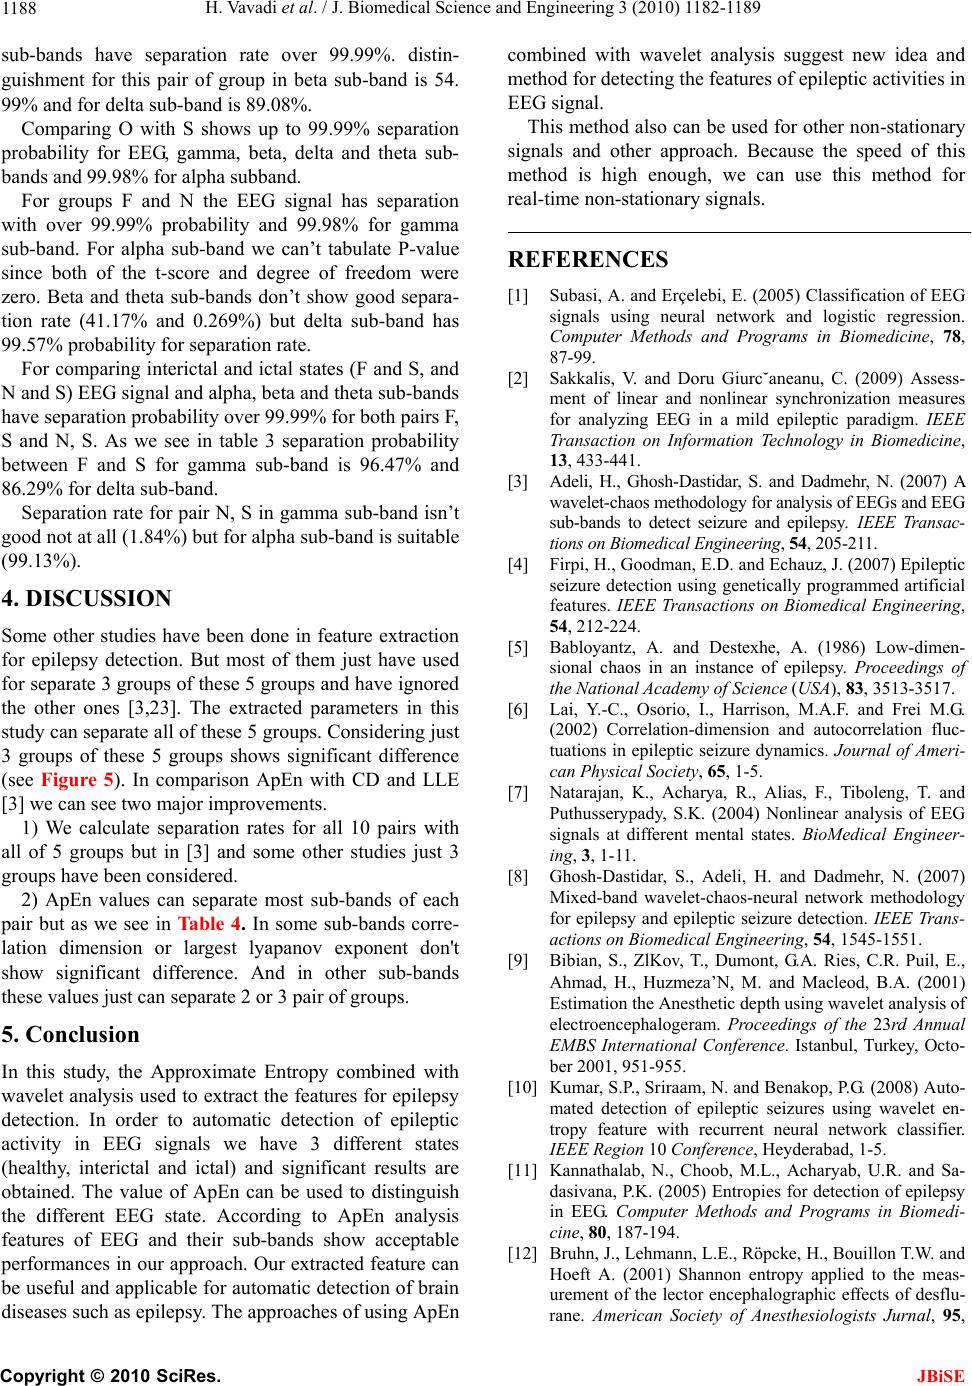
In this study, the Approximate Entropy combined with
wavelet analysis used to extract the features for epilepsy
detection. In order to automatic detection of epileptic
activity in EEG signals we have 3 different states
(healthy, interictal and ictal) and significant results are
obtained. The value of ApEn can be used to distinguish
the different EEG state. According to ApEn analysis
features of EEG and their sub-bands show acceptable
performances in our approach. Our extracted feature can
be useful and applicable for automatic detection of brain
diseases such as epilepsy. The approaches of using ApEn
combined with wavelet analysis suggest new idea and
method for detecting the features of epileptic activities in
EEG signal.
This method also can be used for other non-stationary
signals and other approach. Because the speed of this
method is high enough, we can use this method for
real-time non-stationary signals.
REFERENCES
[1] Subasi, A. and Erçelebi, E. (2005) Classification of EEG
signals using neural network and logistic regression.
Computer Methods and Programs in Biomedicine, 78,
87-99.
[2] Sakkalis, V. and Doru Giurc˘aneanu, C. (2009) Assess-
ment of linear and nonlinear synchronization measures
for analyzing EEG in a mild epileptic paradigm. IEEE
Transaction on Information Technology in Biomedicine,
13, 433-441.
[3] Adeli, H., Ghosh-Dastidar, S. and Dadmehr, N. (2007) A
wavelet-chaos methodology for analysis of EEGs and EEG
sub-bands to detect seizure and epilepsy. IEEE Transac-
tions on Biomedical Engineering, 54, 205-211.
[4] Firpi, H., Goodman, E.D. and Echauz, J. (2007) Epileptic
seizure detection using genetically programmed artificial
features. IEEE Transactions on Biomedical Engineering,
54, 212-224.
[5] Babloyantz, A. and Destexhe, A. (1986) Low-dimen-
sional chaos in an instance of epilepsy. Proceedings of
the National Academy of Science (USA), 83, 3513-3517.
[6] Lai, Y.-C., Osorio, I., Harrison, M.A.F. and Frei M.G.
(2002) Correlation-dimension and autocorrelation fluc-
tuations in epileptic seizure dynamics. Journal of Ameri-
can Physical Society, 65, 1-5.
[7] Natarajan, K., Acharya, R., Alias, F., Tiboleng, T. and
Puthusserypady, S.K. (2004) Nonlinear analysis of EEG
signals at different mental states. BioMedical Engineer-
ing, 3, 1-11.
[8] Ghosh-Dastidar, S., Adeli, H. and Dadmehr, N. (2007)
Mixed-band wavelet-chaos-neural network methodology
for epilepsy and epileptic seizure detection. IEEE Trans-
actions on Biomedical Engineering, 54, 1545-1551.
[9] Bibian, S., ZlKov, T., Dumont, G.A. Ries, C.R. Puil, E.,
Ahmad, H., Huzmeza’N, M. and Macleod, B.A. (2001)
Estimation the Anesthetic depth using wavelet analysis of
electroencephalogeram. Proceedings of the 23rd Annual
EMBS International Conference. Istanbul, Turkey, Octo-
ber 2001, 951-955.
[10] Kumar, S.P., Sriraam, N. and Benakop, P.G. (2008) Auto-
mated detection of epileptic seizures using wavelet en-
tropy feature with recurrent neural network classifier.
IEEE Region 10 Conference, Heyderabad, 1-5.
[11] Kannathalab, N., Choob, M.L., Acharyab, U.R. and Sa-
dasivana, P.K. (2005) Entropies for detection of epilepsy
in EEG. Computer Methods and Programs in Biomedi-
cine, 80, 187-194.
[12] Bruhn, J., Lehmann, L.E., Röpcke, H., Bouillon T.W. and
Hoeft A. (2001) Shannon entropy applied to the meas-
urement of the lector encephalographic effects of desflu-
rane. American Society of Anesthesiologists Jurnal, 95,
Copyright © 2010 SciRes. JBiSE