 International Journal of Medical Physics, Clinical Engineering and Radiation Oncology, 2013, 2, 98-109 http://dx.doi.org/10.4236/ijmpcero.2013.23014 Published Online August 2013 (http://www.scirp.org/journal/ijmpcero) Performance of Large Area Thin-Film CdTe Detector in Diagnostic X-Ray Imaging Diana Shvydka1, Xiance Jin1,2, E. Ishmael Parsai1 1Department of Radiation Oncology, University of Toledo, Toledo, USA 2Department of Radiotherapy and Chemotherapy, Wenzhou Medical University, Wenzhou, China Email: E.Parsai@utoloedo.edu Received April 5, 2013; revised May 20, 2013; accepted June 22, 2013 Copyright © 2013 Diana Shvydka et al. This is an open access article distributed under the Creative Commons Attribution License, which permits unrestricted use, distribution, and reproduction in any medium, provided the original work is properly cited. ABSTRACT Significant advancement in thin-film cadmium telluride (CdTe) deposition techniques in recent years has made this material attractive for the development of low-cost large area detector. Here we evaluate the intrinsic performance of the detector for a range of energies relevant to diagnostic imaging applications, such as fluoroscopy. The input x-ray spectra for a set of tube potentials ranging from 70 to 140 kVp were computed with the tungsten anode spectral model using interpolating polynomials (TASMIP) based on the measured output of our diagnostic x-ray simulator. Fre- quency-dependent detector performance analysis was conducted through Monte Carlo simulations of energy deposition within the detector. Intrinsic modulation transfer functions (MTF), noise power spectra (NPS), and detective quantum efficiencies (DQE) were computed for a set of CdTe detectors of varying thickness, from 100 to 1000 μm. MTF behav- ior at higher frequencies was affected by thickness and input energy, NPS increased with film thickness and energy, and the resultant DQE(f) decreased with increasing the input energy, but increased with the thickness of the detector. We found that the optimal thickness of CdTe under diagnostic x-ray beam is in the range of 300 to 600 μm. Physical prop- erties of CdTe, such as the high atomic number and density, used in direct detection configuration, together with the recently established thin-film manufacturing techniques makes this technology a promising photoconductor for large- area diagnostic flat panel imaging. Keywords: Monte Carlo; CdTe Detector; Photovoltaic; Thin Film; TASMIP; DQE; X-Ray Imaging 1. Introduction Introduction of digital radiography systems and succes- sive use of flat panel detectors revolutionized the field of diagnostic imaging. Wide dynamic range, high image quality, real-time image acquisition and processing, pre- cise image recording, and ease of remote access are among the most prominent improvements. One of the decisive factors contributing to further advancements re- mains the continuous development of different x-ray de- tecting materials, from traditional phosphor screens in combination with secondary photodetectors for indirect detection to use of thin-film photoconductors in direct detection systems. The latter approach offers a twofold benefit: simpler device structure resulting in lower manu- facturing cost, and a high potential of providing images of superior contrast and sharpness due to inherently low signal spreading within the detector. In the direct detection approach x-rays are absorbed by a photoconductor layer and converted to electron-hole pairs, which are then collected as electric charges on storage capacitors. Up to now amorphous selenium (a-Se) is the only photoconductor developed into direct detec- tion type commercial medical imagers, for both general radiography and mammography applications [1-4]. De- tectors are based on a-Se offer superior spatial resolution due to the simple conversion process. However, low x- ray absorption and high effective ionization energy (~50 eV) result in inadequate sensitivity, especially important for low exposure levels of fluoroscopic mode [5]. To overcome this problem, materials of high atomic numbers and densities, such as mercuric iodide (HgI2), lead iodide (PbI2) [6-11], lead oxide (PbO) [12], thallium bromide (TlBr) [13], and cadmium telluride/cadmium zinc telluride (CdTe/CdZnTe) [14-17], have been sug- gested to replace a-Se. All of these materials possess effective ionization energy about 10 times lower than that of a-Se, substantially large band gaps, necessary for minimization of leakage currents at room temperature, and high mobility-lifetime product, providing effective C opyright © 2013 SciRes. IJMPCERO 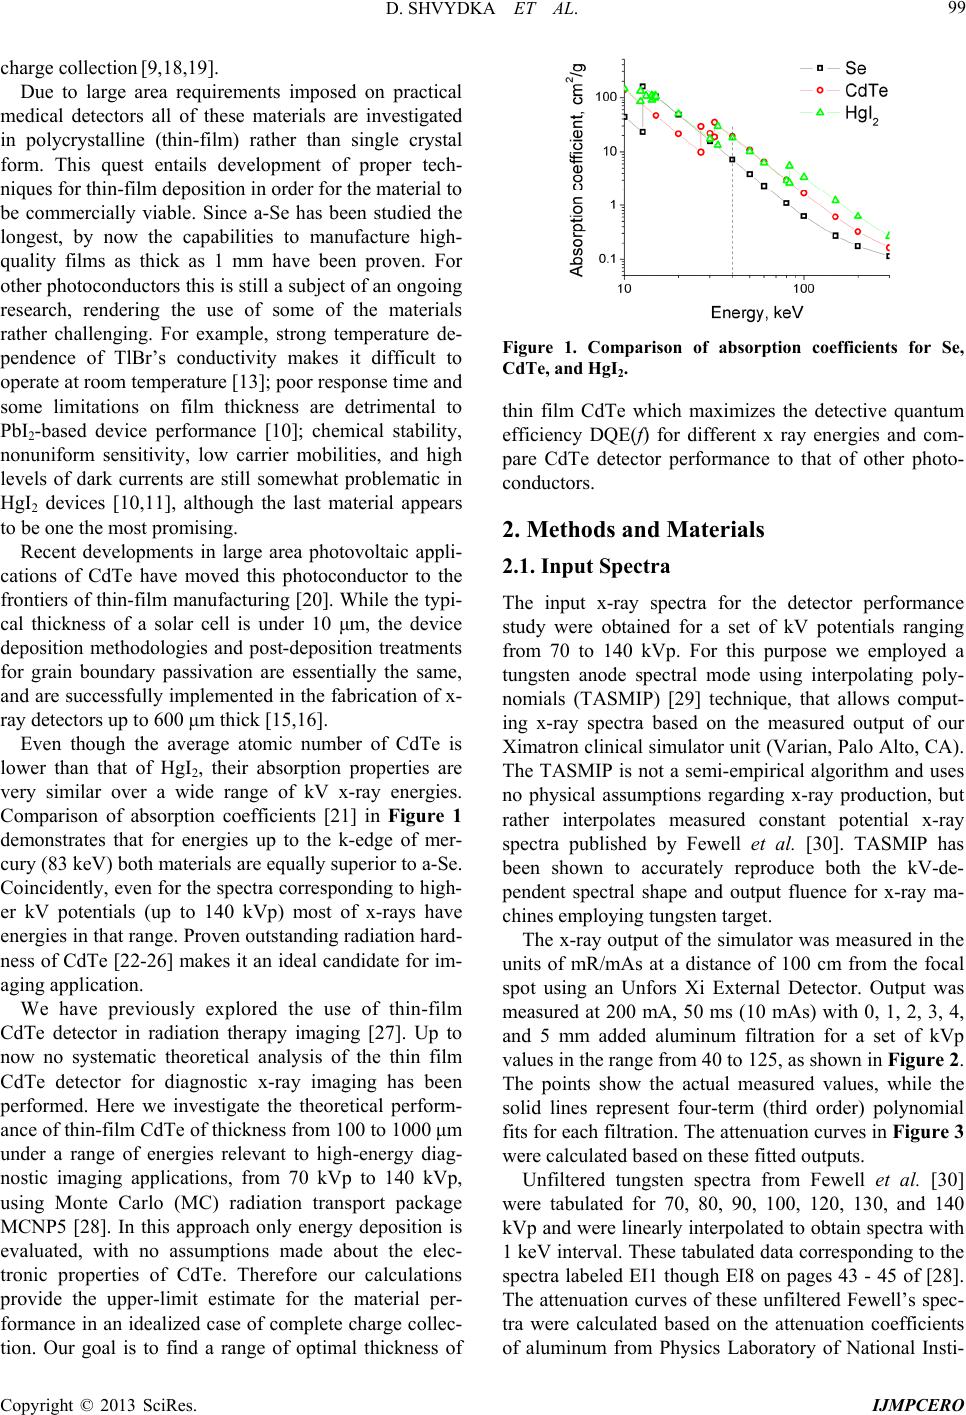 D. SHVYDKA ET AL. 99 charge collection [9,18,19]. Due to large area requirements imposed on practical medical detectors all of these materials are investigated in polycrystalline (thin-film) rather than single crystal form. This quest entails development of proper tech- niques for thin-film deposition in order for the material to be commercially viable. Since a-Se has been studied the longest, by now the capabilities to manufacture high- quality films as thick as 1 mm have been proven. For other photoconductors this is still a subject of an ongoing research, rendering the use of some of the materials rather challenging. For example, strong temperature de- pendence of TlBr’s conductivity makes it difficult to operate at room temperature [13]; poor response time and some limitations on film thickness are detrimental to PbI2-based device performance [10]; chemical stability, nonuniform sensitivity, low carrier mobilities, and high levels of dark currents are still somewhat problematic in HgI2 devices [10,11], although the last material appears to be one the most promising. Recent developments in large area photovoltaic appli- cations of CdTe have moved this photoconductor to the frontiers of thin-film manufacturing [20]. While the typi- cal thickness of a solar cell is under 10 μm, the device deposition methodologies and post-deposition treatments for grain boundary passivation are essentially the same, and are successfully implemented in the fabrication of x- ray detectors up to 600 μm thick [15,16]. Even though the average atomic number of CdTe is lower than that of HgI2, their absorption properties are very similar over a wide range of kV x-ray energies. Comparison of absorption coefficients [21] in Figure 1 demonstrates that for energies up to the k-edge of mer- cury (83 keV) both materials are equally superior to a-Se. Coincidently, even for the spectra corresponding to high- er kV potentials (up to 140 kVp) most of x-rays have energies in that range. Proven outstanding radiation hard- ness of CdTe [22-26] makes it an ideal candidate for im- aging application. We have previously explored the use of thin-film CdTe detector in radiation therapy imaging [27]. Up to now no systematic theoretical analysis of the thin film CdTe detector for diagnostic x-ray imaging has been performed. Here we investigate the theoretical perform- ance of thin-film CdTe of thickness from 100 to 1000 μm under a range of energies relevant to high-energy diag- nostic imaging applications, from 70 kVp to 140 kVp, using Monte Carlo (MC) radiation transport package MCNP5 [28]. In this approach only energy deposition is evaluated, with no assumptions made about the elec- tronic properties of CdTe. Therefore our calculations provide the upper-limit estimate for the material per- formance in an idealized case of complete charge collec- tion. Our goal is to find a range of optimal thickness of Figure 1. Comparison of absorption coefficients for Se, CdTe, and HgI2. thin film CdTe which maximizes the detective quantum efficiency DQE(f) for different x ray energies and com- pare CdTe detector performance to that of other photo- conductors. 2. Methods and Materials 2.1. Input Spectra The input x-ray spectra for the detector performance study were obtained for a set of kV potentials ranging from 70 to 140 kVp. For this purpose we employed a tungsten anode spectral mode using interpolating poly- nomials (TASMIP) [29] technique, that allows comput- ing x-ray spectra based on the measured output of our Ximatron clinical simulator unit (Varian, Palo Alto, CA). The TASMIP is not a semi-empirical algorithm and uses no physical assumptions regarding x-ray production, but rather interpolates measured constant potential x-ray spectra published by Fewell et al. [30]. TASMIP has been shown to accurately reproduce both the kV-de- pendent spectral shape and output fluence for x-ray ma- chines employing tungsten target. The x-ray output of the simulator was measured in the units of mR/mAs at a distance of 100 cm from the focal spot using an Unfors Xi External Detector. Output was measured at 200 mA, 50 ms (10 mAs) with 0, 1, 2, 3, 4, and 5 mm added aluminum filtration for a set of kVp values in the range from 40 to 125, as shown in Figure 2. The points show the actual measured values, while the solid lines represent four-term (third order) polynomial fits for each filtration. The attenuation curves in Figure 3 were calculated based on these fitted outputs. Unfiltered tungsten spectra from Fewell et al. [30] were tabulated for 70, 80, 90, 100, 120, 130, and 140 kVp and were linearly interpolated to obtain spectra with 1 keV interval. These tabulated data corresponding to the spectra labeled EI1 though EI8 on pages 43 - 45 of [28]. The attenuation curves of these unfiltered Fewell’s spec- tra were calculated based on the attenuation coefficients of aluminum from Physics Laboratory of National Insti- Copyright © 2013 SciRes. IJMPCERO 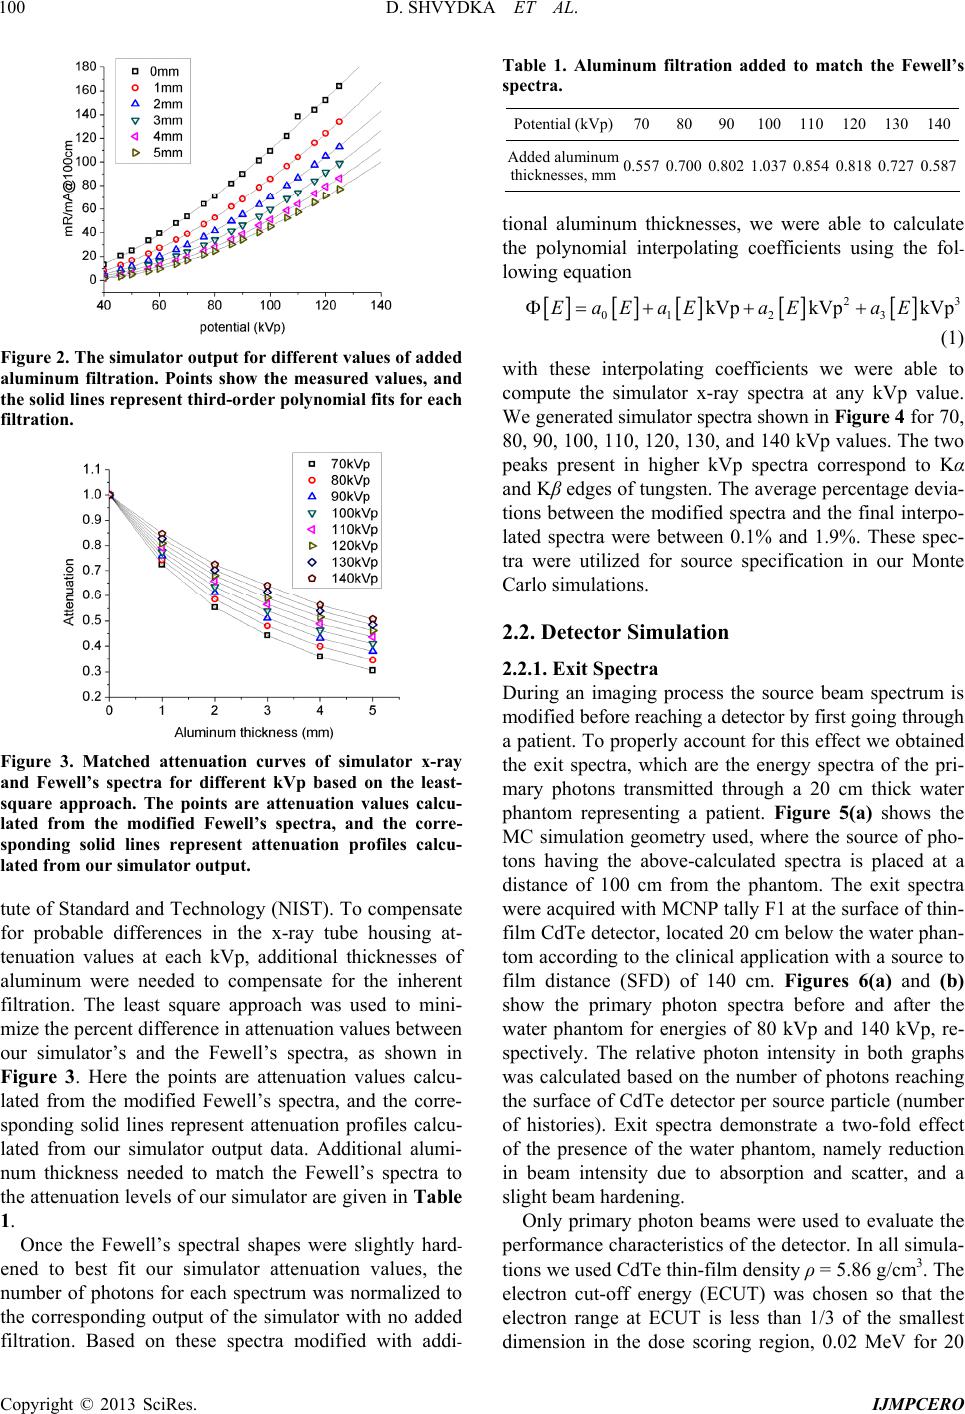 D. SHVYDKA ET AL. 100 Figure 2. The simulator output for different values of added aluminum filtration. Points show the measured values, and the solid lines represent third-order polynomial fits for each filtration. Figure 3. Matched attenuation curves of simulator x-ray and Fewell’s spectra for different kVp based on the least- square approach. The points are attenuation values calcu- lated from the modified Fewell’s spectra, and the corre- sponding solid lines represent attenuation profiles calcu- lated from our simulator output. tute of Standard and Technology (NIST). To compensate for probable differences in the x-ray tube housing at- tenuation values at each kVp, additional thicknesses of aluminum were needed to compensate for the inherent filtration. The least square approach was used to mini- mize the percent difference in attenuation values between our simulator’s and the Fewell’s spectra, as shown in Figure 3. Here the points are attenuation values calcu- lated from the modified Fewell’s spectra, and the corre- sponding solid lines represent attenuation profiles calcu- lated from our simulator output data. Additional alumi- num thickness needed to match the Fewell’s spectra to the attenuation levels of our simulator are given in Table 1. Once the Fewell’s spectral shapes were slightly hard- ened to best fit our simulator attenuation values, the number of photons for each spectrum was normalized to the corresponding output of the simulator with no added filtration. Based on these spectra modified with addi- Table 1. Aluminum filtration added to match the Fewell’s spectra. Potential (kVp)708090 100 110 120 130140 Added aluminum thicknesses, mm0.557 0.700 0.802 1.037 0.854 0.818 0.727 0.587 tional aluminum thicknesses, we were able to calculate the polynomial interpolating coefficients using the fol- lowing equation 23 01 23 kVp kVpkVpEaEaE aEaE (1) with these interpolating coefficients we were able to compute the simulator x-ray spectra at any kVp value. We generated simulator spectra shown in Figure 4 for 70, 80, 90, 100, 110, 120, 130, and 140 kVp values. The two peaks present in higher kVp spectra correspond to Kα and Kβ edges of tungsten. The average percentage devia- tions between the modified spectra and the final interpo- lated spectra were between 0.1% and 1.9%. These spec- tra were utilized for source specification in our Monte Carlo simulations. 2.2. Detector Simulation 2.2.1. Exit Spectra During an imaging process the source beam spectrum is modified before reaching a detector by first going through a patient. To properly account for this effect we obtained the exit spectra, which are the energy spectra of the pri- mary photons transmitted through a 20 cm thick water phantom representing a patient. Figure 5(a) shows the MC simulation geometry used, where the source of pho- tons having the above-calculated spectra is placed at a distance of 100 cm from the phantom. The exit spectra were acquired with MCNP tally F1 at the surface of thin- film CdTe detector, located 20 cm below the water phan- tom according to the clinical application with a source to film distance (SFD) of 140 cm. Figures 6(a) and (b) show the primary photon spectra before and after the water phantom for energies of 80 kVp and 140 kVp, re- spectively. The relative photon intensity in both graphs was calculated based on the number of photons reaching the surface of CdTe detector per source particle (number of histories). Exit spectra demonstrate a two-fold effect of the presence of the water phantom, namely reduction in beam intensity due to absorption and scatter, and a slight beam hardening. Only primary photon beams were used to evaluate the performance characteristics of the detector. In all simula- tions we used CdTe thin-film density ρ = 5.86 g/cm3. The electron cut-off energy (ECUT) was chosen so that the electron range at ECUT is less than 1/3 of the smallest dimension in the dose scoring region, 0.02 MeV for 20 Copyright © 2013 SciRes. IJMPCERO 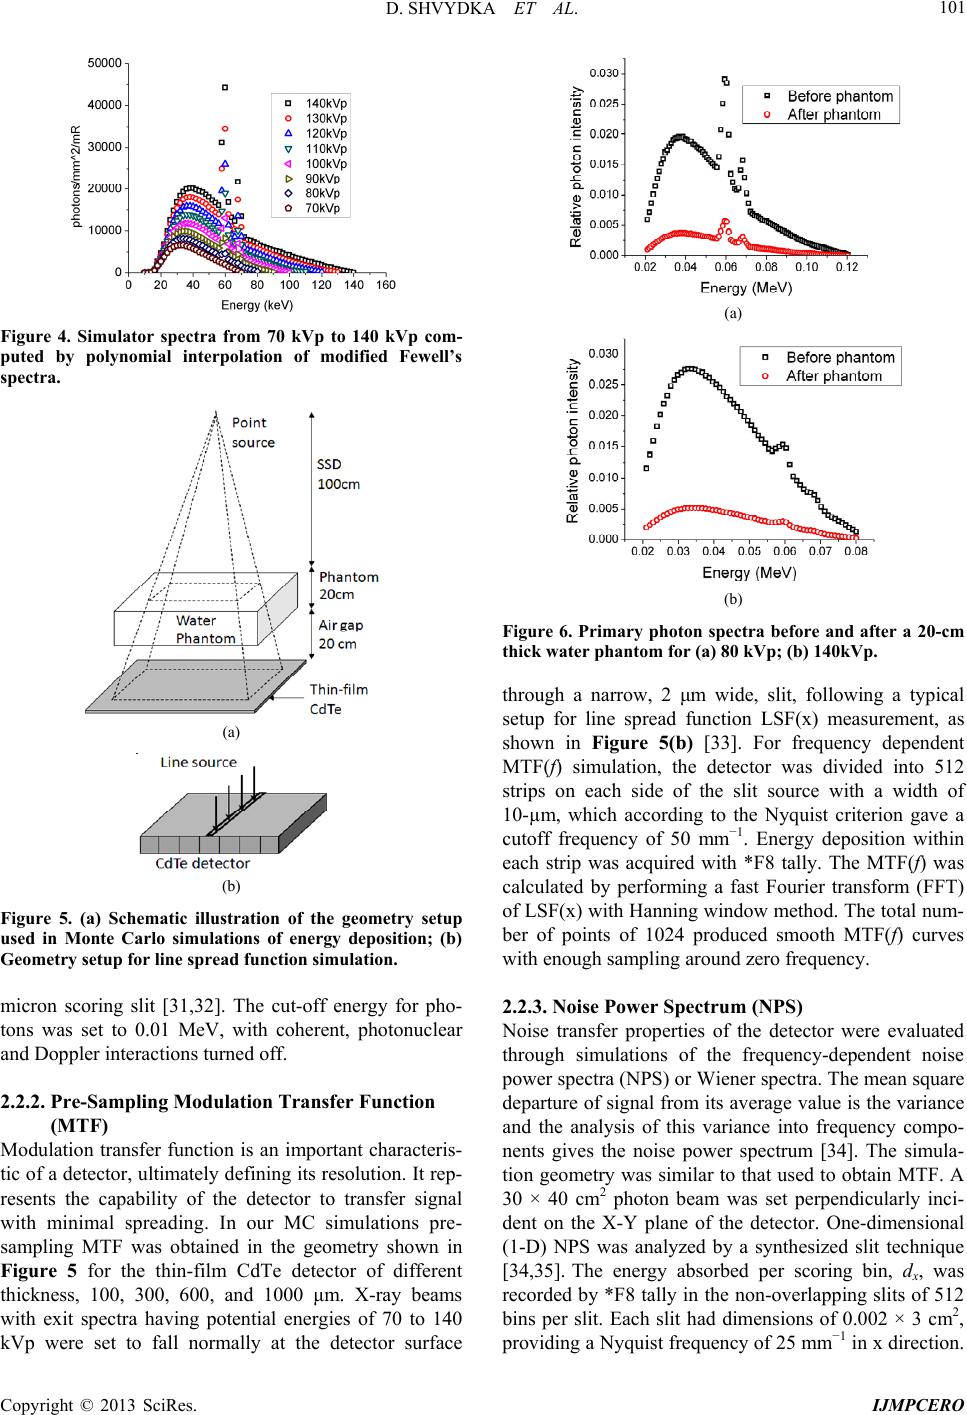 D. SHVYDKA ET AL. 101 Figure 4. Simulator spectra from 70 kVp to 140 kVp com- puted by polynomial interpolation of modified Fewell’s spectra. (a) (b) Figure 5. (a) Schematic illustration of the geometry setup used in Monte Carlo simulations of energy deposition; (b) Geometry setup for line spread function simulation. micron scoring slit [31,32]. The cut-off energy for pho- tons was set to 0.01 MeV, with coherent, photonuclear and Doppler interactions turned off. 2.2.2. Pre-Sampling Modulation Transfer Function (MTF) Modulation transfer function is an important characteris- tic of a detector, ultimately defining its resolution. It rep- resents the capability of the detector to transfer signal with minimal spreading. In our MC simulations pre- sampling MTF was obtained in the geometry shown in Figure 5 for the thin-film CdTe detector of different thickness, 100, 300, 600, and 1000 μm. X-ray beams with exit spectra having potential energies of 70 to 140 kVp were set to fall normally at the detector surface (a) (b) Figure 6. Primary photon spectra before and after a 20-cm thick water phantom for (a) 80 kVp; (b) 140kVp. through a narrow, 2 μm wide, slit, following a typical setup for line spread function LSF(x) measurement, as shown in Figure 5(b) [33]. For frequency dependent MTF(f) simulation, the detector was divided into 512 strips on each side of the slit source with a width of 10-µm, which according to the Nyquist criterion gave a cutoff frequency of 50 mm−1. Energy deposition within each strip was acquired with *F8 tally. The MTF(f) was calculated by performing a fast Fourier transform (FFT) of LSF(x) with Hanning window method. The total num- ber of points of 1024 produced smooth MTF(f) curves with enough sampling around zero frequency. 2.2.3. Noise Power Spectrum (NPS) Noise transfer properties of the detector were evaluated through simulations of the frequency-dependent noise power spectra (NPS) or Wiener spectra. The mean square departure of signal from its average value is the variance and the analysis of this variance into frequency compo- nents gives the noise power spectrum [34]. The simula- tion geometry was similar to that used to obtain MTF. A 30 × 40 cm2 photon beam was set perpendicularly inci- dent on the X-Y plane of the detector. One-dimensional (1-D) NPS was analyzed by a synthesized slit technique [34,35]. The energy absorbed per scoring bin, dx, was recorded by *F8 tally in the non-overlapping slits of 512 bins per slit. Each slit had dimensions of 0.002 × 3 cm2, providing a Nyquist frequency of 25 mm−1 in x direction. Copyright © 2013 SciRes. IJMPCERO 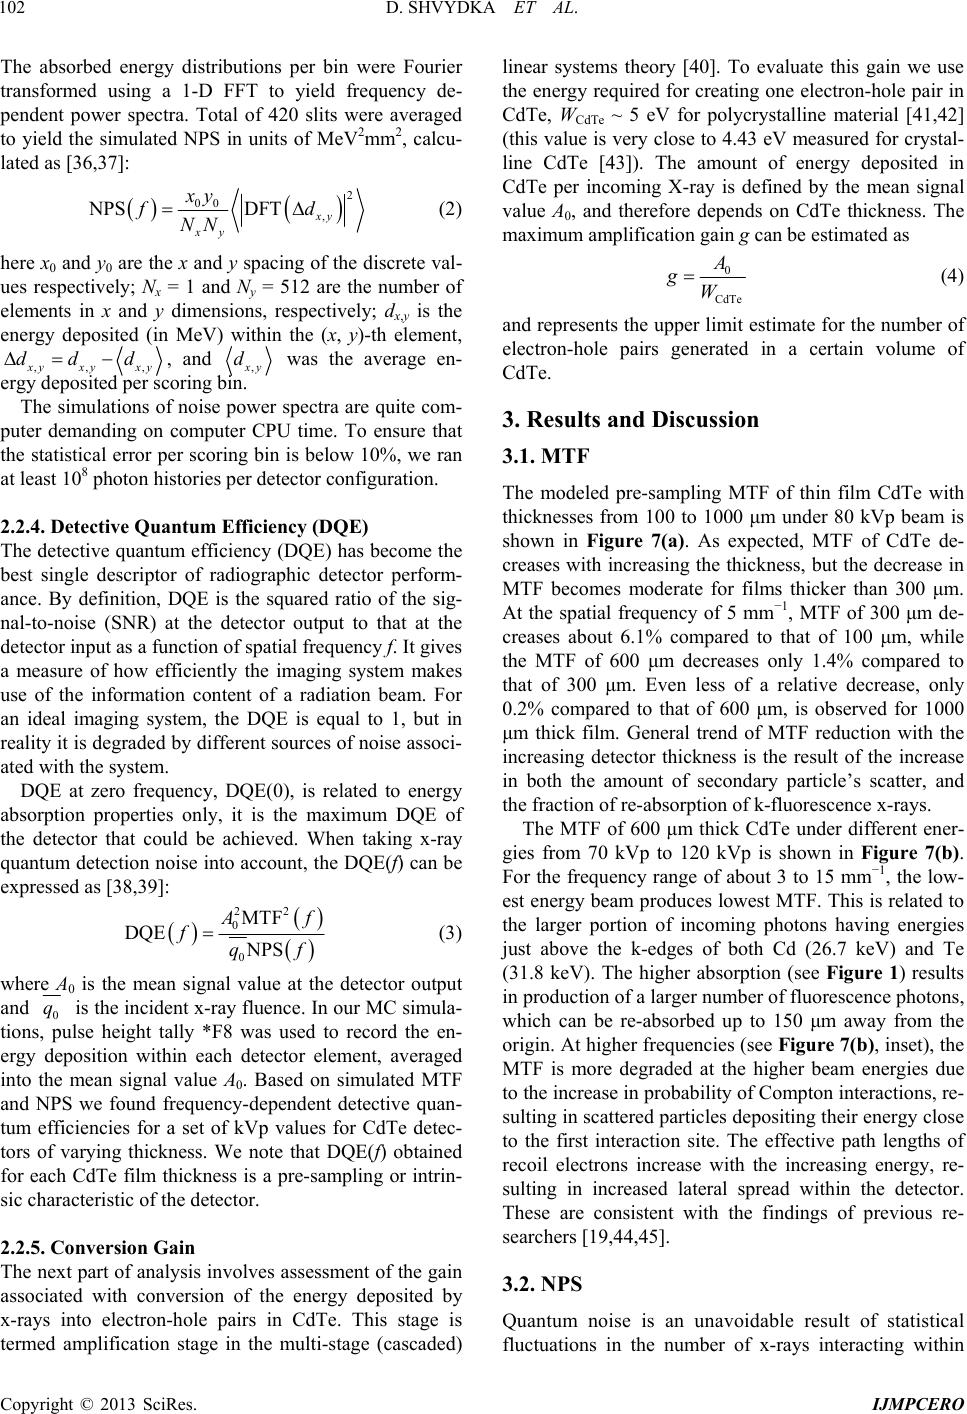 D. SHVYDKA ET AL. 102 The absorbed energy distributions per bin were Fourier transformed using a 1-D FFT to yield frequency de- pendent power spectra. Total of 420 slits were averaged to yield the simulated NPS in units of MeV2mm2, calcu- lated as [36,37]: 2 00 , NPSDFT xy xy xy f NN d (2) here x0 and y0 are the x and y spacing of the discrete val- ues respectively; Nx = 1 and Ny = 512 are the number of elements in x and y dimensions, respectively; dx,y is the energy deposited (in MeV) within the (x, y)-th element, ,, , yxy xy dd d , and , y d was the average en- ergy deposited per scoring bin. The simulations of noise power spectra are quite com- puter demanding on computer CPU time. To ensure that the statistical error per scoring bin is below 10%, we ran at least 108 photon histories per detector configuration. 2.2.4. Detective Quantum Efficiency (DQE) The detective quantum efficiency (DQE) has become the best single descriptor of radiographic detector perform- ance. By definition, DQE is the squared ratio of the sig- nal-to-noise (SNR) at the detector output to that at the detector input as a function of spatial frequency f. It gives a measure of how efficiently the imaging system makes use of the information content of a radiation beam. For an ideal imaging system, the DQE is equal to 1, but in reality it is degraded by different sources of noise associ- ated with the system. DQE at zero frequency, DQE(0), is related to energy absorption properties only, it is the maximum DQE of the detector that could be achieved. When taking x-ray quantum detection noise into account, the DQE(f) can be expressed as [38,39]: 22 0 0 MTF DQE NPS f fqf (3) where A0 is the mean signal value at the detector output and 0 q is the incident x-ray fluence. In our MC simula- tions, pulse height tally *F8 was used to record the en- ergy deposition within each detector element, averaged into the mean signal value A0. Based on simulated MTF and NPS we found frequency-dependent detective quan- tum efficiencies for a set of kVp values for CdTe detec- tors of varying thickness. We note that DQE(f) obtained for each CdTe film thickness is a pre-sampling or intrin- sic characteristic of the detector. 2.2.5. Conversion Gain The next part of analysis involves assessment of the gain associated with conversion of the energy deposited by x-rays into electron-hole pairs in CdTe. This stage is termed amplification stage in the multi-stage (cascaded) linear systems theory [40]. To evaluate this gain we use the energy required for creating one electron-hole pair in CdTe, WCdTe ~ 5 eV for polycrystalline material [41,42] (this value is very close to 4.43 eV measured for crystal- line CdTe [43]). The amount of energy deposited in CdTe per incoming X-ray is defined by the mean signal value A0, and therefore depends on CdTe thickness. The maximum amplification gain g can be estimated as 0 CdTe gW (4) and represents the upper limit estimate for the number of electron-hole pairs generated in a certain volume of CdTe. 3. Results and Discussion 3.1. MTF The modeled pre-sampling MTF of thin film CdTe with thicknesses from 100 to 1000 μm under 80 kVp beam is shown in Figure 7(a). As expected, MTF of CdTe de- creases with increasing the thickness, but the decrease in MTF becomes moderate for films thicker than 300 μm. At the spatial frequency of 5 mm−1, MTF of 300 μm de- creases about 6.1% compared to that of 100 μm, while the MTF of 600 μm decreases only 1.4% compared to that of 300 μm. Even less of a relative decrease, only 0.2% compared to that of 600 μm, is observed for 1000 μm thick film. General trend of MTF reduction with the increasing detector thickness is the result of the increase in both the amount of secondary particle’s scatter, and the fraction of re-absorption of k-fluorescence x-rays. The MTF of 600 μm thick CdTe under different ener- gies from 70 kVp to 120 kVp is shown in Figure 7(b). For the frequency range of about 3 to 15 mm−1, the low- est energy beam produces lowest MTF. This is related to the larger portion of incoming photons having energies just above the k-edges of both Cd (26.7 keV) and Te (31.8 keV). The higher absorption (see Figure 1) results in production of a larger number of fluorescence photons, which can be re-absorbed up to 150 μm away from the origin. At higher frequencies (see Figure 7(b), inset), the MTF is more degraded at the higher beam energies due to the increase in probability of Compton interactions, re- sulting in scattered particles depositing their energy close to the first interaction site. The effective path lengths of recoil electrons increase with the increasing energy, re- sulting in increased lateral spread within the detector. These are consistent with the findings of previous re- searchers [19,44,45]. 3.2. NPS Quantum noise is an unavoidable result of statistical fluctuations in the number of x-rays interacting within Copyright © 2013 SciRes. IJMPCERO 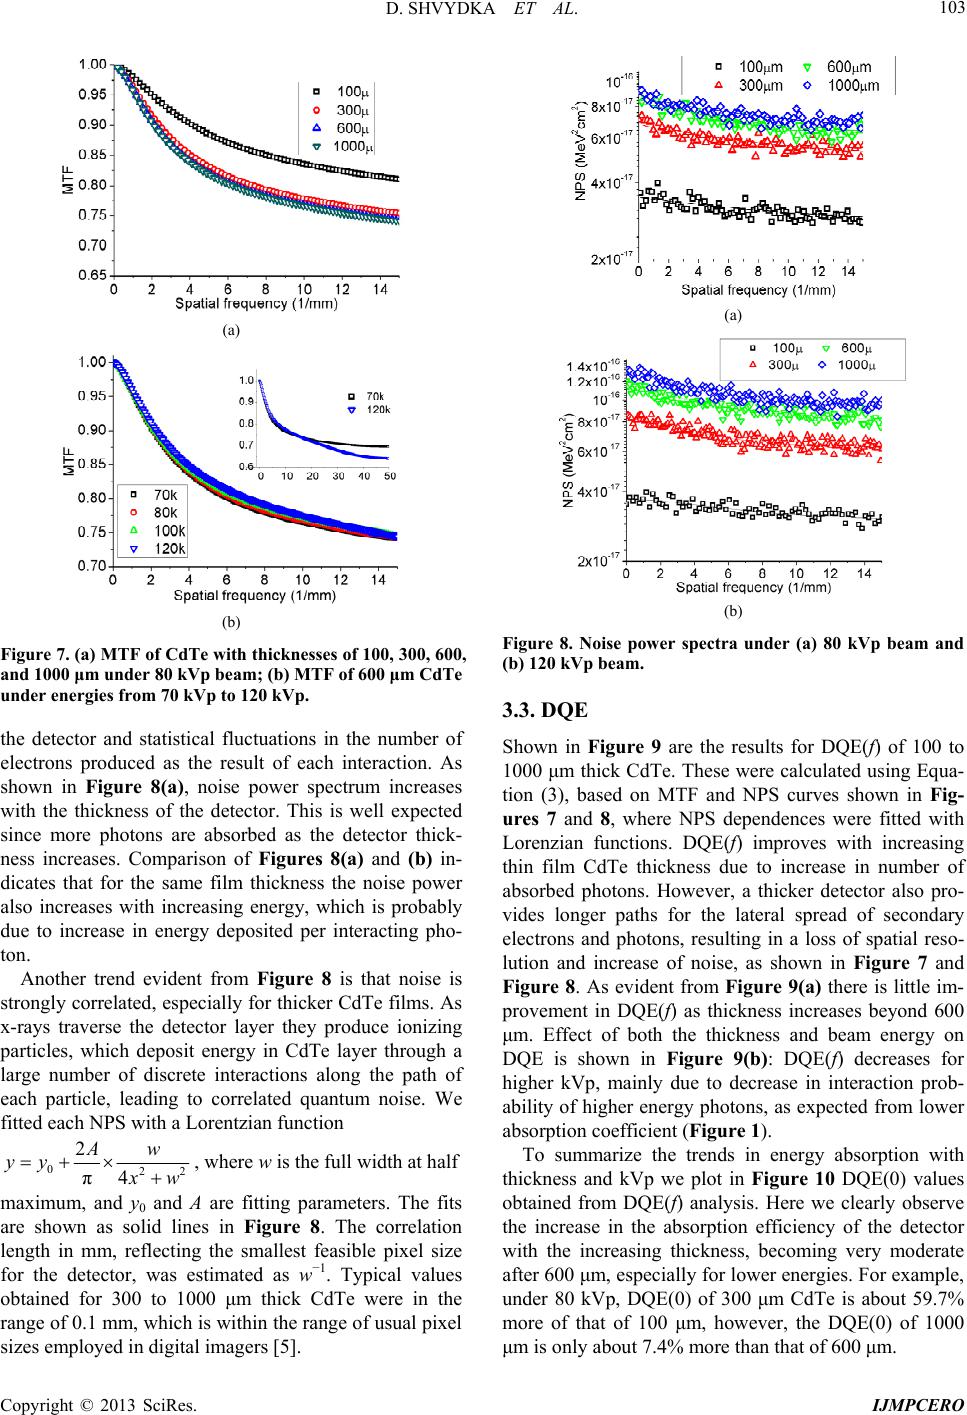 D. SHVYDKA ET AL. 103 (a) (b) Figure 7. (a) MTF of CdTe with thicknesses of 100, 300, 600, and 1000 μm under 80 kVp beam; (b) MTF of 600 μm CdTe under energies from 70 kVp to 120 kVp. the detector and statistical fluctuations in the number of electrons produced as the result of each interaction. As shown in Figure 8(a), noise power spectrum increases with the thickness of the detector. This is well expected since more photons are absorbed as the detector thick- ness increases. Comparison of Figures 8(a) and (b) in- dicates that for the same film thickness the noise power also increases with increasing energy, which is probably due to increase in energy deposited per interacting pho- ton. Another trend evident from Figure 8 is that noise is strongly correlated, especially for thicker CdTe films. As x-rays traverse the detector layer they produce ionizing particles, which deposit energy in CdTe layer through a large number of discrete interactions along the path of each particle, leading to correlated quantum noise. We fitted each NPS with a Lorentzian function 02 2 π4 Aw yy 2 w , where w is the full width at half maximum, and y 0 and A are fitting parameters. The fits are shown as solid lines in Figure 8. The correlation length in mm, reflecting the smallest feasible pixel size for the detector, was estimated as w−1. Typical values obtained for 300 to 1000 μm thick CdTe were in the range of 0.1 mm, which is within the range of usual pixel sizes employed in digital imagers [5]. (a) (b) Figure 8. Noise power spectra under (a) 80 kVp beam and (b) 120 kVp beam. 3.3. DQE Shown in Figure 9 are the results for DQE(f) of 100 to 1000 μm thick CdTe. These were calculated using Equa- tion (3), based on MTF and NPS curves shown in Fig- ures 7 and 8, where NPS dependences were fitted with Lorenzian functions. DQE(f) improves with increasing thin film CdTe thickness due to increase in number of absorbed photons. However, a thicker detector also pro- vides longer paths for the lateral spread of secondary electrons and photons, resulting in a loss of spatial reso- lution and increase of noise, as shown in Figure 7 and Figure 8. As evident from Figure 9(a) there is little im- provement in DQE(f) as thickness increases beyond 600 μm. Effect of both the thickness and beam energy on DQE is shown in Figure 9(b): DQE(f) decreases for higher kVp, mainly due to decrease in interaction prob- ability of higher energy photons, as expected from lower absorption coefficient (Figure 1). To summarize the trends in energy absorption with thickness and kVp we plot in Figure 10 DQE(0) values obtained from DQE(f) analysis. Here we clearly observe the increase in the absorption efficiency of the detector with the increasing thickness, becoming very moderate after 600 μm, especially for lower energies. For example, under 80 kVp, DQE(0) of 300 μm CdTe is about 59.7% more of that of 100 μm, however, the DQE(0) of 1000 μm is only about 7.4% more than that of 600 μm. Copyright © 2013 SciRes. IJMPCERO 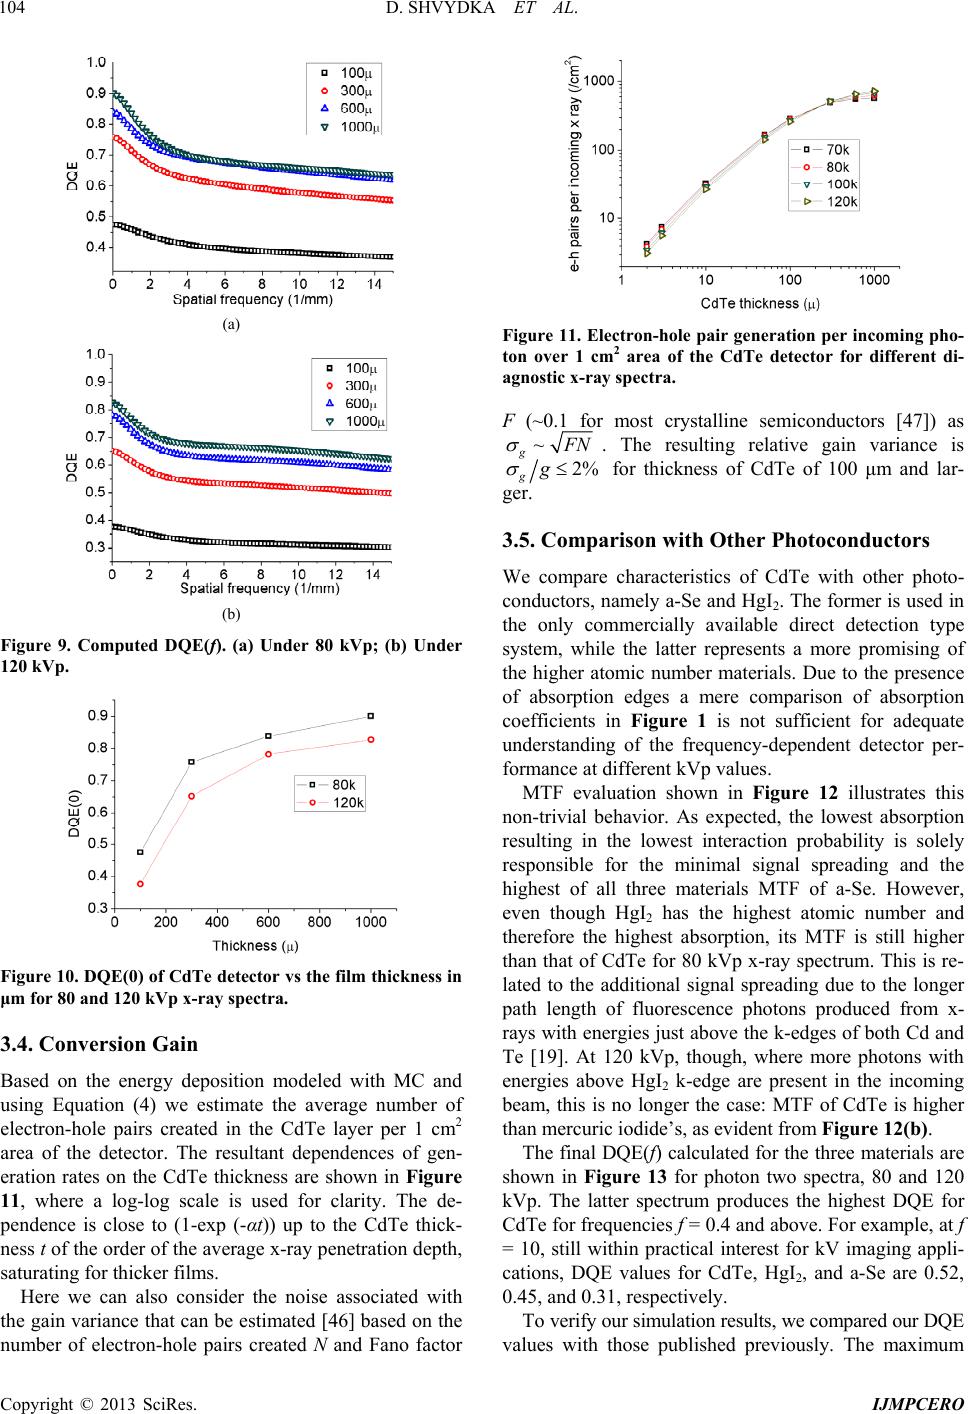 D. SHVYDKA ET AL. 104 (a) (b) Figure 9. Computed DQE(f). (a) Under 80 kVp; (b) Under 120 kVp. Figure 10. DQE(0) of CdTe detector vs the film thickness in μmfor 80 and 120 kVp x-ray spectra. 3.4. Conversion Gain Based on the energy deposition modeled with MC and using Equation (4) we estimate the average number of electron-hole pairs created in the CdTe layer per 1 cm2 area of the detector. The resultant dependences of gen- eration rates on the CdTe thickness are shown in Figure 11, where a log-log scale is used for clarity. The de- pendence is close to (1-exp (-αt)) up to the CdTe thick- ness t of the order of the average x-ray penetration depth, saturating for thicker films. Here we can also consider the noise associated with the gain variance that can be estimated [46] based on the number of electron-hole pairs created N and Fano factor Figure 11. Electron-hole pair generation per incoming pho- ton over 1 cm2 area of the CdTe detector for different di- agnostic x-ray spectra. F (~0.1 for most crystalline semiconductors [47]) as ~ g N . The resulting relative gain variance is 2% gg for thickness of CdTe of 100 μm and lar- ger. 3.5. Comparison with Other Photoconductors We compare characteristics of CdTe with other photo- conductors, namely a-Se and HgI2. The former is used in the only commercially available direct detection type system, while the latter represents a more promising of the higher atomic number materials. Due to the presence of absorption edges a mere comparison of absorption coefficients in Figure 1 is not sufficient for adequate understanding of the frequency-dependent detector per- formance at different kVp values. MTF evaluation shown in Figure 12 illustrates this non-trivial behavior. As expected, the lowest absorption resulting in the lowest interaction probability is solely responsible for the minimal signal spreading and the highest of all three materials MTF of a-Se. However, even though HgI2 has the highest atomic number and therefore the highest absorption, its MTF is still higher than that of CdTe for 80 kVp x-ray spectrum. This is re- lated to the additional signal spreading due to the longer path length of fluorescence photons produced from x- rays with energies just above the k-edges of both Cd and Te [19]. At 120 kVp, though, where more photons with energies above HgI2 k-edge are present in the incoming beam, this is no longer the case: MTF of CdTe is higher than mercuric iodide’s, as evident from Figure 12(b). The final DQE(f) calculated for the three materials are shown in Figure 13 for photon two spectra, 80 and 120 kVp. The latter spectrum produces the highest DQE for CdTe for frequencies f = 0.4 and above. For example, at f = 10, still within practical interest for kV imaging appli- cations, DQE values for CdTe, HgI2, and a-Se are 0.52, 0.45, and 0.31, respectively. To verify our simulation results, we compared our DQE values with those published previously. The maximum Copyright © 2013 SciRes. IJMPCERO  D. SHVYDKA ET AL. 105 (a) (b) Figure 12. MTF of three photoconductors with thickness of 300 μm. (a) Under 80 kVp beam; (b) Under 120 kVp beam. (a) (b) Figure 13. DQE(f) of three photoconductors with thickness of 300 μm. (a) Under 80 kVp beam; (b) Under 120 kVp beam. measured DQE value of 0.7 for 350 μm thick CdZnTe was obtained in the study of S. Tokuda, et al. [17] for 70 kVp beam. This is close to calculated in this work DQE(0) = 0.76 under similar conditions (80 kVp, 300 μm thickness). The value of DQE(0) for 300 µm thick a-Se under 80 kVp spectrum of our simulation is ~0.53. In the study of Zhao et al. [1], the calculated DQE(0) of 300 µm under a spectrum of 70 kVp is about 0.6 due to the Swank factor and the broad x-ray spectrum using the cascade systems model. These two values are quite close taking into ac- count the differences in calculation approaches and the input spectra. Du et al. [6] studied physical vapor deposi- tion (PVD) polycrystalline HgI2 with thickness range from 210 µm to 300 µm under an x-ray spectrum of 72 kVp. Their theoretical DQE(0) of 210 µm thick HgI2 prototype calculated with cascaded system is about 0.6, taking quantum efficiency and Swank factor into account. This is in agreement with our calculated DQE(0) = 0.78 for 300 µm HgI2 under 80 kVp, taking into account the thickness and spectra differences. While intrinsic imaging properties of HgI2 and CdTe are close, comparison of their electronic properties favors the latter material, whose carrier mobilities are at least an order of magnitude higher [48], making it more attractive for use in radiation detectors. 3.6. Device Operation In order to separate and collect the charged carriers gen- erated in the existing CdTe based radiation detectors, a strong electric field ~103 - 104 V/cm is typically created by application of the external biasing voltage across the sensitive volume of the device. In this approach the value of the noise due to leakage current associated with the application of a large bias (~1000 V for ~1 mm thick device) becomes the primary concern. Additionally, prob- lems of charge trapping and polarization effect specific to crystalline CdTe strongly contribute to drift in the de- tector response. With easier to grow, and typically thinner polycrystal- line semiconductor films, it is possible to utilize a photo- voltaic (PV) mode of operation, where a junction created at the interface of differently doped semiconductors and/ or semiconductor-metal provides the built-in electric field. In the photovoltaic mode the problems related to biasing do not come into play. However, the major diffi- culty arises from incomplete charge collection due to lo- calization of the electric field to a region that can be much shorter than the detector thickness. A number of groups verified the feasibility of x-ray detectors operating in PV mode, including those based on Si [49], CdTe [50,51], and GaAs [52]. In the case of GaAs it was demonstrated that the depletion region can extend over the entire film thickness of 80 μm, resulting Copyright © 2013 SciRes. IJMPCERO  D. SHVYDKA ET AL. 106 in equally efficient charge collection of ~93% for both PV and biased modes of operation. While it is the state of the art GaAs structure with non-uniform doping profile that makes such a field distribution possible, it provides a proof of PV mode concept and points toward the need for a stronger materials science effort in x-ray detector re- search. So far a similar undertaking in polycrystalline CdTe doping yielded detectors with thickness of up to 150 µm achieving full depletion at bias of <1 V [53]. At this time the deposition techniques, material proc- essing, and device engineering approaches for CdTe come mostly from the commercially successful field of polycrystalline thin-film CdTe solar cells. Based on the established results of thin-film photovoltaic applications, the built-in field of ~104 V/cm is induced in the vicinity of CdTe/CdS where the CdS layer can be extremely thin (below 1 micron) and can be neglected from the point of view of charge carrier generation. The electric field re- gion in a much thicker (thin-film) CdTe extends over a few micron depletion width Ld from the metallurgical junction. Assuming, for absorption purposes, CdTe thickness much greater than Ld the arrangement becomes superfi- cially analogous to that of the classical structure of crys- talline silicon p-n junction photovoltaic device, which remains the most established type of commercially avail- able solar cells. In those devices charge carrier genera- tion spans distances orders of magnitude greater than the depletion width Ld that is on the order of microns. The consensus for the case of Si is that the carriers generated far from the built-in field region are collected mostly through the diffusion currents. The key factor behind efficient diffusion currents in crystalline Si is a signifi- cant diffusion length D comparable to the device thickness, where D is the diffusion coefficient and τ is the minority carrier lifetime. Simply stated, it is a high mate- rial quality of crystalline Si that provides long enough τ ~ 1 ms [48] and efficient diffusion (note that in some analyses the product of mobility and τ proportional to Dτ is taken to be a figure of merit). Extending the diffusion current argument over to the case of CdTe may seem unsuccessful if one use the life- time τ ~ 1 µs measured for crystalline X-ray detectors [48]. However, the latter quantity does not describe the transport phenomena in polycrystalline films where the non-equilibrium electrons and holes are spatially sepa- rated by the built-in electric field at grain boundaries. Such a separation can exponentially suppress recombina- tion making charge carrier lifetimes orders of magnitude longer. This understanding is consistent with the fact that CdTe based PV cells retain their high efficiencies in the thickness range of 10 µm and above [54]. Preliminary measurements of carrier lifetime for ~100 µm thick films have demonstrated values at least 10 times higher [53] than those commonly accepted for the single crystal CdTe. It is only a speculation at this time, but the effec- tive diffusion length in polycrystalline CdTe may be comparable to that of crystalline Si. The latter speculation is consistent with the results of our device operation modeling (with SCAPS software; not presented here) based on the baseline input parame- ters commonly accepted for CdTe based PV [55]. That modeling shows that device voltage is a weak function of the CdTe layer thickness, saturating for devices thicker than 100 microns. The current, however, increases sev- eral times when the device thickness changes from 10 to 100 microns saturating for devices thicker than ~300 microns. This is consistent indeed with the above-men- tioned picture of crystalline Si devices with the electric filed limited to near the junction and significant contribu- tion of the diffusion current to the output signal. In view of these observations, CdTe device can be op- erated in two regimes: 1) if the output current is meas- ured, then applying external bias is beneficial for boost- ing signal collection; 2) in the voltage measurement setup, carrier collection without external biasing (photo- voltaic mode of operation) can provide strong enough signal for a device much thicker than the depletion width. Comparison between these two regimes cannot be made based on theoretical estimates only since there are many factors affecting the leakage current and the transport properties in polycrystalline devices. For example, addi- tion of CdS as buffer layer has been shown to dramati- cally decrease the leakage current [14-17]. More experi- mental studies on electronic properties of >100 μm thick polycrystalline CdTe films and detectors are called upon. 4. Conclusions We calculated x-ray spectra for our clinical diagnostic x-ray simulator unit for tube potential voltages from 70 to 140 kVp employing a tungsten anode spectral mode using interpolating polynomials (TASMIP) algorithm. Using these spectra as input we studied the frequency- dependent characteristics, MTF, NPS, and DQE, of thin film direct detection CdTe imager by Monte Carlo simu- lations of energy deposition. Our results showed that the detector based on CdTe is capable of achieving a high resolution as well as high quantum efficiency. We found the optimal thickness of thin film CdTe for diagnostic x-ray imaging to be in the range of 300 to 600 μm. Utilization of high-density and high-atomic number photoconductors is especially important for lowering the exposure levels of fluoroscopic imaging mode, since they are capable of not only detecting a larger fraction of the incident radiation, but are also likely to reduce the lateral spread of secondary electrons and photons. Physical properties of thin-film CdTe, such as mechanical and chemical stability, together with its outstanding radiation Copyright © 2013 SciRes. IJMPCERO  D. SHVYDKA ET AL. 107 hardness and recently developed film deposition tech- niques, make this photoconductor an ideal choice for large-area direct detection system employed in x-ray di- agnostic imaging applications. REFERENCES [1] W. Zhao and J. A. Rowlands, “Digital Radiology Using Active Matrix Readout of Amorphous Selenium: Theo- retical Analysis of Detective Quantum Efficiency,” Medical Physics, Vol. 24, No. 12, 1997, pp. 1819-1833. doi:10.1118/1.598097 [2] W. Zhao, I. Blevis, S. Germann, J. A. Rowlands, D. Wae- chtcher and Z. S. Huang, “Digital Radiology Using Ac- tive Matrix Readout of Amorphous Selenium: Construc- tion and Evaluation of a Prototype Real-Time Detector,” Medical Physics, Vol. 24, No. 12, 1997, pp. 1834-1843. doi:10.1118/1.598098 [3] D. L. Lee, L. K. Cheung, B. G. Rodricks and G. F. Powell, “Improved Imaging Performance of a 14×17-Inch Direct Radiography System Using Se/TFT Detector,” Proceed- ings of SPIE, Vol. 3336, 1998, pp. 14-23. [4] A. Tsukamoto, S. Yamada, T. Tomisaki, M. Tanaka, T. Sakaguchi, K. Suzuki and M. Ikeda, “Development and Evaluation of a Large-Area Selenium-Based Flat-Panel Detector for Real-Time Radiography and Fluoroscopy,” Proceedings of SPIE, Vol. 3659, 1999, pp. 14-23. [5] L. E. Antonuk, K.-W. Jee, Y. El-Mohri, M. Maolinbay, S. Nassif, X. Rong, Q. Zhao, J. H. Siewerdsen, R. A. Street and K. S. Shah, “Strategies to Improve the Signal and Noise Performance of Active Matrix, Flat-Panel Imagers for Diagnostic X-Ray Applications,” Medical Physics, Vol. 27, No. 2, 2000, pp. 289-306. doi:10.1118/1.598831 [6] H. Du, L. E. Antonuk, Y. El-Mohri, Q. Zhao, Z. Su, J. Yamamoto and Y. Wang, “Investigation of Signal Be- havior of Polycrystalline HgI2 at Diagnostic Energies of Prototype, Direct Detection, Active Matrix, Flat-Panel Imagers,” Physics in Medicine and Biology, Vol. 53, No. 5, 2008, pp. 1325-1351. doi:10.1088/0031-9155/53/5/011 [7] K. S. Shan, P. R. Bennett, M. Klugerman, L. P. Moy, G. Entine, D. R. Ouimette and R. Aikens, “Lead Iodide Films for X-Ray Imaging,” Proceedings of SPIE, Vol. 3032, 1997, pp. 395-404. [8] R. A. Streat, J. T. Rahn, S. E. Ready, K. S. Shah, P. R. Bennett, Y. N. Dmitriyev, P. Mei, J. P. Lu, R. B. Apte, J. Ho, K. Van Schuylenbergh, F. Lemmi, J. B. Boyce and P. Nylen, “X-Ray Imaging Using Lead Iodide as a Semi- conductor Detector,” Proceedings of SPIE, Vol. 3659, 1999, pp. 36-47. [9] G. Zentai, L. Partain, R. Pavlyuchkova, G. Virshup, A. Zuck, L. Melekhov, O. Dagan, A. Vilensky and H. Gil- boa, “Large Area Mercuric Iodide X-Ray Imager,” Pro- ceedings of SPIE, Vol. 4682, 2002, pp. 592-600. [10] Y. Kang, L. E. Antonuk, Y. El-Mohri, L. Hu, Y. Li, A. Sawant, Z. Su, Y. Wang, J. Yamamoto and Q. Zhao, “Examination of PbI2 and HgI2 Photoconductive Materi- als for Direct Detection, Active Matrix, Flat-Panel Imag- ers for Diagnostic X-Ray Imaging,” IEEE Transactions on Nuclear Science, Vol. 52, No. 1, 2005, pp. 38-45. doi:10.1109/TNS.2004.843135 [11] Z. Su, L. E Antonuk, Y. El-Mohri, L. Hu, Hong Du, A. Sawant, Y. Li, Y. Wang, J. Yamamoto and Q. Zhao, “Systematic Investigation of the Signal Properties of Polycrystalline HgI2 Detectors under Mammographic, Radiographic, Fluoroscopic and Radiotherapy Irradiation Conditions,” Physics in Medicine and Biology, Vol. 50, No. 12, 2005, pp. 2907-2928. doi:10.1088/0031-9155/50/12/012 [12] M. Simon, R. A. Ford, A. R. Franklin, S. P. Grabowski, B. Menser, G. Much, A. Nascetti, M. Overdick, M. J. Po- well and D. U. Wiechert, “PbO as Direct Conversion X-Ray Detector Material,” Proceedings of SPIE, Vol. 5368, 2004, pp. 188-199. [13] D. R. Ouimette, S. Nudelman and R. S. Aikens, “A New Large-Area X-Ray Image Sensor,” Proceedings of SPIE, Vol. 3336, 1998, pp. 470-476. [14] S. Adachi, N.Hori, K. Sato, K. Uehara, Y. Izumi, H. Na- gata, Y. Yoshimura and S. Yamada, “Experimental Eval- uation of a-Se and CdTe Flat-Panel X-Ray Detectors for Digital Radiography and Fluoroscopy,” Proceedings of SPIE, Vol. 3977, 2000, pp. 38-47. [15] S. Tokuda, S. Adachi, T. Sato, T. Yoshimuta, H. Nagata, K. Uehara, Y. Izumi, O. Teranuma and S. Yamada, “Ex- perimental Evaluation of a Novel CdZnTe Flat-Panel X-Ray Detector for Digital Radiography and Fluoros- copy,” Proceedings of SPIE, Vol. 4320, 2001, pp. 140- 147. [16] S. Tokuda, H. Kishihara, S. Adachi, et al., “Large-Area Deposition of a Polycrystalline CdZnTe Film AND Its Applicability to X-Ray Panel Detectors with Superior Sensitivity,” Proceedings of SPIE, Vol. 4682, 2002, pp. 30-41. [17] S. Tokuda, H. Kishihara, S. Adachi and T. Sato, “Im- provement of the Temporal Response and Output Uni- formity of Polycrystalline CdZnTe Films for High Sensi- tivity X-Ray Imaging,” Proceedings of SPIE, Vol. 5030, 2003, pp. 861-870. [18] C. Choi, C. Kyun, S. Kang and S. Nam, “Comparison of Compound Semiconductor Radiation Films Deposited by Screen Printing Method,” Proceedings of SPIE, Vol. 6510, 2007, pp. 651042-1-651042-8. [19] M. Hoheisel, J. Giersch and P. Bernhardt, “Intrinsic Spa- tial Resolution of Semiconductor X-Ray Detectors: A Simulation Study,” Nuclear Instruments and Methods in Physics Research Section A, Vol. 531, No. 1-2, 2004, pp. 75-81. doi:10.1016/j.nima.2004.05.077 [20] B. E. McCandless and J. R. Sites, “Cadmium Telluride Solar Cells,” In: A. Lique and S. Hegedus, Eds., Hand- book of Photovoltaic Science and Engineering, Wiley, New York, 2003, pp. 617-657. [21] NIST Database, 2013. http://www.nist.gov/pml/data/xcom/index.cfm [22] D. Shvydka, E. Parsai and J. Kang, “Radiation Hardness Study of CdTe Thin Films for Clinical High-Energy Pho- ton Beam Detectors,” Nuclear Instruments and Methods in Physics Research Section A, Vol. 586, No. 2, 2008, pp. 169-173. doi:10.1016/j.nima.2007.11.017 Copyright © 2013 SciRes. IJMPCERO  D. SHVYDKA ET AL. 108 [23] A. Cavallini, B. Fraboni, W. Dusi, N. Auricchio, P. Chir- co, M. Zanarini, P. Siffert and P. Fougeres, “Radiation Effects on II-VI Compound-Based Detectors,” Nuclear Instruments and Methods in Physics Research Section A, Vol. 476, No. 3, 2002, pp. 770-778. doi:10.1016/S0168-9002(01)01674-6 [24] Y. Eisen, L. G. Evans, S. Floyd, C. Schlemm, R. Starr and J. Trombka, “Radiation Damage of Schottky CdTe Detectors Irradiated by 200 MeV Protons,” Nuclear In- struments and Methods in Physics Research Section A, Vol. 491, No. 1-2, 2002, pp. 176-180. doi:10.1016/S0168-9002(02)01229-9 [25] D. L. Batzner, A. Romeo, M. Dobeli, K. Weinert, H. Zogg and A. N. Tiwari, “High Energy Irradiation Proper- ties of CdTe/CdS Solar Cells,” Proceedings of 29th IEEE Photovoltaic Specialists Conference, New Orleans, 19-24 May 2002, pp. 982-985. [26] E. Rossa, H. Schmickler, A. Brambilla, L. Verger, F. Mon- gellaz, “New Development of a Radiation-Hard Poly- crystalline CdTe Detector for LHC Luminosity Monitor- ing,” Proceedings of DIPAC 2001—ESRF, Grenoble, 2001, pp. 94-96 [27] E. I. Parsai, D. Shvydka and J. Kang, “Design and Opti- mization of Large Area Thin Film CdTe Detector for Ra- diation Therapy Imaging Applications,” Medical Physics, Vol. 37, No. 8, 2010, pp. 3980-3994. doi:10.1118/1.3438082 [28] F. B. Brown, “MCNP—A General Monte Carlo N-Parti- cle Transport Code,” Version 5, LA-UR-03-1987, Los Alamos National Laboratory, Los Alamos, 2003. [29] J. M. Boone and J. A. Seibert, “An Accurate Method for Computer Generating Tungsten Anode X-Ray Spectra from 30 to 140 kV,” Medical Physics, Vol. 24, No. 11, 1997, pp. 1661-1670. doi:10.1118/1.597953 [30] T. R. Fewell, R. E. Shuping and K. E. Healy, “Handbook of Computed Tomography X-Ray Spectra,” HHS Publi- cation (FDA) 81-8162, US Government Printing Office, Washington DC, 1981. [31] D. W. O. Rogers, “Low Energy Electron Transport with EGS,” Nuclear Instruments and Methods, Vol. 227, No. 3, 1984, pp. 535-548. doi:10.1016/0168-9002(84)90213-4 [32] A. F. Bielajew and D. W. O. Rogers, “Experimental Benchmarks of EGS,” In: T. M. Jenkins, W. R. Nelson, A. Rindi, A. E. Nahum and D. W. O. Rogers, Eds., Monte Carlo Transport of Electrons and Photons, Prenum, New York, 1988, pp. 115-137. doi:10.1016/0168-9002(84)90213-4 [33] H. Fujita, D.-Y. Tsai, T. Itoh, K. Doi, J. Morishita, K. Ueda and A. Ohtsuka, “A Simple Method for Determin- ing the Modulation Transfer-Function in Digital Radiog- raphy,” IEEE Transactions on Medical Imaging, Vol. 11, No. 1, 1992, pp. 34-39. doi:10.1109/42.126908 [34] J. C. Dainty and R. Shaw, “Imaging Science: Principles, Analysis and Evaluation of Photographic-Type Imaging Processes,” Academic, London, 1974. [35] J. H. Siewerdsen, L. E. Antonuk, Y. EI-Mohri, J. York- ston, W. Huang and I. A. Cunningham, “Signal, Noise Power Spectrum, and Detective Quantum Efficiency of Indirect-Detection Flat-Panel Images for Diagnostic Ra- diology,” Medical Physics, Vol. 25, No. 5, 1998, pp. 614-628. doi:10.1118/1.598243 [36] M. B. Williams, P. A. Mangiafico and P. U. Simoni, “Noise Power Spectra of Images from Digital Mammog- raphy Detectors,” Medical Physics, Vol. 26, No. 7, 1999, pp. 1279-1293. doi:10.1118/1.598623 [37] A. Sawant, L. E. Antonuk, Y. EI-Mohri, Q. Zhao, Y. Li, Z. Su, Y. Wang, J. Yamamoto, H. Du, I. Cunningham, M. Klugerman and K. Shah, “Segmented Crystalline Scintil- lators: An Initial Investigation of High Quantum Effi- ciency Detectors for Megavoltage X-Ray Imaging,” Medical Physics, Vol. 32, No. 10, 2005, pp. 3067-3083. doi:10.1118/1.2008407 [38] D. A. Jaffray, J. J. Battista, A. Fenster and P. Munro, “Monte Carlo Studies of X-Ray Energy Absorption and Quantum Noise in Megavoltage Transmission Radiogra- phy,” Medical Physics, Vol. 22, No. 7, 1995, pp. 1077- 1088. doi:10.1118/1.597593 [39] I. Cunningham, “Applied Linear-Systems Theory,” In: J. Beutel, H. L. Kundel and R. L. Van Metter, Eds., Hand- book of Medical Imaging, SPIE Press, Bellingham, 2000, pp. 79-159. [40] M. J. Yaffe and R. M. Nishikawa, “X-Ray Imaging Con- cepts: Noise, SNR and DQE,” In: J. A. Seibert, G. T. Barnes and R. G. Gould, Eds., Specification, Acceptance Testing and Quality Control of Diagnostic X-Ray Imaging Equipment, Medical Physics Monograph, The American Institute of Physics, New York, 1994, pp. 109-144. [41] A. L. Fahrenbruch and R. H. Bube, “Fundamentals of Solar Cells,” Academic Press, New York, 1983. [42] R. Harju, V. G. Karpov, D. Grecu and G. Dorer, “Elec- tron-Beam Induced Degradation in CdTe Photovoltaics,” Journal of Applied Physics, Vol. 88, No. 4, 2000, pp. 1794-1801. doi:10.1063/1.1305857 [43] D. S. McGregor and H. Hermon, “Room-Temperature Compound Semiconductor Radiation Detectors,” Nuclear Instruments and Methods in Physics Research Section A, Vol. 395, No. 1, 1997, pp. 101-124. [44] D. L. Lee, L. K. Cheung, E. F. Palechi and L. S. Jeromin, “A Discussion on Resolution and Dynamic Range of Se-TFT Direct Digital Radiographic Detector,” Proceed- ings of SPIE, 11 April 1996, Newport Beach, pp. 511- 522. [45] J. M. Boone, J. A. Seibert, J. M. Sabol and M. Tecotzky, “A Monte Carlo Study of X-Ray Fluorescence in X-Ray Detectors,” Medical Physics, Vol. 26, No. 6, 1999, pp. 905-916. doi:10.1118/1.598612 [46] G. F. Knoll, “Radiation Detection and Measurement,” 3rd Edition, Wiley, Hoboken, 2000. [47] N. Strokan, V. Ajdacic and B. Lalovic, “Measurements of the Fano Factor in Germanium,” Nuclear Instruments and Methods, Vol. 94, No. 1, 1971, pp. 147-149. doi:10.1016/0029-554X(71)90352-1 [48] A. Owens and A. Peacock, “Compound Semiconductor Radiation Detectors,” Nuclear Instruments and Methods in Physics Research Section A, Vol. 531, No. 1-2, 2004, pp. 18-37. doi:10.1016/j.nima.2004.05.071 Copyright © 2013 SciRes. IJMPCERO  D. SHVYDKA ET AL. Copyright © 2013 SciRes. IJMPCERO 109 [49] K. Scharf, “Photovoltaic Effect Produced in Silicon Solar Cells by X- and Gamma Rays,” Journal of Research of the National Bureau of Standards, Vol. 64A, No. 4, 1960, pp. 297-307. [50] G. Entine, R. H. Redus, A. Feyder and P. J. Biggs, “Re- cent Results with a CdTe Imaging Portal Scanner for Ra- diation Therapy,” IEEE Transactions on Nuclear Science, Vol. 40, No. 4, 1993, pp. 1012-1016. doi:10.1109/23.256703 [51] R. J. Fox and D. C. Agouridis, “CdTe Photovoltaic Gam- ma-Ray Dosimeter,” Nuclear Instruments and Methods, Vol. 157, No. 1, 1978, pp. 65-69. doi:10.1016/0029-554X(78)90588-8 [52] R. A. Achmadullin, V. V. Artemov, V. F. Dvoryankina, G. G. Dvoryankina, Y. M. Dikaeva, M. G. Ermakova, O. N. Ermakovaa, V. B. Chmil, A. G. Holodenkoc, A. A. Kudryashova, A. I. Krikunova, A. G. Petrov, A. A. Telegina and A. P. Vorobiev, “Photovoltaic X-Ray De- tectors Based on Epitaxial GaAs Structures,” Nuclear In- struments and Methods in Physics Research Section A, Vol. 554, No. 1-3, 2005, pp. 314-319. doi:10.1016/j.nima.2005.07.073 [53] B. N. Zaveryukhin, S. A. Mirsagatov, N. N. Zaveryu- khina, V. V. Volodarski and E. B. Zaveryukhina, “Cad- mium Telluride Thin-Film Detectors of Nuclear Radia- tion,” Technical Physics Letters, Vol. 29, No. 11, 2003, pp. 959-962. doi:10.1134/1.1631378 [54] X. Wu, “High-Efficiency Polycrystalline CdTe Thin-Film Solar Cells,” Solar Energy, Vol. 77, No. 6, 2004, pp. 803- 814. doi:10.1016/j.solener.2004.06.006 [55] M. Burgelman, P. Nollet and S. Degrave, “Modelling Polycrystalline Semiconductor Solar Cells,” Thin Solid Films, Vol. 361-362, 2000, pp. 527-532. http://users.elis.ugent.be/ELISgroups/solar/projects/scaps. html
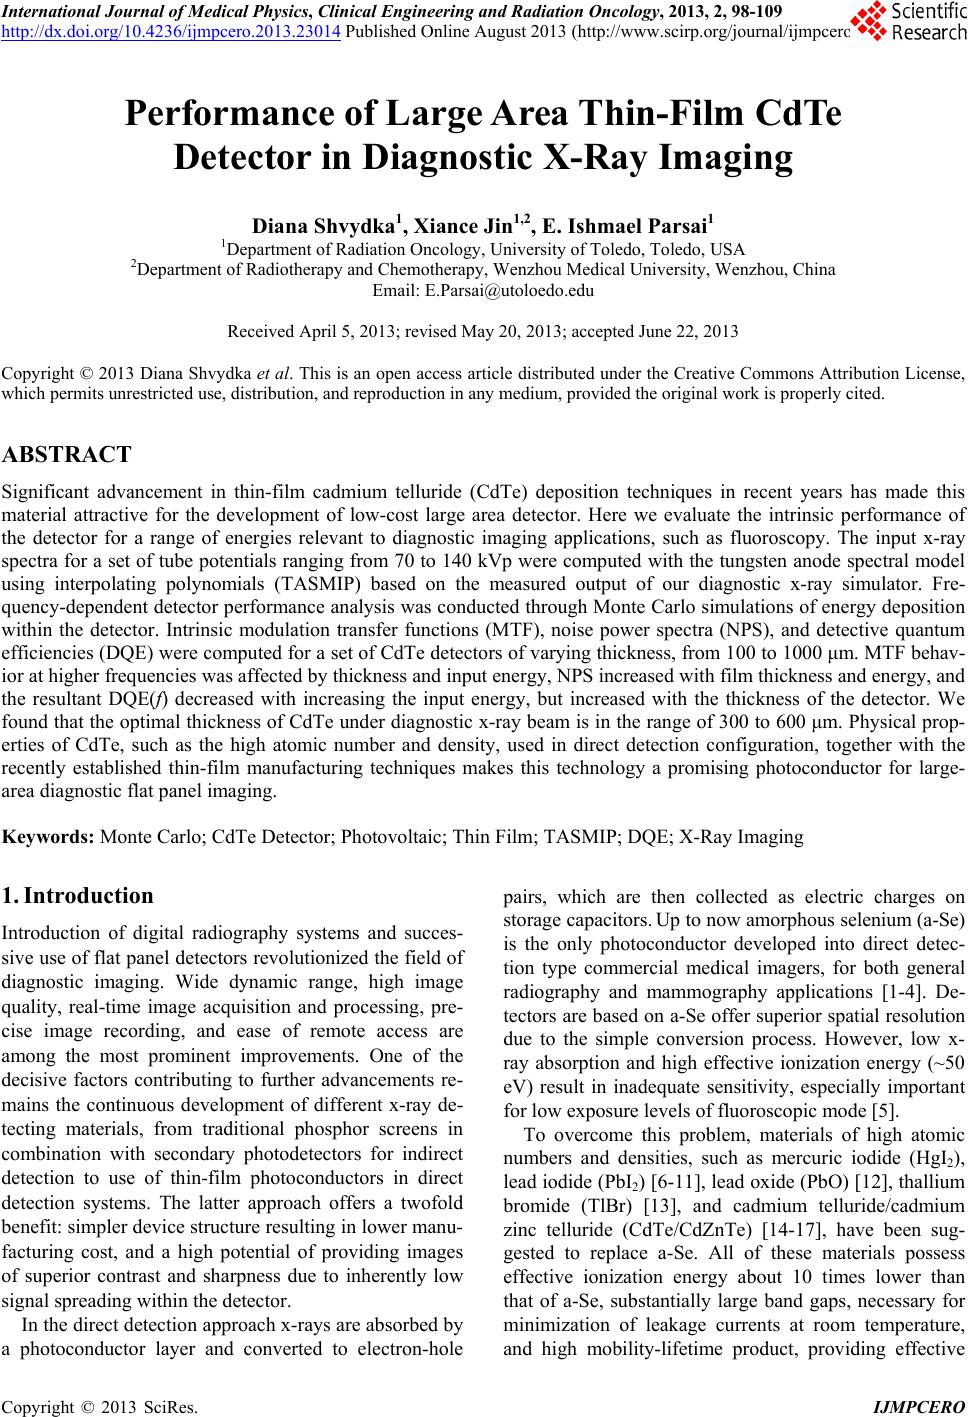
|