A Comparison of Bending Properties for Cellular Core Sandwich Panels
Copyright © 2013 SciRes. MSA
474
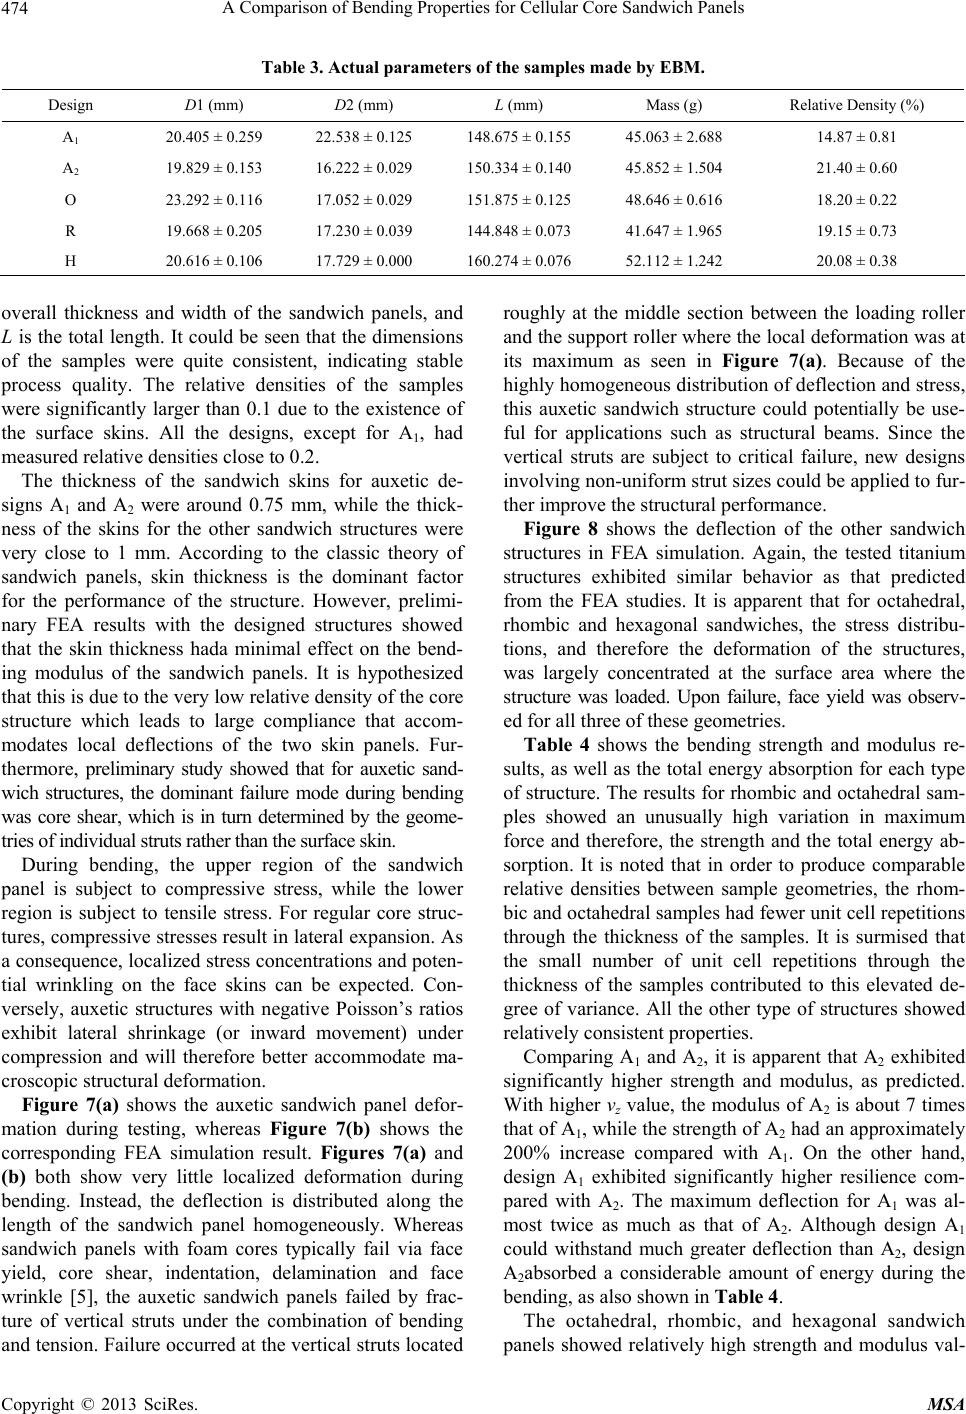
Table 3. Actual parameters of the samples made by EBM.
Design D1 (mm) D2 (mm) L (mm) Mass (g) Relative Density (%)
A1 20.405 ± 0.259 22.538 ± 0.125 148.675 ± 0.155 45.063 ± 2.688 14.87 ± 0.81
A2 19.829 ± 0.153 16.222 ± 0.029 150.334 ± 0.140 45.852 ± 1.504 21.40 ± 0.60
O 23.292 ± 0.116 17.052 ± 0.029 151.875 ± 0.125 48.646 ± 0.616 18.20 ± 0.22
R 19.668 ± 0.205 17.230 ± 0.039 144.848 ± 0.073 41.647 ± 1.965 19.15 ± 0.73
H 20.616 ± 0.106 17.729 ± 0.000 160.274 ± 0.076 52.112 ± 1.242 20.08 ± 0.38
overall thickness and width of the sandwich panels, and
L is the total length. It could be seen that the dimensions
of the samples were quite consistent, indicating stable
process quality. The relative densities of the samples
were significantly larger than 0.1 due to the existence of
the surface skins. All the designs, except for A1, had
measured relative densities close to 0.2.
The thickness of the sandwich skins for auxetic de-
signs A1 and A2 were around 0.75 mm, while the thick-
ness of the skins for the other sandwich structures were
very close to 1 mm. According to the classic theory of
sandwich panels, skin thickness is the dominant factor
for the performance of the structure. However, prelimi-
nary FEA results with the designed structures showed
that the skin thickness hada minimal effect on the bend-
ing modulus of the sandwich panels. It is hypothesized
that this is due to the very low relative density of the core
structure which leads to large compliance that accom-
modates local deflections of the two skin panels. Fur-
thermore, preliminary study showed that for auxetic sand-
wich structures, the dominant failure mode during bending
was core shear, which is in turn determined by the geome-
tries of individual struts rather than the surface skin.
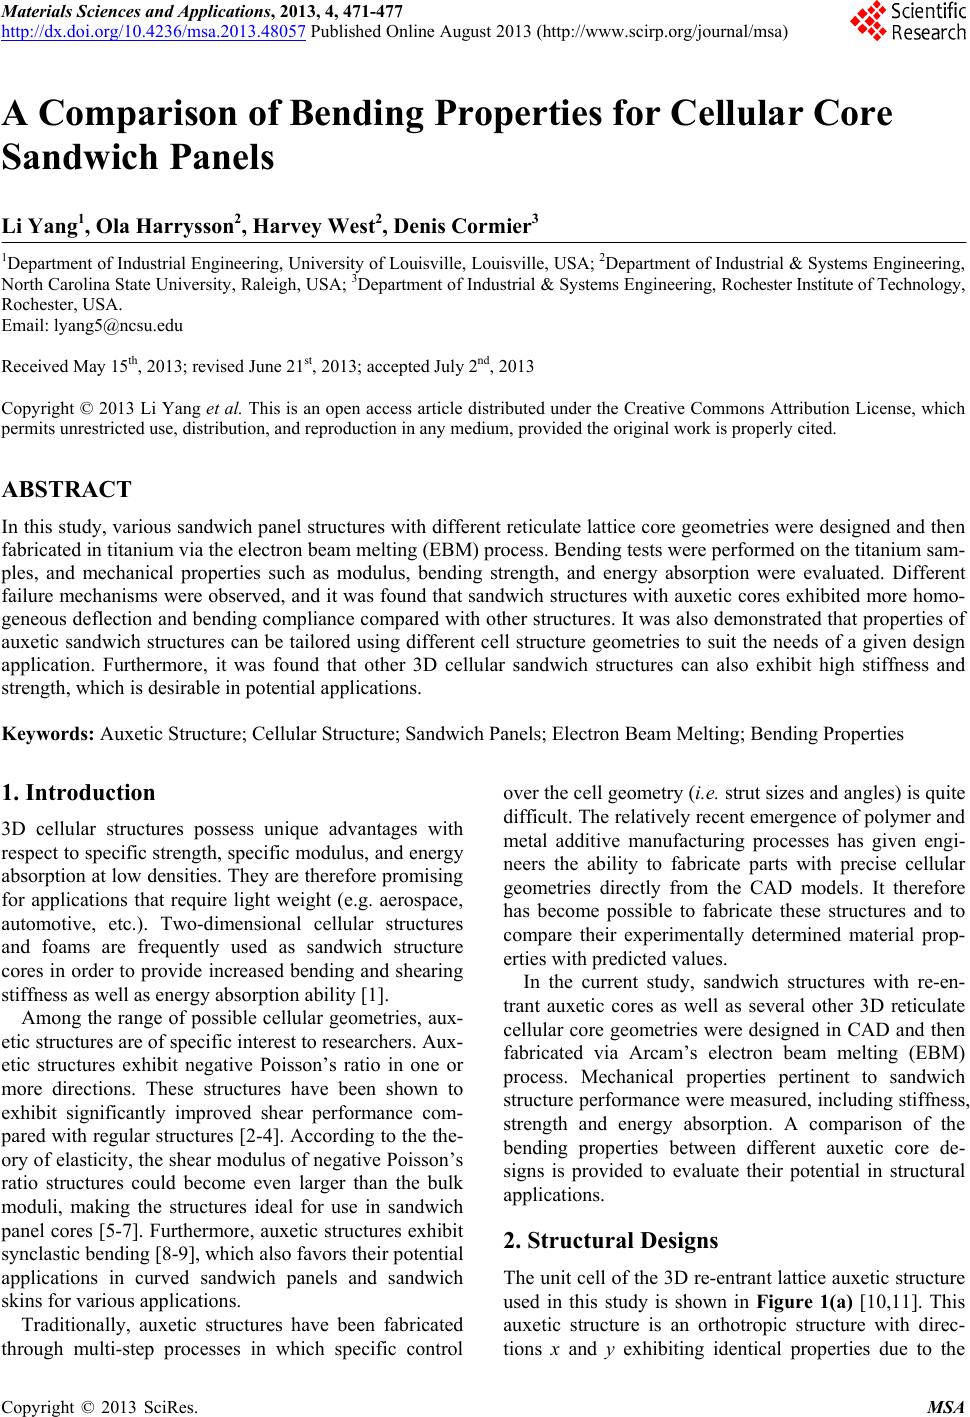
During bending, the upper region of the sandwich
panel is subject to compressive stress, while the lower
region is subject to tensile stress. For regular core struc-
tures, compressive stresses result in lateral expansion. As
a consequence, localized stress concentrations and poten-
tial wrinkling on the face skins can be expected. Con-
versely, auxetic structures with negative Poisson’s ratios
exhibit lateral shrinkage (or inward movement) under
compression and will therefore better accommodate ma-
croscopic structural deformation.
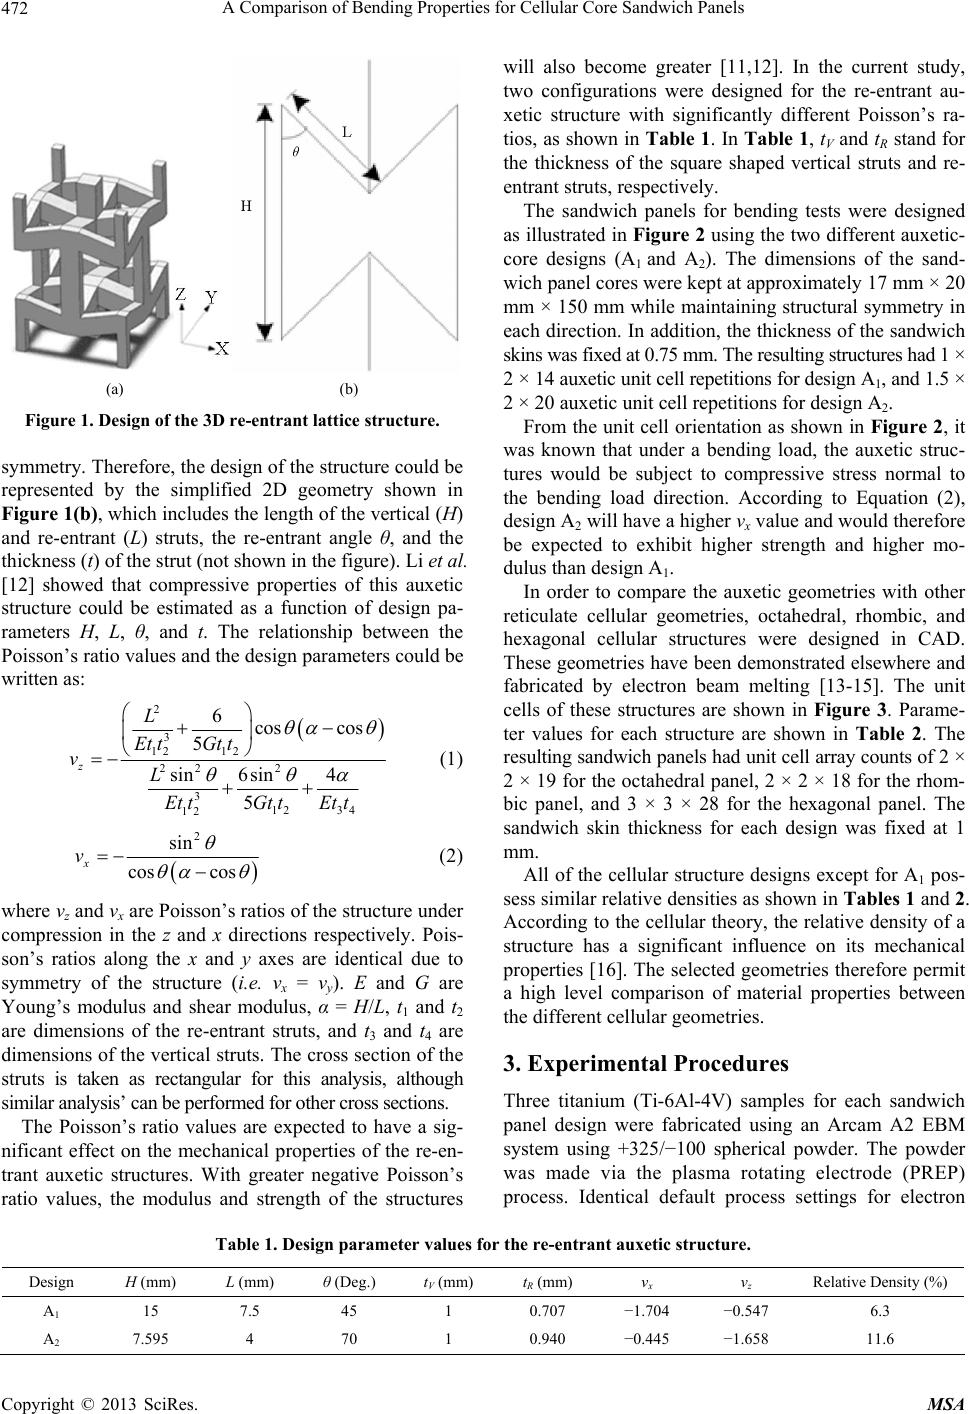
Figure 7(a) shows the auxetic sandwich panel defor-
mation during testing, whereas Figure 7(b) shows the
corresponding FEA simulation result. Figures 7(a) and
(b) both show very little localized deformation during
bending. Instead, the deflection is distributed along the
length of the sandwich panel homogeneously. Whereas
sandwich panels with foam cores typically fail via face
yield, core shear, indentation, delamination and face
wrinkle [5], the auxetic sandwich panels failed by frac-
ture of vertical struts under the combination of bending
and tension. Failure occurred at the vertical struts located
roughly at the middle section between the loading roller
and the support roller where the local deformation was at
its maximum as seen in Figure 7(a). Because of the
highly homogeneous distribution of deflection and stress,
this auxetic sandwich structure could potentially be use-
ful for applications such as structural beams. Since the
vertical struts are subject to critical failure, new designs
involving non-uniform strut sizes could be applied to fur-
ther improve the structural performance.
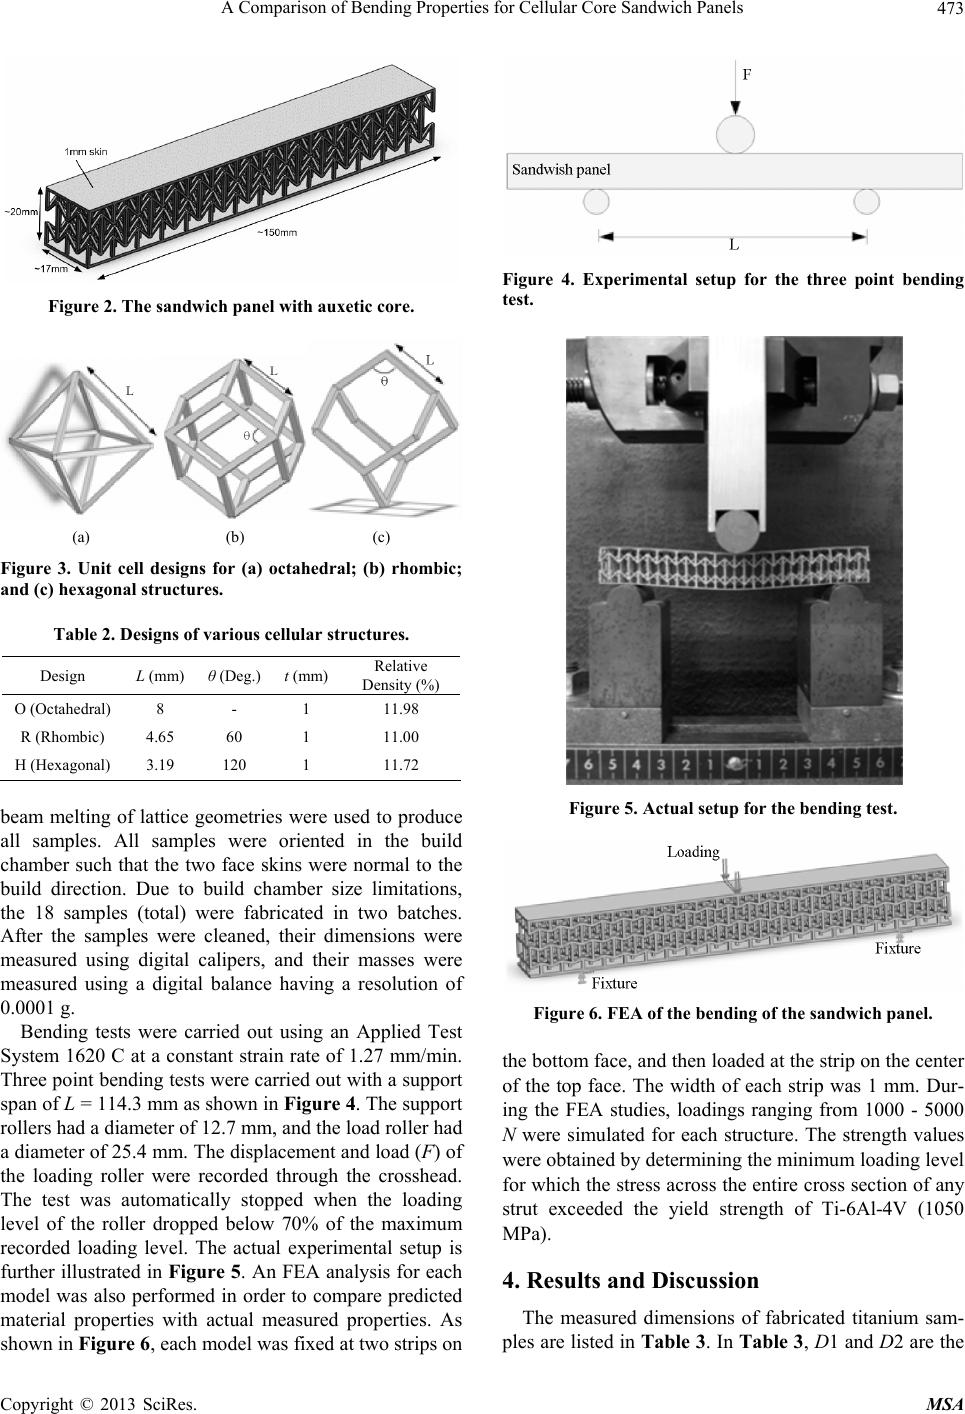
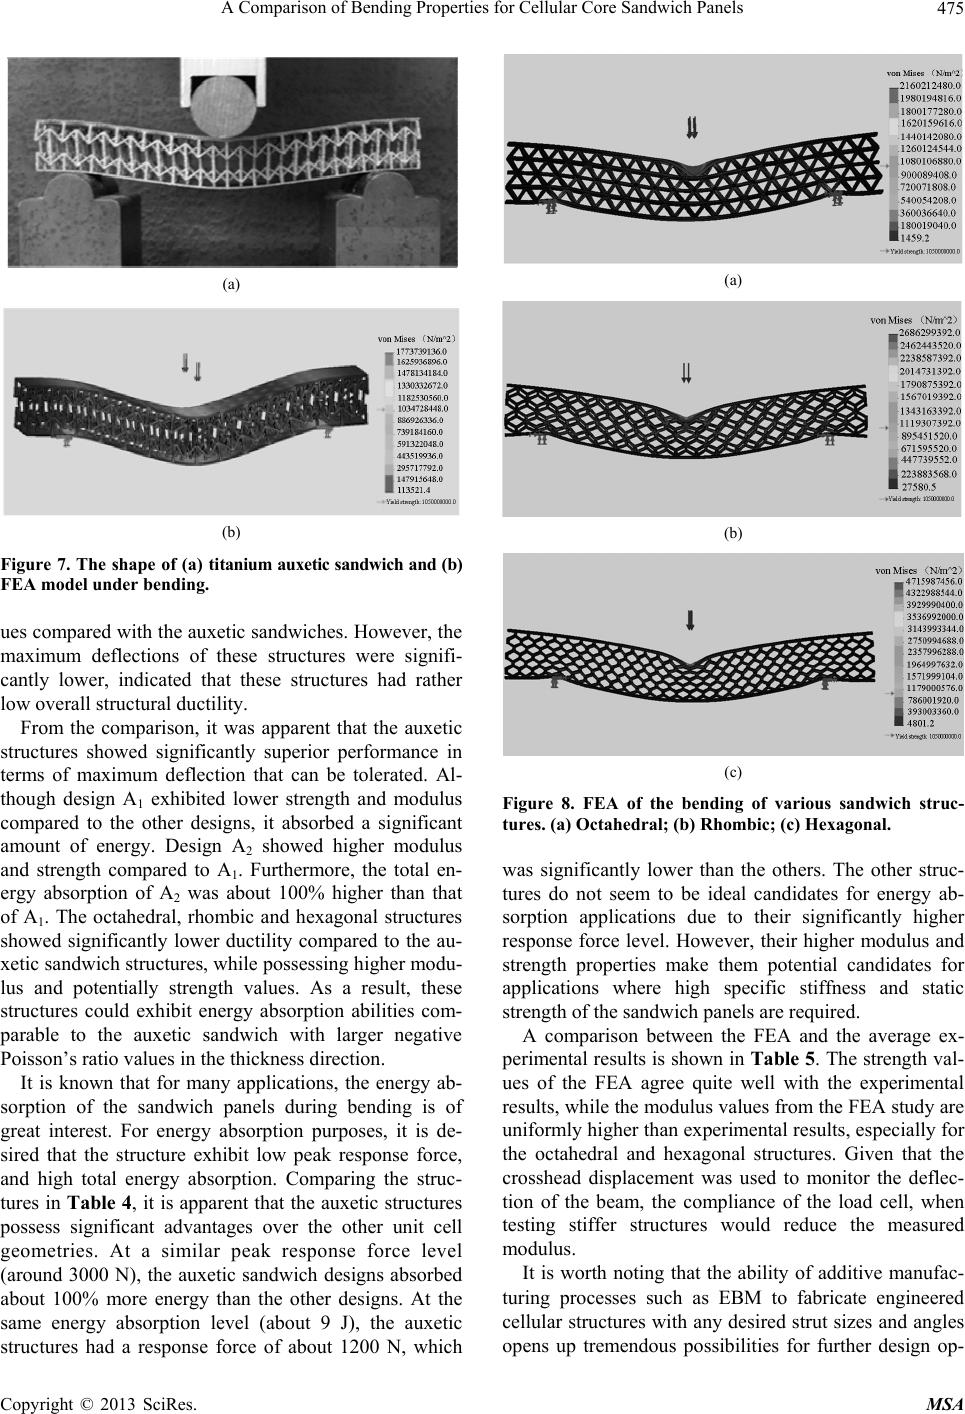
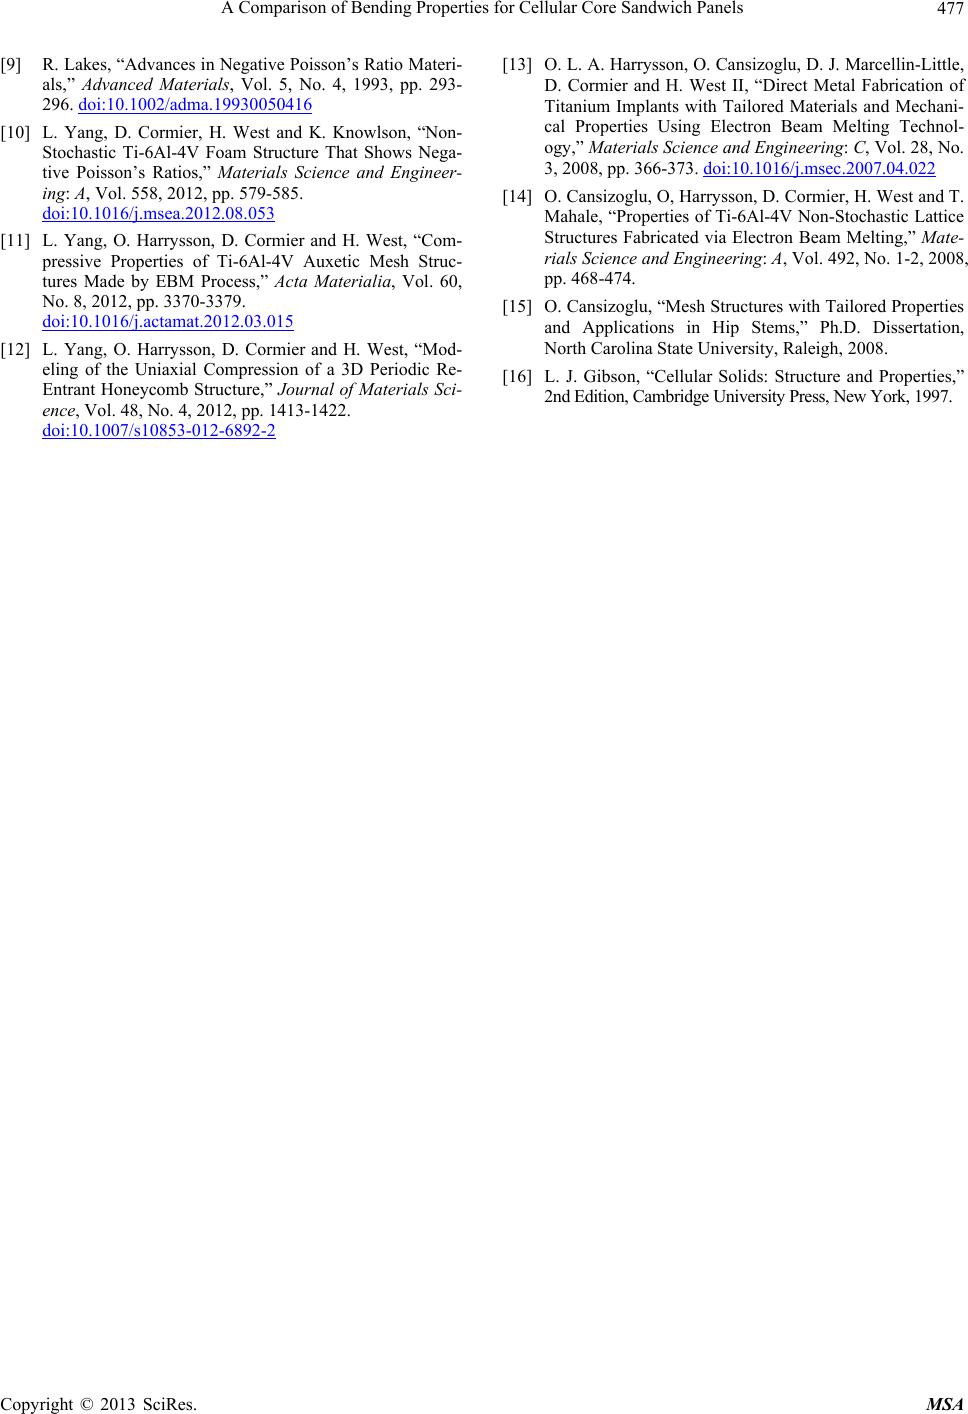
Figure 8 shows the deflection of the other sandwich
structures in FEA simulation. Again, the tested titanium
structures exhibited similar behavior as that predicted
from the FEA studies. It is apparent that for octahedral,
rhombic and hexagonal sandwiches, the stress distribu-
tions, and therefore the deformation of the structures,
was largely concentrated at the surface area where the
structure was loaded. Upon failure, face yield was observ-
ed for all three of these geometries.
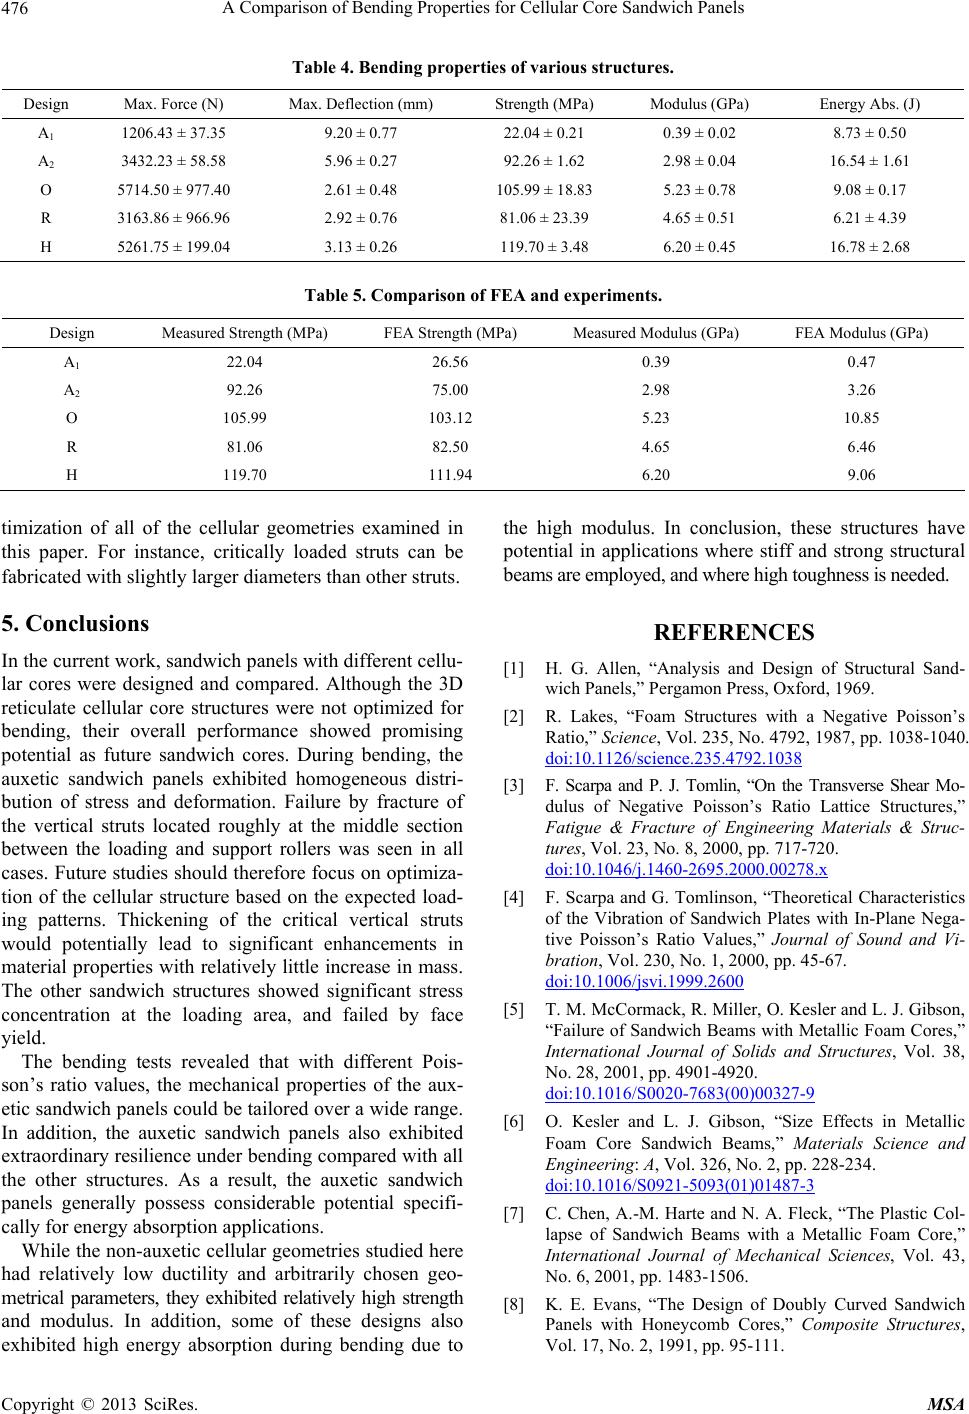
Table 4 shows the bending strength and modulus re-
sults, as well as the total energy absorption for each type
of structure. The results for rhombic and octahedral sam-
ples showed an unusually high variation in maximum
force and therefore, the strength and the total energy ab-
sorption. It is noted that in order to produce comparable
relative densities between sample geometries, the rhom-
bic and octahedral samples had fewer unit cell repetitions
through the thickness of the samples. It is surmised that
the small number of unit cell repetitions through the
thickness of the samples contributed to this elevated de-
gree of variance. All the other type of structures showed
relatively consistent properties.
Comparing A1 and A2, it is apparent that A2 exhibited
significantly higher strength and modulus, as predicted.
With higher νz value, the modulus of A2 is about 7 times
that of A1, while the strength of A2 had an approximately
200% increase compared with A1. On the other hand,
design A1 exhibited significantly higher resilience com-
pared with A2. The maximum deflection for A1 was al-
most twice as much as that of A2. Although design A1
could withstand much greater deflection than A2, design
A2absorbed a considerable amount of energy during the
bending, as also shown in Table 4.
The octahedral, rhombic, and hexagonal sandwich
panels showed relatively high strength and modulus val-