J. Biomedical Science and Engineering, 2010, 3, 1156-1160
doi:10.4236/jbise.2010.312150 Published Online December 2010 (http://www.SciRP.org/journal/jbise/
JBiSE
).
Published Online December 2010 in SciRes. http://www.scirp.org/journal/JBiSE
Magnetic field strength properties in bone marrow during
pulsed electromagnetic stimulation
Hir oyuki Tamaki1, 2, Kengo Yotani3, Atsumu Yuki4, Hikari Kirimoto1, Kazuhiro Sugawara1, 2,
Hideaki Onishi1, 2
1Institute for human movement and Medical Sciences, Japan;
2Department of Physical Therapy, Niigata University of Health and Welfare, Niigata, Japan;
3Department of Physiological Sciences, National Institute of Fitness and Sports, Kanoya, Japan;
4Department of Physical Education, Aichi University of Education, Kariya, Japan.
Email: hiroyuki-tamaki@nuhw.ac.jp
Received 4 October 2010; revised 7 October 2010; accepted 8 October 2010.
ABSTRACT
We clarified the characteristics of pulsed electro-
magnetic field (PEMF) strength in marrow cavity
with bone marrow in long bones based on actual
measurements taken during pulsed magnetic stimu-
lation (PMS). Measurements were made under 810
different conditions of stimulation intensity, distance,
and position. Significant and strong linear correla-
tions were observed between PEMF strength and
stimulation intensity. PEMF strength in marrow cav-
ity during PMS showed an exponential decay de-
pending on coil-sensor distance, with a breaking
point at approximately 30 mm. PEMF strength dis-
tributions in bone showed geometric differences be-
tween 3 types. These findings suggest that PEMF
strength in bone depends on stimulation intensity,
distance and horizontal position. Our actual meas-
ured data could be useful in determining stimulation
programs and estimating the in vivo efficacy of
PEMF in marrow cavity for research and clinical use.
Keywords: Magnetic Stimulation; Bone Tissue; Focality;
Geometry; Intensity
1. INTRODUCTION
Pulsed electromagnetic field (PEMF) stimulation has
been used clinically to treat bone disorders and report-
edly promotes osteogenesis, in part through direct ac-
tions on osteoblasts. However, such clinical success
contrasts with negative reports regarding the effects of
pulsed magnetic stimulation on cellular proliferation,
differentiation and mineralization of osteoblasts in vitro
[1,2]. Differences in response to biophysical factors
seemed to depend on the specific conditions of pulsed
magnetic stimulation, e.g., stimulation intensity, fre-
quency, exposure time and stage of osteoblast matura-
tion [3]. In particular, stimulation intensity depends on
stimulator output, distance and position [4,5]. Only a
few in vivo studies have shown PEMF effects on bone
formation processes in tissue, protein and mRNA levels
[6-8]. An accompanying problem is the difficulty in
determining magnetic field strength inside bone in vivo,
as characterization of magnetic field strength in bone
during PEMF stimulation under different conditions
remains incomplete. A measurement of PEMF strength
in marrow cavity into which a magnetic sensor probe
has been inserted would enable us to obtain the data
applicable to in vivo studies [5,8]. This study clarified
the characteristics of PEMF strength in marrow cavity
with bone marrow in long bones during pulsed mag-
netic stimulation under 810 different conditions of
stimulation intensity, distance, and positions.
2. METHODS
The end of a magnetic sensor probe (length, 101.6 mm;
sensor location, 8.5 mm from bone end; active area,
3.8-mm diameter) was placed into the distal metaphysis
of a femur removed from male Wistar rats at 30-33
weeks old (n = 6). Three-dimensional micro-CT images
of long bones (Skyscan 1076®, Skyscan, Aartselaar,
Belgium) were obtained to confirm the positions of sen-
sor and wire in the marrow cavity (Figure 1) [8].
Bones were set on a precision horizontal stage that
was able to be manually moved in 3 dimensions (X, Y
and Z axes). A 9-cm-diameter magnetic coil was held in
a clamp horizontally and placed with the center of the
coil right above the active area of the sensor probe. The
magnetic coil and sensor probe were connected to a
magnetic stimulator (Magstim 200; The Magstim Com-
pany, Whitland, UK) and a gaussmeter (5180; FW Bell,
Orland, USA), respectively. The PEMF was generated
H. Tamaki et al. / J. Biomedical Science and Engineering 3 (2010) 1156-1160 1157
Figure 1. A schematic of the experimental setup. Measure-
ments were performed at 9 horizontal positions (A-I) on the
precision stage (X-Y axis) and at 9 coil-sensor distances. Sen-
sor position was confirmed with μCT scanner and a laser beam
so as to be centred (E) on the 3 3 grid points at 10-mm inter-
vals before the experiment.
by a commercially available, clinically approved mag-
netic stimulator (Magstim 200; The Magstim Company)
which was able to generate a maximum magnetic field
of 2 T. Stimuli were delivered at 10 stimulation intensi-
ties from 10-100% in increments of 10% of the maximal
stimulator output. A total of 81 different measurement
positions were set to determine a distribution map of
individual magnetic field strengths in marrow cavity
using the 3-dimensional drive precision stage, that is, at
9 coil-to-sensor distances from 10-90 mm with intervals
of 10 mm (Z axis) and at 9 horizontal positions on 3 3
grid points with intervals of 10 mm (X-Y axes) (Figure
1). Peak PEMF strength (magnetic flux density) during
PEMF stimulation was measured 3 times for each condi-
tion using the gaussmeter (5180; FW Bell) [9] with an
analog output of 100 kHz sampling rate, ±0.75% accu-
racy and DC-30 kHz bandwidth. Signals from each
measurement were checked using an oscilloscope and
subsequently digitized at a sampling frequency of 100
kHz using a 16-bit A/D converter (Power Lab; AD In-
struments, Tokyo, Japan) and stored on a personal com-
puter for later analysis. Each instrument was calibrated
immediately before data collection. The same procedure
for measurement was followed without the bone at the
end of a magnetic sensor probe as a control. Repeatabil-
ity was assessed on 2 separate days in a pilot study under
conditions of 30 mm magnetic sensor-coil distance and
position E as in Figure 1 on the X-Y axis at stimulation
intensities of 10-100%.
Precision of measurements for peak PEMF strength
was calculated as the percent coefficient of variation
(CV%) using data from 100 repeated measurements un-
der each individual condition. Bland-Altman analysis
[10] was used to evaluate systemic bias and the limits of
agreement between measured values obtained on
test-retest. Linear regression analysis was used to deter-
mine correlations between stimulation intensity and
PEMF strength values. Non-linear equations were used
to describe the relationship between PEMF strength and
sensor-coil distance. Analysis of variance (ANOVA) was
used to compare PEMF strength as a function of stimu-
lation intensity, sensor-coil distance and position. Data
are presented as mean ±standard deviation (SD), with
values of P < 0.05 considered statistically significant. All
study protocols were approved by the ethics committee
of the National Institute of Fitness and Sports and con-
ducted in compliance with the Declaration of Helsinki.
3. RESULTS
CV% for repeated measurements and Pearson’s correla-
tion coefficient for the test-retest of PEMF strength mea-
surements in bone during PEMF stimulation were 0.19-
0.97% and r = 1.00 (P < 0.0001), respectively. Bland-
Altman analysis showed a mean difference (bias) of 0.1
mT and 95% limits of agreement of ±1.21 mT, demon-
strating excellent agreement between test-retest values.
A significant strong linear correlation was seen be-
tween PEMF strength and stimulation intensity at each
position and coil-sensor distance (r2 = 0.99-1.00, P <
0.0001) (Figure 2). PEMF strength in marrow cavity
during PEMF stimulation showed an exponential decay
depending on coil-sensor distance at each stimulation
intensity, with a breaking point at approximately 30 mm
distance, except for at positions C, F and I (r2 =
0.97-0.99, P < 0.0001) (Figure 3). Significant reverse
correlations were noted between PEMF strength and
coil-sensor distance in positions C, F and I under all
stimulation intensity conditions (r2 = 0.84-0.96, P <
0.0001). Horizontal positions were classified into 3
groups exhibiting the same trends of regression lines and
curves according to horizontal position, with the highest
values for positions A-D-E, middle values for B-G-H,
and lowest values for C-F-I. For instance, mean PEMF
strength for each position at 50% stimulation intensity
from 30 mm distance were 163.7 ± 4.8 mT, 128.3 ± 2.1
mT and 90.0 ± 2.9 mT for high, middle and low values
groups, respectively (Figure 4). Intra-group comparison
of each regression slope did not reveal any significant
differences (P > 0.36) among regression lines for posi-
tions A, D and E, and likewise for the B-G-H and C-F-I
groups. For inter-group comparison between position
A-D-E, B-G-H and C-F-I groups, significant differences
Copyright © 2010 SciRes. JBiSE
H. Tamaki et al. / J. Biomedical Science and Engineering 3 (2010) 1156-1160
Copyright © 2010 SciRes.
1158
Figure 2. Relationships between peak PEMF strength and stimulation intensities in marrow cavity and control conditions. Note the 3
types of geometric difference in PEMF strength correlating with stimulation intensity and distance, with the highest values for posi-
tions A-D-E, middle values for B-G-H and lowest values for C-F-I. Positions A-I are the same as in Figure 1.
Figure 3. Relationships between peak PEMF strength and coil-
sensor distance at 50% stimulation intensity and at 9 positions
(A-I). Figure 4. Relationships between peak PEMF strength and
horizontal positions (A-I) at 50% stimulation intensity and 30
mm coil-sensor distance.
were shown between each regression slope (P < 0.0001)
at a distance of 10-70 mm. Values of regression slopes
and those differences among groups decreased exponen-
tially with increasing distance. The ratio of slope values
in B-G-H and C-F-I groups to those in the A-D-E group
were 0.72 and 0.26 at 10 mm distance, 0.86 and 0.71 at
50 mm distance, and 0.93 and 0.88 at 90 mm distance,
respectively. These ratios exceeded 0.8 at a distance of
>60 mm. Comparison of the fit of non-linear curves re-
vealed one curve for all data set in each position group.
JBiSE
H. Tamaki et al. / J. Biomedical Science and Engineering 3 (2010) 1156-1160 1159
For control conditions, no significant differences in
PEMF strength were observed under any conditions.
4. DISCUSSION
The present study demonstrated: 1) intensity dependency
(i.e., PEMF strength correlated perfectly with stimula-
tion intensity); 2) distance dependency (i.e., these char-
acteristics diminished with increased exponentially
coil-sensor distance); and 3) position dependency (i.e.,
PEMF strength distributions in bone were classified into
3 groups according to horizontal position).
The strong linear relationship seen between PEMF
strength and stimulation intensity indicates stimulation
intensity as a very accurate predictor of PEMF strength
in marrow cavity with bone marrow in long bones.
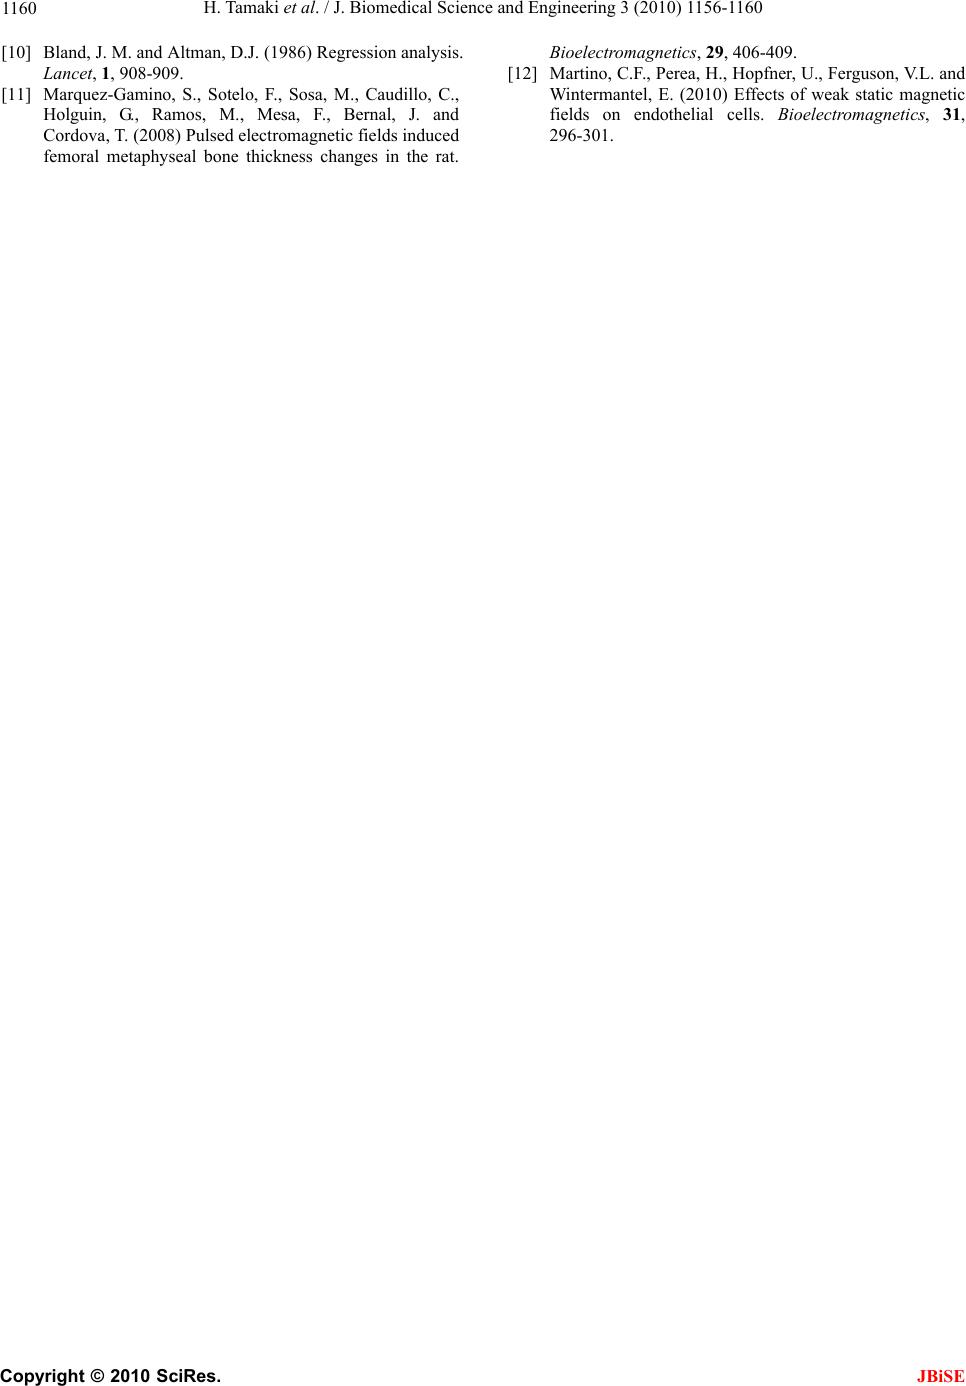
However, 3 types of geometric difference in regression
line slopes and absolute values of PEMF strength were
identified, with higher stimulation intensity obviously
showing larger geometric differences in PEMF strength.
For the condition of 50% stimulation intensity from a
distance of 30 mm, for example, our results indicate that
PEMF strength was attenuated by approximately 32%
and 45% at positions B-G-H and C-F-I compared to po-
sitions A-D-E, respectively. In addition, distance-de
pendent declines in regression slopes and reductions in
geometric differences suggest that a distance factor also
influences the relationship between stimulation intensity
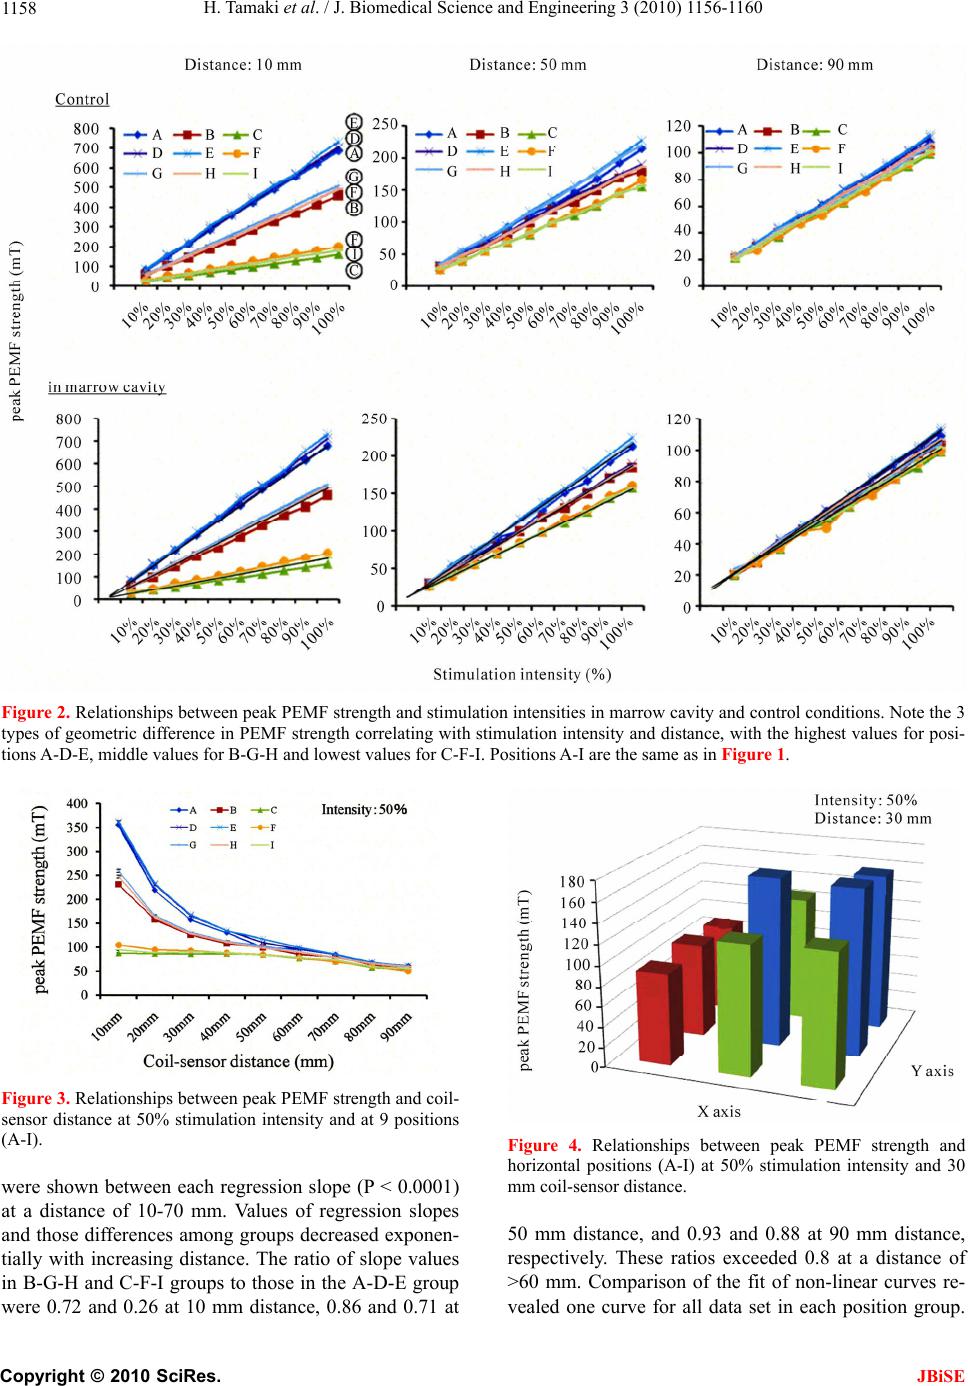
and PEMF strength. The relationship between electric
field strength and coil-cortex distance at 5-30 mm also
reportedly shows exponential decay as a steep decrease
with increasing stimulation distance [4]. In the present
study, the relationships between PEMF strength and
coil-sensor distance (10-90 mm range) showed exponen-
tial decay with a breaking point at a coil-sensor distance
of around 30 mm. This result suggests that the longer
coil-sensor distance, the smaller the geometric difference
in PEMF strength, particularly in terms of the uniformity
of the stimulated area (i.e., a decrease in focality) at dis-
tances >40 mm. Testing the influence of PEMF stimula-
tion on bone tissue in vivo [6,7,11], stimulation condi-
tions with lower spatial focality would be preferable to
achieve approximately equal PEMF strength throughout
the whole marrow cavity with bone marrow in long
bones. To the best of our knowledge, this is the first
study investigating PEMF strength based on the meas-
urements in marrow cavity in long bones under 810
stimulation conditions. Our results might be helpful in
determining stimulation programs and estimating the in
vivo efficacy of PEMF in marrow cavity in long bones
for research and clinical use. The characteristics of
PEMF strength presented here also suggest the potential
for in vivo application of our data to other tissues [12] by
manipulating focality and stimulation intensity. Further
studies are needed to clarify magnetic field strength
properties in other tissues and animals.
5. ACKNOWLEDGEMENTS
This work was supported in part by a Grant-in-Aid for Scientific Re-
search (C, project nos. 18200512 and 22500611) from the Japan Soci-
ety for the Promotion of Science in 2010, and by a Grant-in-Aid for
Developed Research (B, project No. H22B19) from the Niigata Uni-
versity of Health and Welfare in 2010.
REFERENCES
[1] Yamada, S., Guenther, H.L., and Fleisch, H. (1985) The
effect of pulsed electromagnetic fields on bone cell me-
tabolism and calvaria resorption in vitro, and on calcium
metabolism in the live rat. International Orthopaedics, 9,
129-134.
[2] Sakai, Y., Patterson, T.E., Ibiwoye, M.O., Midura, R.J.,
Zborowski, M., Grabiner, M.D. and Wolfman, A. (2006)
Exposure of mouse preosteoblasts to pulsed electromag-
netic fields reduces the amount of mature, type I collagen
in the extracellular matrix. Journal of Orthopaedic Re-
search, 24, 242-253.
[3] Diniz, P., Shomura, K., Soejima, K. and Ito, G. (2002)
Effects of pulsed electromagnetic field (PEMF) stimula-
tion on bone tissue like formation are dependent on the
maturation stages of the osteoblasts. Bioelectromagnetics
23, 398-405.
[4] Thielscher, A. and Kammer, T. (2004). Electric field
properties of two commercial figure-8 coils in TMS:
calculation of focality and efficiency. Clinical Neuro-
physiology, 115, 1697-708.
[5] Tamaki, H., Yotani, K., Yuki, A., Kirimoto, H., Sugawara,
K., Jigami, H., Tsubaki, A., Onishi, H. and Ogita, F.
(2010) Characterization of magnetic field strength in
long bone during pulsed electromagnetic stimulation.
Advances in Exercise and Sports Physiology, 15, 77.
[6] Takano-Yamamoto, T., Kawakami, M. and Sakuda, M.
(1992) Effect of a pulsing electromagnetic field on
demineralized bone-matrix-induced bone formation in a
bony defect in the premaxilla of rats. Journal of Dental
Research, 71, 1920-1925.
[7] Shen, W.W. and Zhao, J.H. (2010) Pulsed electromag-
netic fields stimulation affects BMD and local factor
production of rats with disuse osteoporosis. Bioelectro-
magnetics, 31, 113-119.
[8] Tamaki, H., Yotani, K., Yuki, A., Nishizawa, T., Tomori,
K., Kirimoto, H., Onishi, H., Ogita, F. and Takekura, H.
(2010) Effects of pulsed electromagnetic fields stimula-
tion on gene expression related to bone formation in
spontaneously hypertensive rats. 32nd Annual Meeting of
American Society for Bone and Mineral Research, To-
ronto, 16, 56.
[9] Lingwood, M.D., Siaw, T.A., Sailasuta, N., Ross, B.D.,
Bhattacharya, P. and Han, S. (2010) Continuous flow
overhauser dynamic nuclear polarization of water in the
fringe field of a clinical magnetic resonance imaging
system for authentic image contrast. Journal of Magnetic
Resonance, 205, 247-254.
Copyright © 2010 SciRes. JBiSE
H. Tamaki et al. / J. Biomedical Science and Engineering 3 (2010) 1156-1160
Copyright © 2010 SciRes.
1160
JBiSE
[11] Marquez-Gamino, S., Sotelo, F., Sosa, M., Caudillo, C.,
Holguin, G., Ramos, M., Mesa, F., Bernal, J. and
Cordova, T. (2008) Pulsed electromagnetic fields induced
femoral metaphyseal bone thickness changes in the rat.
Bioelectromagnetics, 29, 406-409. [10] Bland, J. M. and Altman, D.J. (1986) Regression analysis.
Lancet, 1, 908-909. [12] Martino, C.F., Perea, H., Hopfner, U., Ferguson, V.L. and
Wintermantel, E. (2010) Effects of weak static magnetic
fields on endothelial cells. Bioelectromagnetics, 31,
296-301.