Paper Menu >>
Journal Menu >>
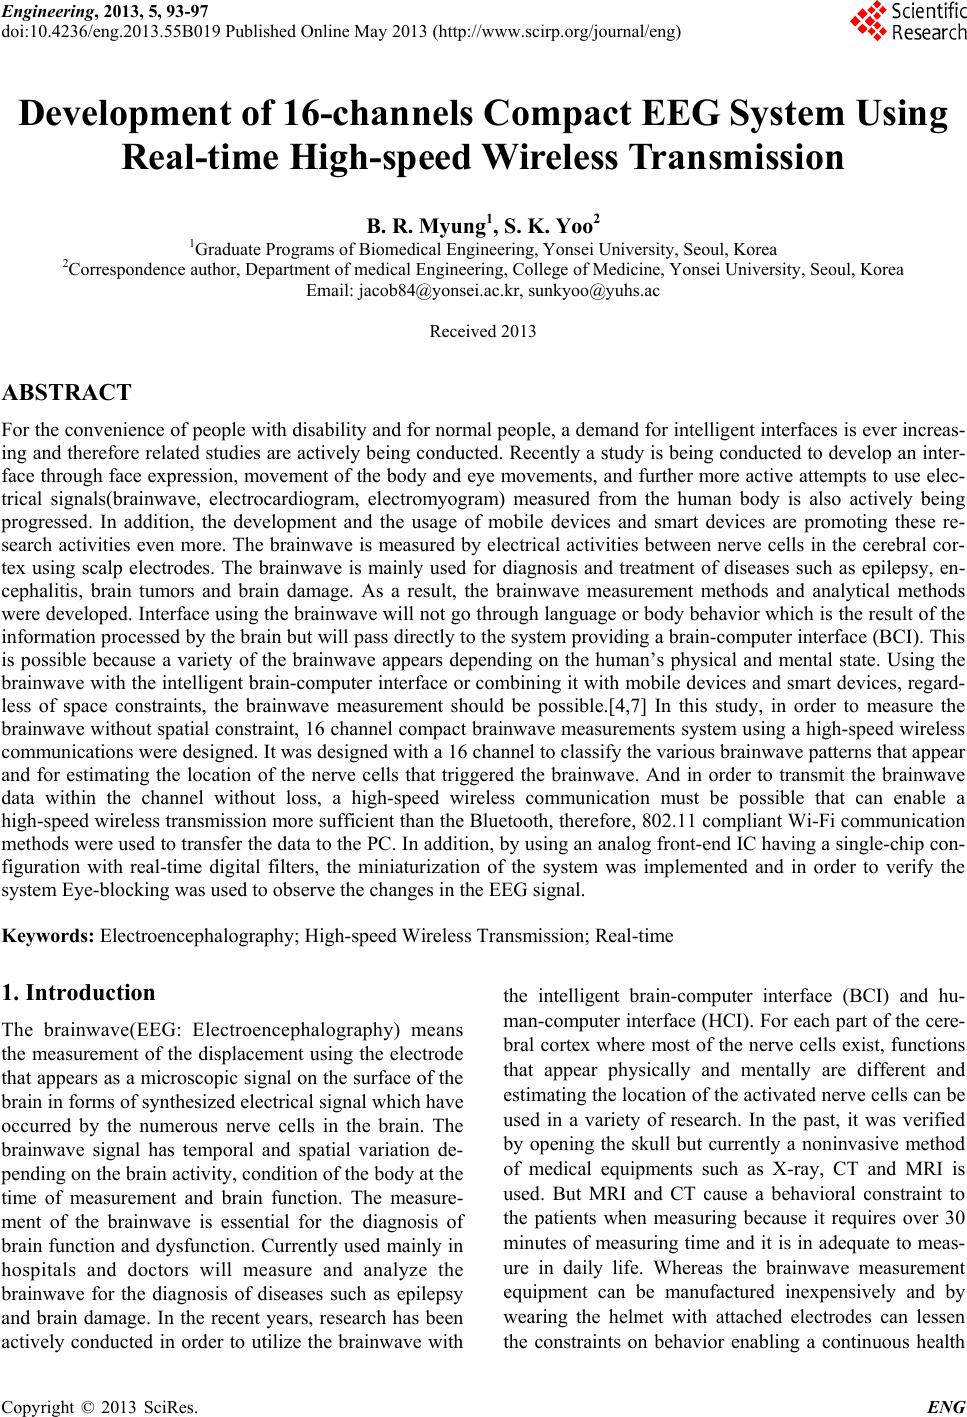 Engineering, 2013, 5, 93-97 doi:10.4236/eng.2013.55B019 Published Online May 2013 (http://www.scirp.org/journal/eng) Development of 16-channels Compact EEG System Using Real-time High-speed W ir eless Transmission B. R. Myung1, S. K. Yoo2 1Graduate Programs of Biomedical Engineering, Yonsei University, Seoul, Korea 2Correspondence author, Department of medical Engineering, College of Medicine, Yonsei University, Seoul, Korea Email: jacob84@yonsei.ac.kr, sunkyoo@yuhs.ac Received 2013 ABSTRACT For the convenien ce of people with disability and for normal people, a demand fo r intelligent interfaces is ev er increas- ing and therefore related studies are actively being conducted. Recently a study is being conducted to develop an inter- face through face expression, movement of the body and eye movements, and further more active attempts to use elec- trical signals(brainwave, electrocardiogram, electromyogram) measured from the human body is also actively being progressed. In addition, the development and the usage of mobile devices and smart devices are promoting these re- search activities even more. The brainwave is measured by electrical activities between nerve cells in the cerebral cor- tex using scalp electrodes. The brainwave is mainly used for diagnosis and treatment of diseases such as epilepsy, en- cephalitis, brain tumors and brain damage. As a result, the brainwave measurement methods and analytical methods were developed. Interface using the brainwave will not go through language or body behavior which is the result of the information processed by the brain but will pass directly to the system providing a brain-computer interface (BCI). This is possible because a variety of the brainwave appears depending on the human’s physical and mental state. Using the brainwave with the intelligent brain-computer interface or combining it with mobile devices and smart devices, regard- less of space constraints, the brainwave measurement should be possible.[4,7] In this study, in order to measure the brainwave without spatial constraint, 16 channel compact brainwave measurements system using a high-speed wireless communications were designed. It was designed with a 16 channel to classify the various brainwave patterns that appear and for estimating the location of the nerve cells that triggered the brainwave. And in order to transmit the brainwave data within the channel without loss, a high-speed wireless communication must be possible that can enable a high-speed wireless transmission more sufficient than the Bluetooth, therefore, 802.11 compliant Wi-Fi communication methods were used to transfer the data to the PC. In addition, by using an analog front-end IC having a single-chip con- figuration with real-time digital filters, the miniaturization of the system was implemented and in order to verify the system Eye-blocking was used to observe the changes in the EEG signal. Keywords: Electroencephalography; High-speed Wireless Transmission; Real-time 1. Introduction The brainwave(EEG: Electroencephalography) means the measurement of the displacement using the electrode that appears as a microscopic signal on the surface of the brain in forms of synthesized electrical signal which have occurred by the numerous nerve cells in the brain. The brainwave signal has temporal and spatial variation de- pending on the b rain activ ity, cond itio n of the bod y at the time of measurement and brain function. The measure- ment of the brainwave is essential for the diagnosis of brain function and dysfunction. Currently used mainly in hospitals and doctors will measure and analyze the brainwave for the diagnosis of diseases such as epilepsy and brain damage. In the recent years, research has been actively conducted in order to utilize the brainwave with the intelligent brain-computer interface (BCI) and hu- man-computer interface (HCI). For each part of the cere- bral cortex where most of the nerve cells exist, functions that appear physically and mentally are different and estimating the lo cation o f th e activated nerve cells can be used in a variety of research. In the past, it was verified by opening the skull but currently a noninvasive method of medical equipments such as X-ray, CT and MRI is used. But MRI and CT cause a behavioral constraint to the patients when measuring because it requires over 30 minutes of measuring time and it is in adequ ate to meas- ure in daily life. Whereas the brainwave measurement equipment can be manufactured inexpensively and by wearing the helmet with attached electrodes can lessen the constraints on behavior enabling a continuous health Copyright © 2013 SciRes. ENG 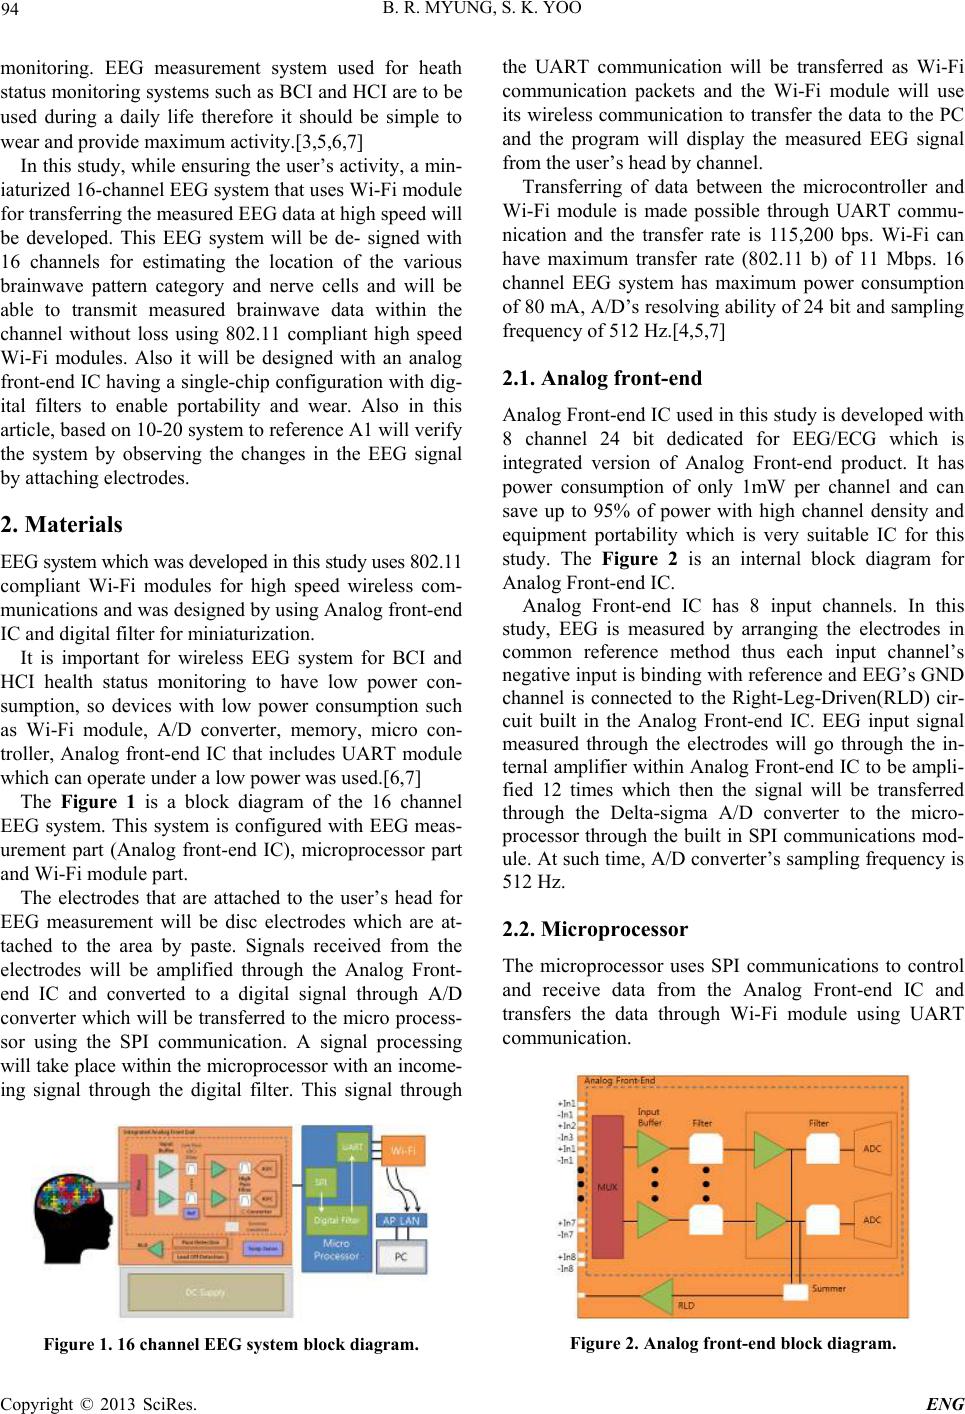 B. R. MYUNG, S. K. YOO 94 monitoring. EEG measurement system used for heath status monitoring systems such as BCI and HCI are to be used during a daily life therefore it should be simple to wear and provide maximum activity.[3,5,6,7] In this study, while ensuring the user’s activity, a min- iaturized 16-channel EEG system that uses Wi-Fi module for transferring the measured EEG data at high speed will be developed. This EEG system will be de- signed with 16 channels for estimating the location of the various brainwave pattern category and nerve cells and will be able to transmit measured brainwave data within the channel without loss using 802.11 compliant high speed Wi-Fi modules. Also it will be designed with an analog front-end IC having a sing le-chip configuration with dig- ital filters to enable portability and wear. Also in this article, based on 10-20 system to reference A1 will verify the system by observing the changes in the EEG signal by attaching electrodes. 2. Materials EEG system which was developed in this study uses 802.11 compliant Wi-Fi modules for high speed wireless com- munications and was designed by using Analog front-end IC and digital filter for miniaturization. It is important for wireless EEG system for BCI and HCI health status monitoring to have low power con- sumption, so devices with low power consumption such as Wi-Fi module, A/D converter, memory, micro con- troller, Analog front-end IC that includes UART module which can operate under a low power was used.[6,7] The Figure 1 is a block diagram of the 16 channel EEG system. This system is configured with EEG meas- urement part (Analog front-end IC), microprocessor part and Wi-Fi module part. The electrodes that are attached to the user’s head for EEG measurement will be disc electrodes which are at- tached to the area by paste. Signals received from the electrodes will be amplified through the Analog Front- end IC and converted to a digital signal through A/D converter which will be transferred to the micro process- sor using the SPI communication. A signal processing will take place within the microprocessor with an income- ing signal through the digital filter. This signal through Figure 1. 16 channel EEG system block diagram. the UART communication will be transferred as Wi-Fi communication packets and the Wi-Fi module will use its wireles s communication to tr ansfer the data to th e PC and the program will display the measured EEG signal from the user’s head by channel. Transferring of data between the microcontroller and Wi-Fi module is made possible through UART commu- nication and the transfer rate is 115,200 bps. Wi-Fi can have maximum transfer rate (802.11 b) of 11 Mbps. 16 channel EEG system has maximum power consumption of 80 mA, A/D’s resolving ability of 24 bit and sampling frequency of 512 Hz.[4,5,7] 2.1. Analog front-end Analog Front-end IC used in this study is developed with 8 channel 24 bit dedicated for EEG/ECG which is integrated version of Analog Front-end product. It has power consumption of only 1mW per channel and can save up to 95% of power with high channel density and equipment portability which is very suitable IC for this study. The Figure 2 is an internal block diagram for Analog Front-end IC. Analog Front-end IC has 8 input channels. In this study, EEG is measured by arranging the electrodes in common reference method thus each input channel’s negative inp ut is binding with refer ence and EEG’s GND channel is connected to the Right-Leg-Driven(RLD) cir- cuit built in the Analog Front-end IC. EEG input signal measured through the electrodes will go through the in- ternal amplifier within Analog Front-end IC to be ampli- fied 12 times which then the signal will be transferred through the Delta-sigma A/D converter to the micro- processor through the built in SPI communications mod- ule. At such time, A/D converter’s sampling frequency is 512 Hz. 2.2. Microprocessor The microprocessor uses SPI communications to control and receive data from the Analog Front-end IC and transfers the data through Wi-Fi module using UART communication. Figure 2. Analog front-end block diagram. Copyright © 2013 SciRes. ENG 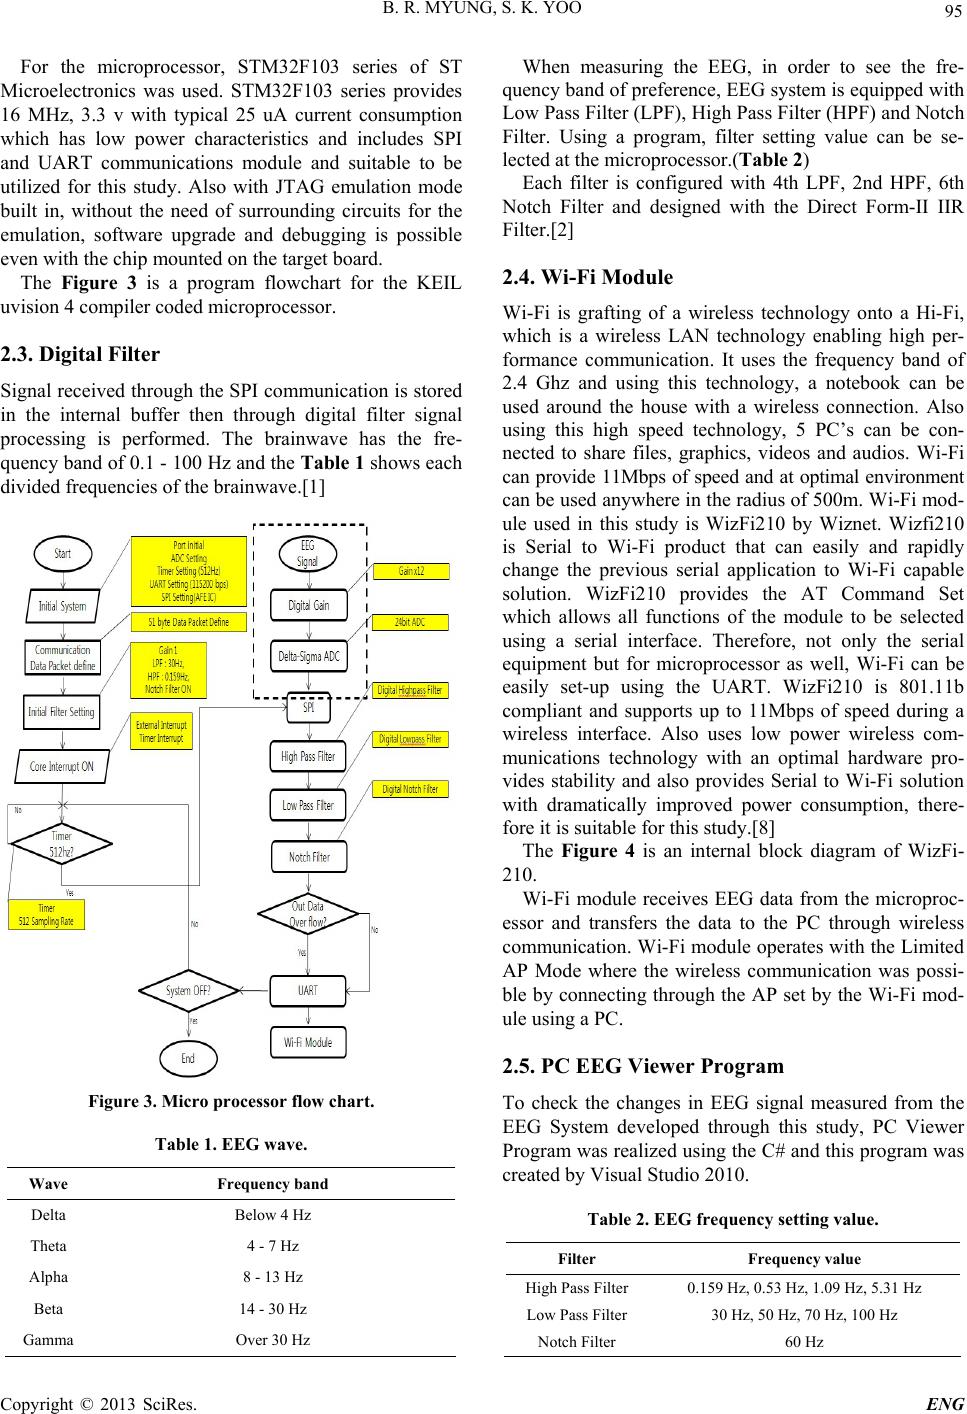 B. R. MYUNG, S. K. YOO 95 For the microprocessor, STM32F103 series of ST Microelectronics was used. STM32F103 series provides 16 MHz, 3.3 v with typical 25 uA current consumption which has low power characteristics and includes SPI and UART communications module and suitable to be utilized for this study. Also with JTAG emulation mode built in, without the need of surrounding circuits for the emulation, software upgrade and debugging is possible even with the chip mounted on the target board. The Figure 3 is a program flowchart for the KEIL uvision 4 compiler coded microprocessor. 2.3. Digital Filter Signal received through the SPI communication is stored in the internal buffer then through digital filter signal processing is performed. The brainwave has the fre- quency band of 0.1 - 100 Hz and the Table 1 shows each divided f requenci es of t he brainwave .[1] Figure 3. Micro processor flow chart. Table 1. EEG wave. Wave Frequency band Delta Below 4 Hz Theta 4 - 7 Hz Alpha 8 - 13 Hz Beta 14 - 30 Hz Gamma Over 30 Hz When measuring the EEG, in order to see the fre- quency band of preference, EEG system is equipped with Low Pass Filter (LPF), High Pass Filter (HPF) and No tch Filter. Using a program, filter setting value can be se- lected at the microprocessor.(Table 2) Each filter is configured with 4th LPF, 2nd HPF, 6th Notch Filter and designed with the Direct Form-II IIR Filter.[2] 2.4. Wi-Fi Module Wi-Fi is grafting of a wireless technology onto a Hi-Fi, which is a wireless LAN technology enabling high per- formance communication. It uses the frequency band of 2.4 Ghz and using this technology, a notebook can be used around the house with a wireless connection. Also using this high speed technology, 5 PC’s can be con- nected to share files, graphics, videos and audios. Wi-Fi can provide 11Mbps of speed and at optimal environment can be used anywhere in the radius of 500m. Wi-Fi mod- ule used in this study is WizFi210 by Wiznet. Wizfi210 is Serial to Wi-Fi product that can easily and rapidly change the previous serial application to Wi-Fi capable solution. WizFi210 provides the AT Command Set which allows all functions of the module to be selected using a serial interface. Therefore, not only the serial equipment but for microprocessor as well, Wi-Fi can be easily set-up using the UART. WizFi210 is 801.11b compliant and supports up to 11Mbps of speed during a wireless interface. Also uses low power wireless com- munications technology with an optimal hardware pro- vides stability and also provides Serial to Wi-Fi solution with dramatically improved power consumption, there- fore it is suitable for th is study.[8] The Figure 4 is an internal block diagram of WizFi- 210. Wi-Fi module receives EEG data from the microproc- essor and transfers the data to the PC through wireless communication. Wi-Fi module operates with the Limited AP Mode where the wireless communication was possi- ble by connecting through the AP set by the Wi-Fi mod- ule using a PC. 2.5. PC EEG Viewer Program To check the changes in EEG signal measured from the EEG System developed through this study, PC Viewer Program was realized using the C# and this program was created by Visual Studio 2010. Table 2. EEG frequency setting value. Filter Frequency value High Pass Filter 0.159 Hz, 0.53 Hz, 1.09 Hz, 5.31 Hz Low Pass Filter 30 Hz, 50 Hz, 70 Hz, 100 Hz Notch Filter 60 Hz Copyright © 2013 SciRes. ENG 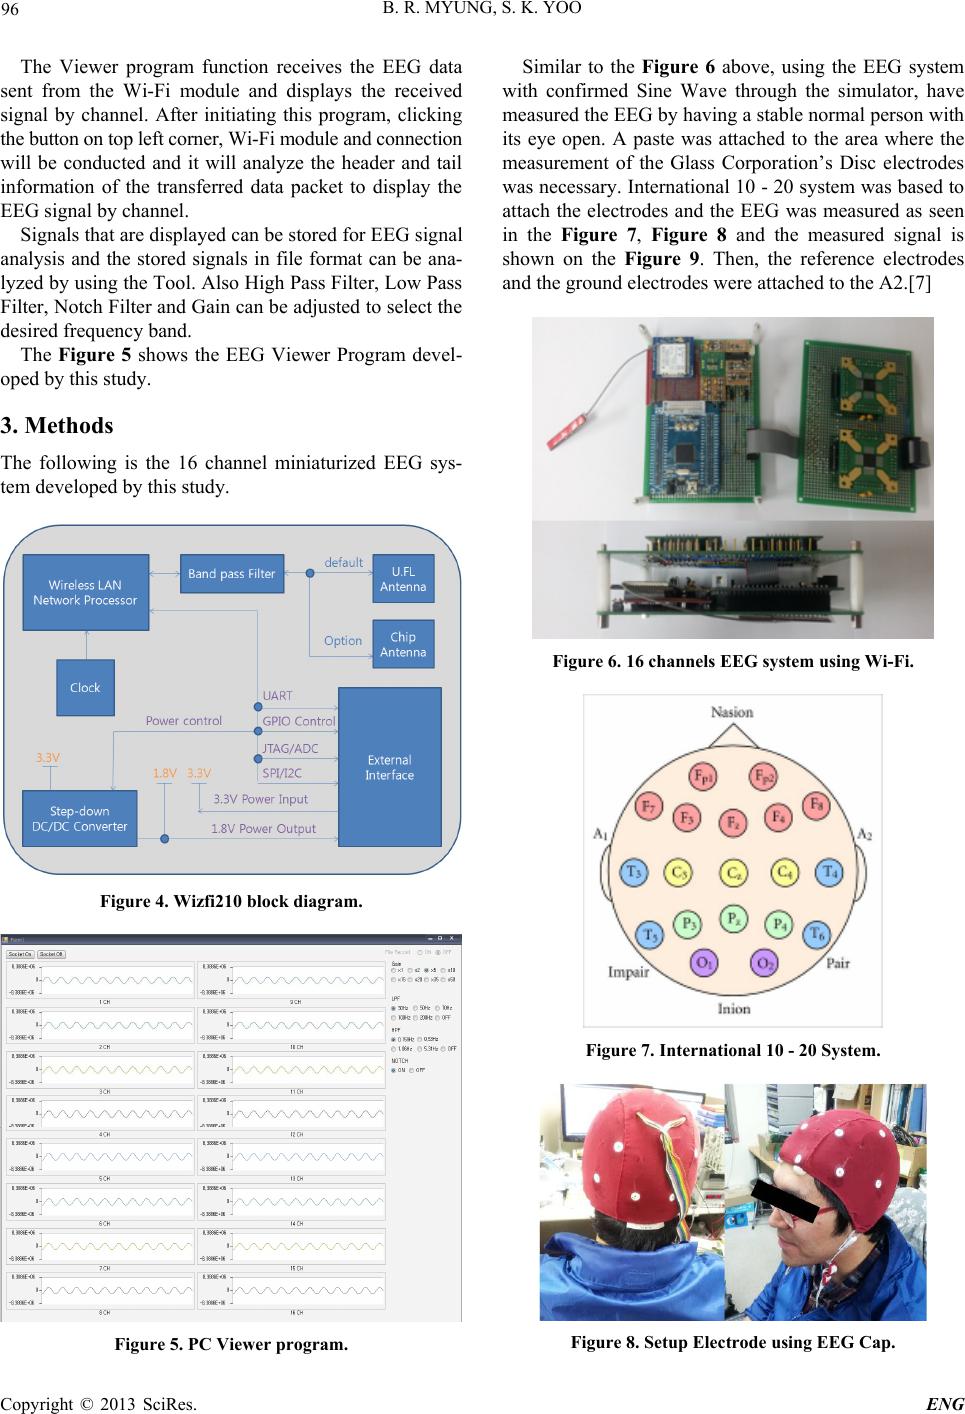 B. R. MYUNG, S. K. YOO 96 The Viewer program function receives the EEG data sent from the Wi-Fi module and displays the received signal by channel. After initiating this program, clicking the button on top left corner, Wi-Fi modul e and connection will be conducted and it will analyze the header and tail information of the transferred data packet to display the EEG signal by channel. Signals that are displayed can be stored for EEG signal analysis and the stored signals in file format can be ana- lyzed by using the Tool. Also High Pass Filter, Lo w Pass Filter, Notch Filter and Gain can be adjusted to select th e desired frequency ba n d. The Figure 5 shows the EEG Viewer Program devel- oped by this study. 3. Methods The following is the 16 channel miniaturized EEG sys- tem developed by this study. Figure 4. Wizfi210 block diagram. Figure 5. PC Viewer program. Similar to the Figure 6 above, using the EEG system with confirmed Sine Wave through the simulator, have measured the EEG by having a stable normal person with its eye open. A paste was attached to the area where the measurement of the Glass Corporation’s Disc electrodes was necessary. International 10 - 20 system was based to attach the electrodes and the EEG was measured as seen in the Figure 7, Figure 8 and the measured signal is shown on the Figure 9. Then, the reference electrodes and the ground electrodes were attached to the A2.[7] Figure 6. 16 channels EEG system using Wi-Fi. Figure 7. International 10 - 20 System. Figure 8. Setup Electrode using EEG Cap. Copyright © 2013 SciRes. ENG  B. R. MYUNG, S. K. YOO Copyright © 2013 SciRes. ENG 97 at O2 a signal was measured near the 13Hz and thus Al- pha Wave measurement was checked.[2] 4. Results In this study, 16 channel miniaturized EEG system using the Wi-Fi module’s real-time high speed wireless com- munication was designed and produced. And using this system to measure the EEG we have conducted an Eye-blocking test. Measuring the brainwave to be used with BCI and HCI health monitoring, it was necessary to develop a system that is easy to wear having the mobility during a daily life. To achieve this, in this study, a wire- less module was used to configure the system to reduce the activity constraint and also we have selected a single chip for configuration in order to miniaturize the system and to reduce power consumption controlling the single chip using a microprocessor. Also, using a high speed Wi-Fi module, a lot of data within the 16 channel was transferred without loss to the PC. Figure 9. Measurement EEG Signal. 5. Acknowledgements This work was supported by the National Research Foundation of Korea(NRF) grant funded by the Korea government(MEST) (No.2010-0026833) and supported by the Industrial Strategic Technology Development Program (10031977-2012-23) funded by the Ministry of Knowledge Economy (MKE, Korea) REFERENCES Figure 10. Stored EEG Data. [1] R. Cooper, J. W. Osselton and J. C. Shaw, “EEG Tech- nology- Third edition”, Butterworths&Co Ltd, 1980 [2] L. Sornmo and P. Laguna, “Bioelectrical Signal Process- ing in Cardiac and Neurological Applicaions,” Elsevier academic press. [3] J. D. Bayliss, “A Flexible Brain-Computer Interface,” University of Rochester, 2001 [4] Gilsup Song, “A Study Compact EEG Measurment Sys- tem Development Using Bluetooth and EEG Pattern Classification,” Chonnam national university, Gwangju, Korea. [5] L. Brown, J. van de Molengraft and C. Van Hoof, “A Low-Power, Wireless, 8-Channel EEG Monitoring Headset,” 32nd Annual International Conference of the IEEE EMBS, 2 010 Figure 11. Power Spectrum of EEG Signal. [6] Ching-Sung Wang, “Design of a 32-Channel EEG Sys- tem for Brain Control Interface Applications,” Journal of Biomedicine and Biotechnology, Vol. 2012, Article ID 274939, 2012. doi :10.1155/2012/274939 In order to analyze the signal by storing it as the data, the data was brought from the Complexity. Complexity is a program for analyzing the measured signal. Stored EEG data can be seen in the Figure 10. [7] M. Modarreszadeh and R. N. Schmidt, “Wireless, 32-Channel, EEG and Epliepsy Monitoring System,” Proceedings of 19th International Conference, IEEE/EMBS 1997, Chicago, IL. USA. As in Figure 11, a power spectrum for the stored sig- nal was checked. The Figure 11 is a measurement of EEG Signal(top) from Fz and EEG signal(bottom) from O2. Both graphs were measured with an eyes closed and [8] Wiznet, “WizFi210 User Manual V1.14,” 2013, www.wiznet.co.kr. |