Paper Menu >>
Journal Menu >>
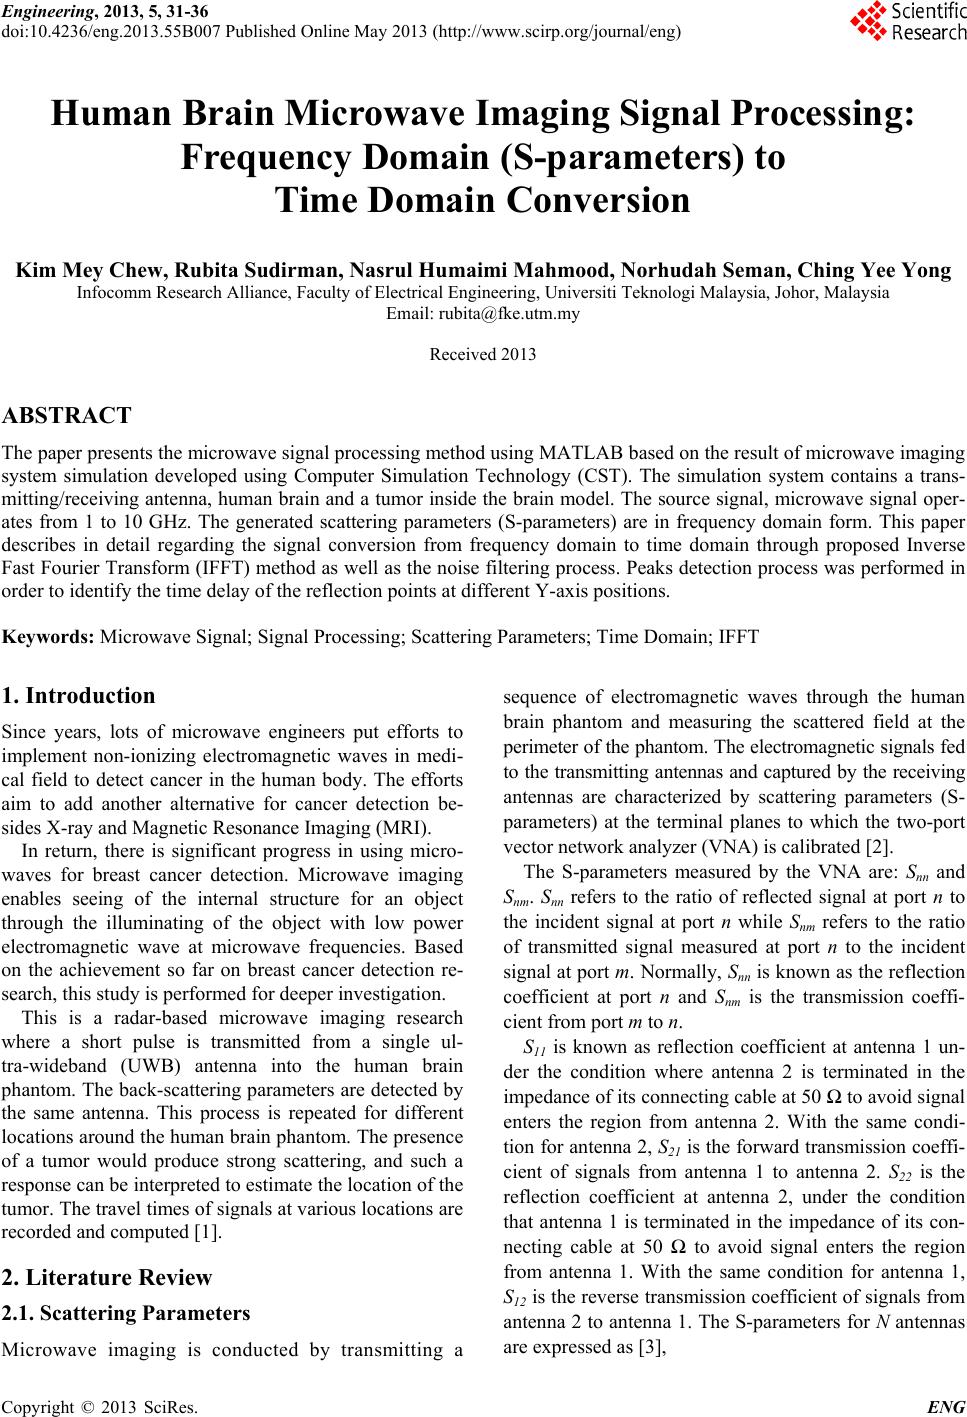 Engineering, 2013, 5, 31-36 doi:10.4236/eng.2013.55B007 Published Online May 2013 (http://www.scirp.org/journal/eng) Human Brain Microwave Imaging Signal Processing: Frequency Domain (S-parameters) to Time Domain Conversion Kim Mey Chew, Rubita Sudirman, Nasrul Humaimi Mahmood, Norhudah Seman, Ching Yee Yong Infocomm Research Alliance, Faculty of Electrical Engineering, Universiti Teknologi Malaysia, Johor, Malaysia Email: rubita@fke.utm.my Received 2013 ABSTRACT The paper presents the microwave signal processing method using MATLAB based on the result of microwave imaging system simulation developed using Computer Simulation Technology (CST). The simulation system contains a trans- mitting/receiving antenna, human brain and a tumor inside the brain model. The source signal, microwave signal oper- ates from 1 to 10 GHz. The generated scattering parameters (S-parameters) are in frequency domain form. This paper describes in detail regarding the signal conversion from frequency domain to time domain through proposed Inverse Fast Fourier Transform (IFFT) method as well as the noise filtering process. Peaks detection process was performed in order to identify the time delay of the reflection points at different Y-axis positions. Keywords: Microwave Signal; Signal Processing; Scattering Parameters; Time Domain; IFFT 1. Introduction Since years, lots of microwave engineers put efforts to implement non-ionizing electromagnetic waves in medi- cal field to detect cancer in the human body. The efforts aim to add another alternative for cancer detection be- sides X-ray and Magnetic Resonance Imaging (MRI). In return, there is significant progress in using micro- waves for breast cancer detection. Microwave imaging enables seeing of the internal structure for an object through the illuminating of the object with low power electromagnetic wave at microwave frequencies. Based on the achievement so far on breast cancer detection re- search, this study is performed for deeper investigation. This is a radar-based microwave imaging research where a short pulse is transmitted from a single ul- tra-wideband (UWB) antenna into the human brain phantom. The back-scattering parameters are detected by the same antenna. This process is repeated for different locations around the human brain phantom. The presence of a tumor would produce strong scattering, and such a response can be interpreted to estimate the location of the tumor. The travel times of signals at various locations are recorded and computed [1]. 2. Literature Review 2.1. Scattering Parameters Microwave imaging is conducted by transmitting a sequence of electromagnetic waves through the human brain phantom and measuring the scattered field at the perimeter of the phantom. The electromagnetic signals fed to the transmitting antennas and captured by the receiving antennas are characterized by scattering parameters (S- parameters) at the terminal planes to which the two-port vector network analyzer (VNA) is calibrated [2]. The S-parameters measured by the VNA are: Snn and Snm. Snn refers to the ratio of reflected signal at port n to the incident signal at port n while Snm refers to the ratio of transmitted signal measured at port n to the incident signal at port m. Normally, Snn is known as the reflection coefficient at port n and Snm is the transmission coeffi- cient from port m to n. S11 is known as reflection coefficient at antenna 1 un- der the condition where antenna 2 is terminated in the impedance of its connecting cable at 50 Ω to avoid signal enters the region from antenna 2. With the same condi- tion for antenna 2, S21 is the forward transmission coeffi- cient of signals from antenna 1 to antenna 2. S22 is the reflection coefficient at antenna 2, under the condition that antenna 1 is terminated in the impedance of its con- necting cable at 50 Ω to avoid signal enters the region from antenna 1. With the same condition for antenna 1, S12 is the reverse transmission coefficient of signals from antenna 2 to antenna 1. The S-parameters for N antennas are expressed as [3], Copyright © 2013 SciRes. ENG 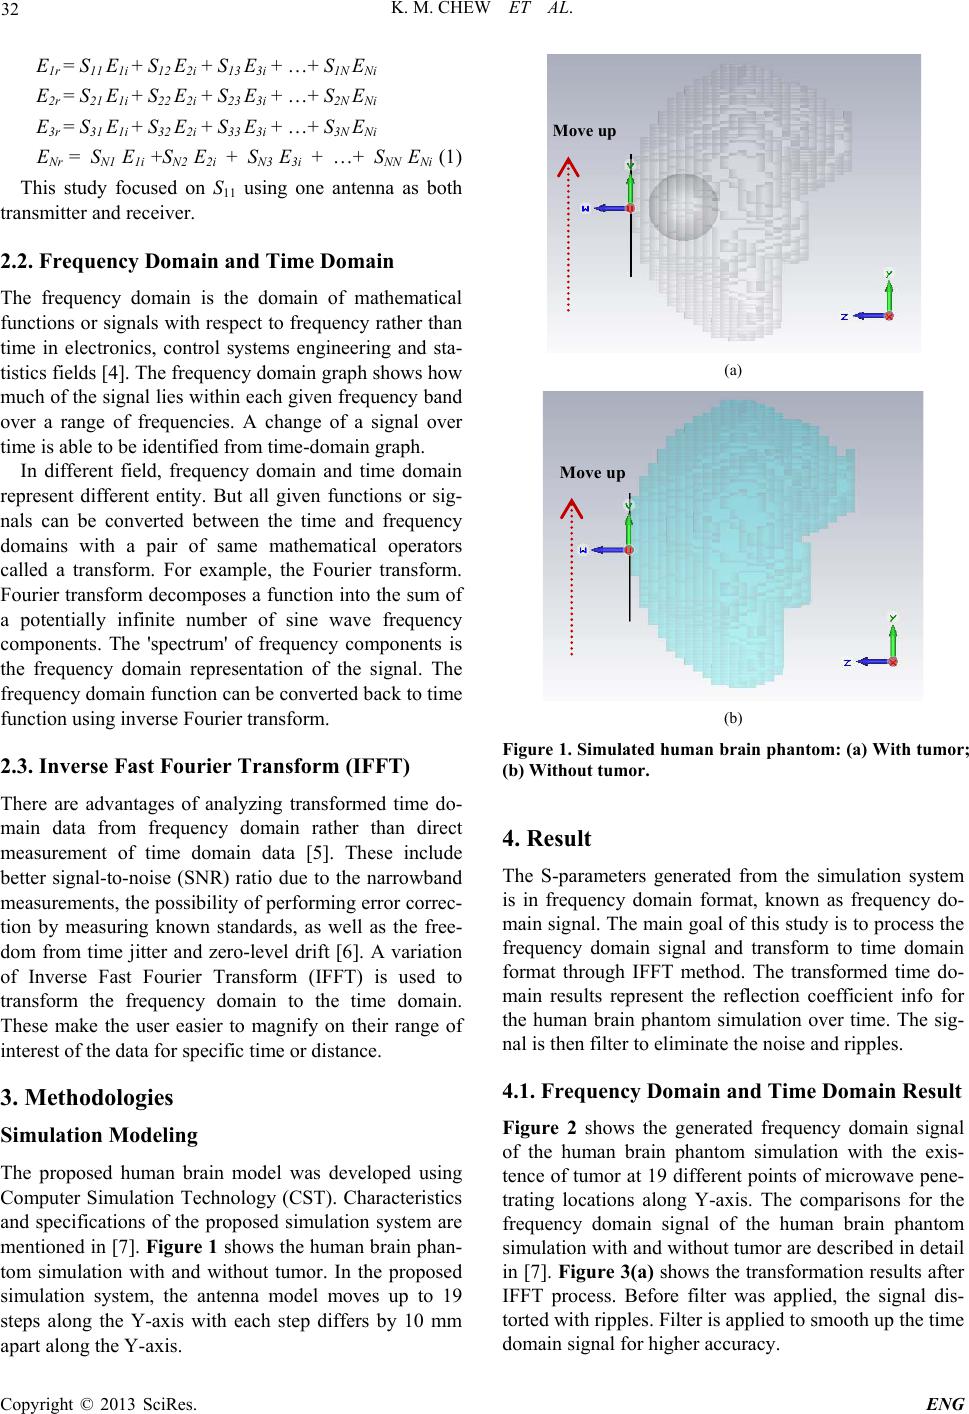 K. M. CHEW ET AL. 32 E1r = S11 E1i + S12 E2i + S13 E3i + …+ S1N ENi E2r = S21 E1i + S22 E2i + S23 E3i + …+ S2N ENi E3r = S31 E1i + S32 E2i + S33 E3i + …+ S3N ENi ENr = SN1 E1i +SN2 E2i + SN3 E3i + …+ SNN ENi (1) This study focused on S11 using one antenna as both transmitter and receiver. 2.2. Frequency Domain and Time Domain The frequency domain is the domain of mathematical functions or signals with respect to frequency rather than time in electronics, control systems engineering and sta- tistics fields [4]. The frequency domain graph shows how much of the signal lies within each given frequency band over a range of frequencies. A change of a signal over time is able to be identified from time-domain graph. In different field, frequency domain and time domain represent different entity. But all given functions or sig- nals can be converted between the time and frequency domains with a pair of same mathematical operators called a transform. For example, the Fourier transform. Fourier transform decomposes a function into the sum of a potentially infinite number of sine wave frequency components. The 'spectrum' of frequency components is the frequency domain representation of the signal. The frequency domain function can be converted back to time function using inverse Fourier transform. 2.3. Inverse Fast Fourier Transform (IFFT) There are advantages of analyzing transformed time do- main data from frequency domain rather than direct measurement of time domain data [5]. These include better signal-to-noise (SNR) ratio due to the narrowband measurements, the possibility of performing error correc- tion by measuring known standards, as well as the free- dom from time jitter and zero-level drift [6]. A variation of Inverse Fast Fourier Transform (IFFT) is used to transform the frequency domain to the time domain. These make the user easier to magnify on their range of interest of the data for specific time or distance. 3. Methodologies Simulation Modeling The proposed human brain model was developed using Computer Simulation Technology (CST). Characteristics and specifications of the proposed simulation system are mentioned in [7]. Figure 1 shows the human brain phan- tom simulation with and without tumor. In the proposed simulation system, the antenna model moves up to 19 steps along the Y-axis with each step differs by 10 mm apart along the Y-axis. Move up (a) Move up (b) Figure 1. Simulated human brain phantom: (a) With tumor; (b) Without tumor. 4. Result The S-parameters generated from the simulation system is in frequency domain format, known as frequency do- main signal. The main goal of this study is to process the frequency domain signal and transform to time domain format through IFFT method. The transformed time do- main results represent the reflection coefficient info for the human brain phantom simulation over time. The sig- nal is then filter to eliminate the noise and ripples. 4.1. Frequency Domain and Time Domain Result Figure 2 shows the generated frequency domain signal of the human brain phantom simulation with the exis- tence of tumor at 19 different points of microwave pene- trating locations along Y-axis. The comparisons for the frequency domain signal of the human brain phantom simulation with and without tumor are described in detail in [7]. Figure 3(a) shows the transformation results after IFFT process. Before filter was applied, the signal dis- torted with ripples. Filter is applied to smooth up the time domain signal for higher accuracy. Copyright © 2013 SciRes. ENG 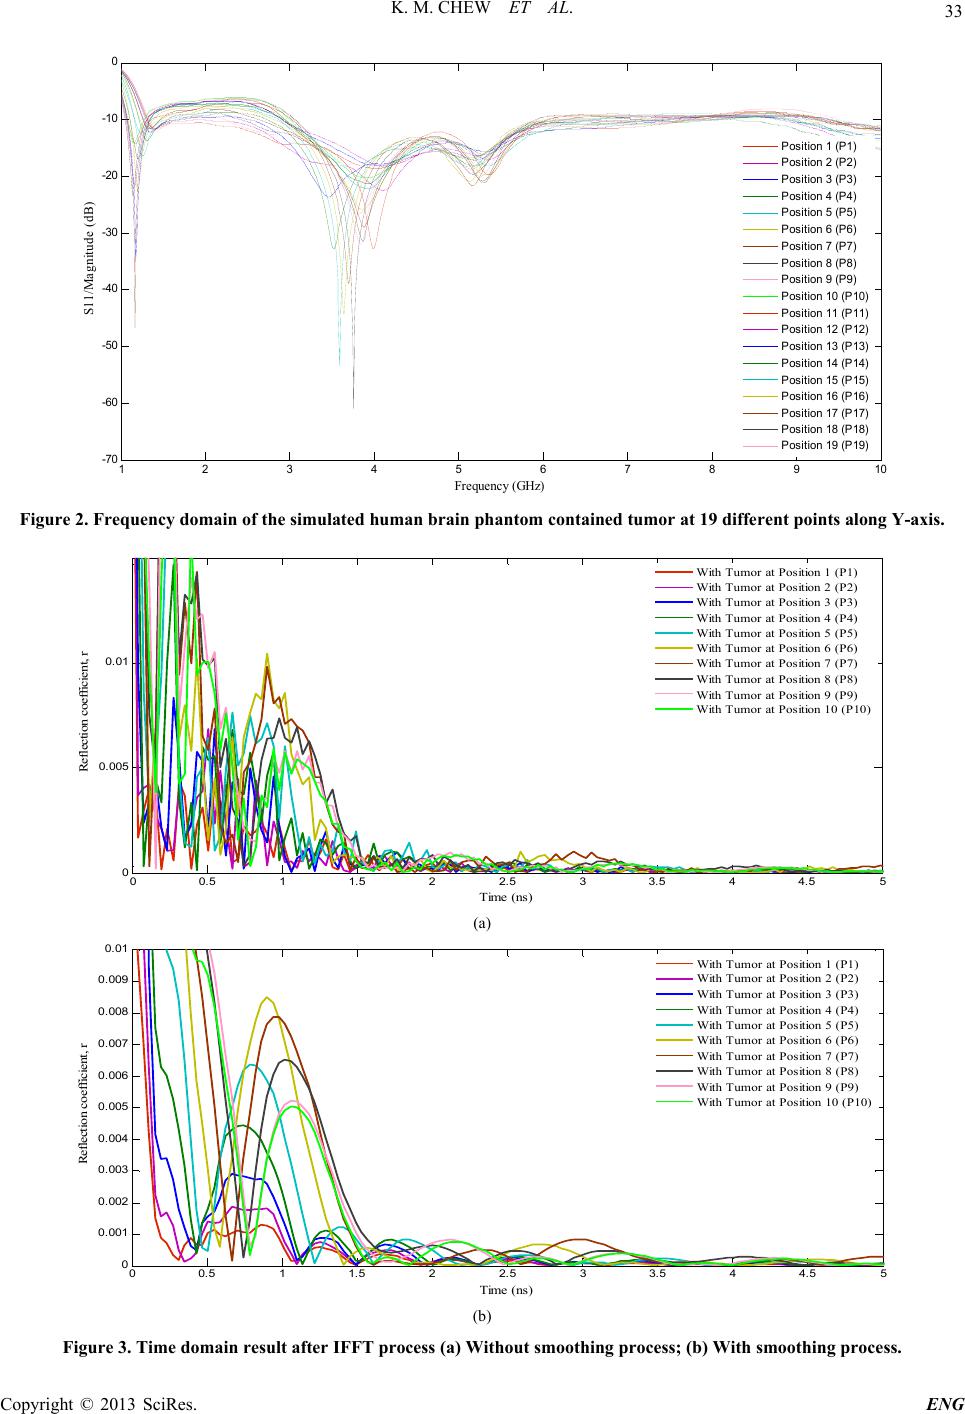 K. M. CHEW ET AL. Copyright © 2013 SciRes. ENG 33 12345678910 -70 -60 -50 -40 -30 -20 -10 0 Frequency (GHz) S11/Magnitude (dB) P os iti on 1 (P1) P os iti on 2 (P2) P os iti on 3 (P3) P os iti on 4 (P4) P os iti on 5 (P5) P os iti on 6 (P6) P os iti on 7 (P7) P os iti on 8 (P8) P os iti on 9 (P9) P osi ti o n 10 (P 10) P osi ti o n 11 (P 11) P osi ti o n 12 (P 12) P osi ti o n 13 (P 13) P osi ti o n 14 (P 14) P osi ti o n 15 (P 15) P osi ti o n 16 (P 16) P osi ti o n 17 (P 17) P osi ti o n 18 (P 18) P osi ti o n 19 (P 19) Figure 2. Frequency domain of the simulated human brain ph antom c ontained tumor at 19 different points along Y-axis. 00.5 11.5 22.5 33.5 44.5 5 0 0.005 0.01 Time (ns) Reflection coefficient, r With Tumor at Position 1 (P1) With Tumor at Position 2 (P2) With Tumor at Position 3 (P3) With Tumor at Position 4 (P4) With Tumor at Position 5 (P5) With Tumor at Position 6 (P6) With Tumor at Position 7 (P7) With Tumor at Position 8 (P8) With Tumor at Position 9 (P9) With Tumor at Position 10 (P10) (a) 00.5 11.5 22.5 33.5 44.5 5 0 0.001 0.002 0.003 0.004 0.005 0.006 0.007 0.008 0.009 0.01 Time (ns) Reflection coefficient, r With Tumor at Position 1 (P1) With Tumor at Position 2 (P2) With Tumor at Position 3 (P3) With Tumor at Position 4 (P4) With Tumor at Position 5 (P5) With Tumor at Position 6 (P6) With Tumor at Position 7 (P7) With Tumor at Position 8 (P8) With Tumor at Position 9 (P9) With Tumor at Position 10 (P10) (b) Figure 3. Time domain result after IFFT process (a) Without smoothing process; (b) With smoothing process. 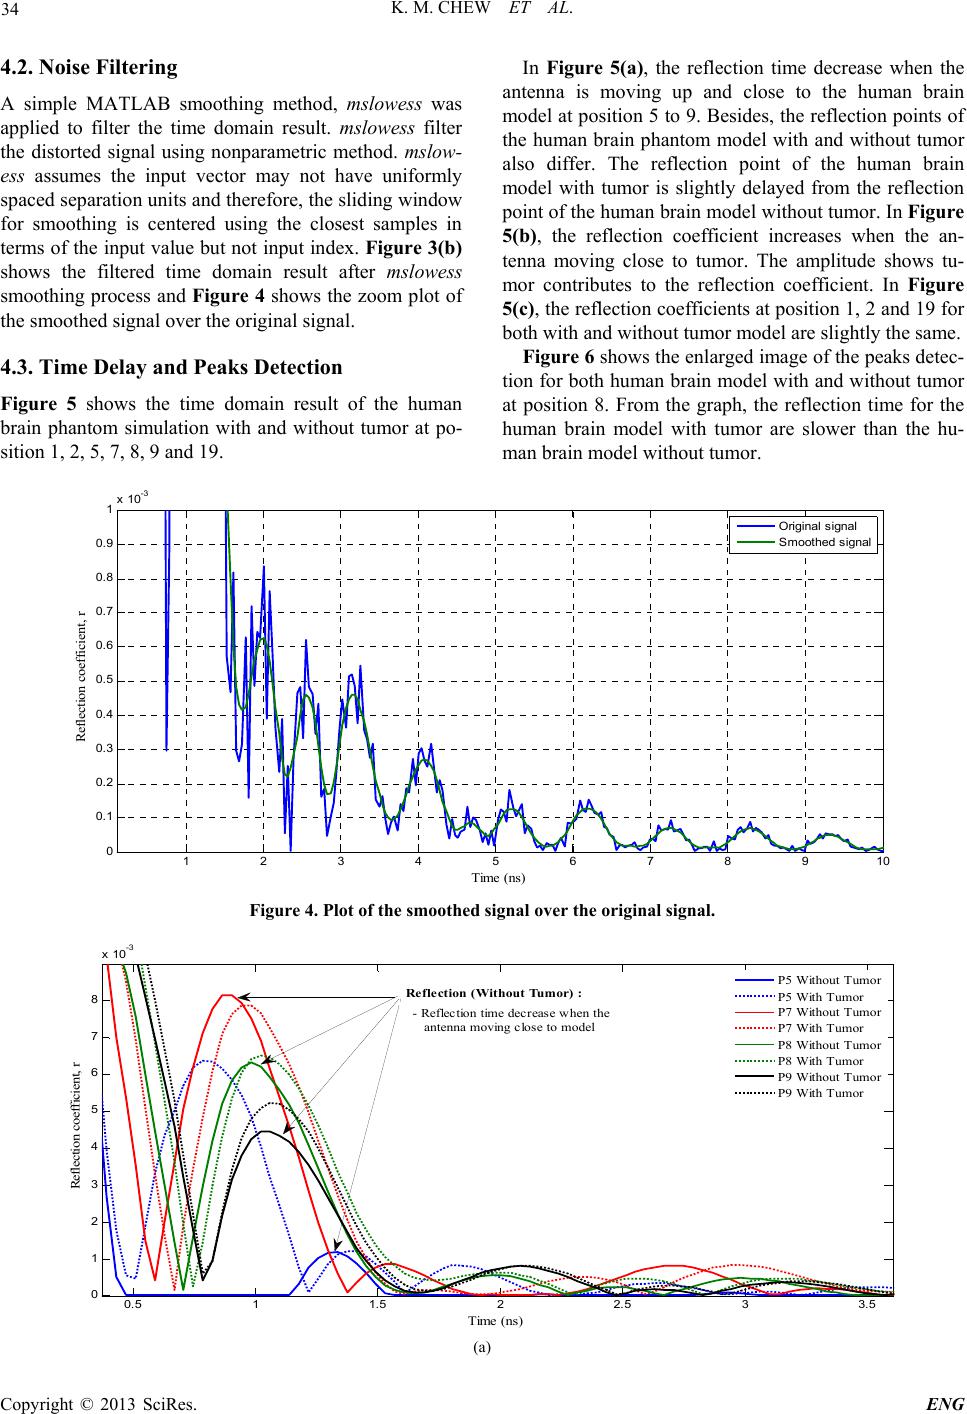 K. M. CHEW ET AL. 34 4.2. Noise Filtering A simple MATLAB smoothing method, mslowess was applied to filter the time domain result. mslowess filter the distorted signal using nonparametric method. mslow- ess assumes the input vector may not have uniformly spaced separation units and therefore, the sliding window for smoothing is centered using the closest samples in terms of the input value but not input index. Figure 3(b) shows the filtered time domain result after mslowess smoothing process and Figure 4 shows the zoom plot of the smoothed signal over the original signal. 4.3. Time Delay and Peaks Detection Figure 5 shows the time domain result of the human brain phantom simulation with and without tumor at po- sition 1, 2, 5, 7, 8, 9 and 19. In Figure 5(a), the reflection time decrease when the antenna is moving up and close to the human brain model at position 5 to 9. Besides, the reflection points of the human brain phantom model with and without tumor also differ. The reflection point of the human brain model with tumor is slightly delayed from the reflection point of the human brain model without tumor. In Figure 5(b), the reflection coefficient increases when the an- tenna moving close to tumor. The amplitude shows tu- mor contributes to the reflection coefficient. In Figure 5(c), the reflection coefficients at position 1, 2 and 19 for both with and without tumor model are slightly the same. Figure 6 shows the enlarged image of the peaks detec- tion for both human brain model with and without tumor at position 8. From the graph, the reflection time for the human brain model with tumor are slower than the hu- man brain model without tumor. 12345678910 0 0.1 0.2 0.3 0.4 0.5 0.6 0.7 0.8 0.9 1x 10 -3 Time (ns) Reflection coefficient, r Original signal S moot hed si gnal Figure 4. Plot of the smoothed signal over the original signal. 0.5 11.5 22.5 33.5 0 1 2 3 4 5 6 7 8 x 10 -3 Time (ns) Reflection coefficient, r P5 Without Tumor P5 With Tumor P7 Without Tumor P7 With Tumor P8 Without Tumor P8 With Tumor P9 Without Tumor P9 With Tumor Reflection (Without Tumor) : - Reflection time decrease when the antenna moving close to model (a) Copyright © 2013 SciRes. ENG  K. M. CHEW ET AL. 35 0.5 11.5 22.5 33.5 0 1 2 3 4 5 6 7 8 x 10 -3 Time (ns) Reflection coefficient, r P5 Without Tumor P5 With Tumor P7 Without Tumor P7 With Tumor P8 Without Tumor P8 With Tumor P9 Without Tumor P9 With Tumor Reflection (WithTumor) : - Reflection coefficient increase when the antenna moving close to tumor (b) 00.5 11.5 22.5 33.5 44.5 5 0 0.5 1 1.5 2 2.5 3 x 10 -3 Time (ns) Reflection coefficient, r P1 Without Tumor P1 With Tumor P2 Without Tumor P2 With Tumor P19 Without Tumor P19 With Tumor (c) Figure 5. Comparison of time domain result of the simulated human brain phantom with and without tumor. 0.5 11.5 22.5 33.5 44.5 5 0 1 2 3 4 5 6 7 8 9 x 10 -3 X: 1.06 Y: 0.004438 Time(ns) X: 2.082 Y: 0.0008043 X: 1.06 Y: 0.005211 X: 3.181 Y: 0.000373 X: 2.121 Y: 0.00081X: 3.221 Y: 0.0003851X: 4.203 Y: 0.0002179X: 4.281 Y: 0.0002351 Reflection coefficient, r Without Tumor maximum point minimum point With Tumor maximum point minimum point Figure 6. Time domain peaks detection at P8. Copyright © 2013 SciRes. ENG  K. M. CHEW ET AL. Copyright © 2013 SciRes. ENG 36 5. Discussion The S-parameters results were generated by the simula- tion system using the licensed CST software. The simu- lation system will be enhanced in future by developing more models with different specifications for measure- ments. As shown in Figure 5(a), the reflection times were decrease when the antenna is moving up close to the hu- man brain model. This effect was caused by the spherical shape of the human brain model which signals are always reaching to the outer layer of the human brain model at different point of time. The increment of reflection coef- ficient in Figure 5(b) shows both models at the same position were affected by tumor model. Based on these findings, peaks detection was applied to the transformed time domain signal to mark the reflec- tion points. Image processing was applied to the list of reflection points in order to produce a spatial domain image of the simulation with clearly describing the loca- tion of tumor inside the human brain phantom. 6. Conclusions The obtained S-parameters result was successfully trans- formed into the time domain format using IFFT method. The mslowess smoothing process is filtered up all the noise for a more accurate transformed time domain sig- nal. IFFT was applied to the reflection points of the sig- nal since the time domain signal is appeared easier for visualization and analysis. The reflection points are then processed to produce a spatial domain image of the hu- man brain model with an estimated tumor location. The study is still in a preliminary stage and for future work, different models are developed and processed to enhance the current method in order to develop a human brain tumor detection algorithm. 7. Acknowledgements The authors are deeply indebted and would like to ex- press our gratitude to the Universiti Teknologi Malaysia for supporting and funding this study under Research Universiti Grant (Q.J130000.2636.05J69). As well as Ministry of Science, Technology and Innovation (MO- STI) grant support (4S056) and MyPhd Scholarship Scheme from Ministry of Higher Education (MOHE). Our appreciation also goes to the Electronics and Bio- medical Instrumentation (bMIE) for their cooperation in the research work. REFERENCES [1] E. C. Fear, “Microwave Imaging of the Breast,” Tech- nology in Cancer Research & Treatment, Vol. 4, 2005, pp. 69-82. [2] G. A. Ybarra, Q. H. Liu, S. P. John and T. J. William, “Chapter 16: Microwave Breast Imaging. Emerging Technology in Breast Imaging and Mammography,” American Scientific Publishers, California, USA, 2007. [3] W. T. Joines, Q. H. Liu and G. A. Ybarra, “Handbook of Biological Effects of Electromagnetic Fields,” CRC Press, Boca Raton, FL, 2005. [4] S. A. Broughton and K. Bryan, “Discrete Fourier Analy- sis and Wavelets: Applications to Signal and Image Proc- essing,”New York: Wiley, 2008, p. 72. [5] M. E. Hines and H. E. Stinehelfer, “Time-Domain Oscil- lographic Microwave Network Analysis Using Fre- quency-Domain Data,” lEEE Trans. Microwave Theory Tech., Vol. MTT-22, No. 3, 1974, pp. 276-282. [6] Ulriksson and Bengt, “Conversion of frequency-domain data to the time domain,” Proceedings of the IEEE , Vol. 74, No. 1, 1986, pp. 74-77. [7] K.-M. Chew, R. Sudirman, N. H. Mahmood, N. Seman and C.-Y. Yong, “Human Brain Microwave Imaging Simulation System Using Computer Simulation Tech- nology (CST),” ICIPT2013: 2013 8th International Con- ference On Information Processing, Management and In- telligent Information Technology (ICIPM, ICIIP), In press. |