Engineering, 2013, 5, 20-24
doi:10.4236/eng.2013.55B005 Published Online May 2013 (http://www.scirp.org/journal/eng)
Jogging and Walking Analysis Using Wearable Sensors*
Ching Yee Yong, Rubita Sudirman, Ahmad Hazwan Ab Rahim,
Nasrul Humaimi Mahmood, Kim Mey Chew
Infocomm Research Alliance, Faculty of Electrical Engineering, Universiti Teknologi Malaysia, Johor, Malaysia
Email: rubita@fke.utm.my
Received 2013
ABSTRACT
Gait analysis is a process of learning the motion of human and animal by using wearable sensor approach and vision
approach. This analysis is mainly used in medical and sports field where the study of body parts is crucial. 3-space sen-
sor is a sensor consists of accelerometer, gyroscope sensor and compass sensor, built in one device. In this study,
3-space sensor is used to collect data of walking and jogging motion, of a test subject running on a treadmill. Angular
velocity of the test subject’s arm and the angle of subject’s leaping motion are the two main components under investi-
gation. Data are analyzed and processed with Principal of Component Analysis (PCA) technique. This method aims to
combine and reduce the number of variables of the raw data. The Quiver function is used in order to generate feature
vectors for both motions. Furthermore, the output of the process was used to create a system that can recognize human
motion on any given data. The system is highly able to differentiate both of the motions.
Keywords: Accelerometer; Gyroscope; Motion; Wearable Sensor; Leaping
1. Introduction
Gait analysis is a study about movement of animal, or in
other words, a study of animal locomotion, with the aim
to analyze human motions, which is widely used in
medical purposes. This implementation is crucial to il-
lustrate the different body dynamics which depend on the
test subjects’ conditions, as stated in [1].
This analysis can be done by using two methods. The
first method, which is classified as vision based approach,
using video camera to record the movement of the sub-
ject. The second method is using wearable sensor, by
attaching a tri-axial sensor to the upper limb of the test
subject to generate sets of motion data.
In this paper, the second method is implemented.
3-space sensor is attached on the test subject to acquire
the motion data. Graphs were generated to represent the
orientations, rotation and acceleration (force) of the mo-
tion which are walking and jogging. A system is devel-
oped to recognize and differentiate these motions.
2. Research Review
Gait analysis is a very important study of human loco-
motive that give a great advantage in sports and medical
purposes. Zhou et al. [2] used multiple wearable inertial
sensors on upper limb motion tracking to give appropri-
ate assessment to the stroke patients before they are dis-
charged from the hospital after their movements are
comparable to the normal movement of human. Other
than that, Liu et al. [3] used wearable sensor approach in
gait recognition experiment, where the movement of a
subject was used to recognize that particular individual.
This is one of the application using wearable sensors as a
domain in biometric identification.
3-space sensor consists of 3 types of sensor, tri-axial
accelerometer, tri-axial gyroscope and tri-axial compass
which is built in one device [4] as shown in Figure 1.
Some experiment needed three types of sensor to evalu-
ate the entire motions component, but this device can
generate data for all components simultaneously in one
move by the subject.
Accelerometer sensor: this sensor can sense accelera-
tion by gravitational force and the acceleration of moving
body. Measured in g. 1g equals to 9.81 m/s2, which is the
value of acceleration of gravitational force. Gyroscope
*Motion classification using angular velocity and leaping angle. Figure 1. 3-space sensor axis orientations.
Copyright © 2013 SciRes. ENG
C. Y. YONG ET AL. 21
sensor: this sensor measure angular velocity in rad/s. Com-
pass: measures rotation angle with earth magnetic pole as
references. Hence, any magnetic or metal object might
disrupt the reading of this sensor, measured in degree.
3. Materials and Methods
3.1. Data Collection
A test subject was selected and his movement was evalu-
ated thoroughly to differentiate the motion of a subject.
The subject for this experiment is a healthy male indi-
vidual, with the age of 23, without medical record of
defect or other sicknesses. The test subject was attached
with the 3-space sensor on his upper arm, for jogging and
walking assessment. These motions were performed on a
controlled treadmill with wireless connection from the
sensor to the wireless dongle. Treadmill was used as a
medium for test subject to perform a regular motion with
lowest bias.
A preliminary speed testing was done before collecting
any data. The test subject needs to perform a normal
walk and jog on ground for a distance of 10 meter. Time
was stamped to record the period for the test subject to
cover up the activities. Hence, the test subject’s normal
walking and jogging speed was identified with walking
3.7 feet/second and jogging 6.5 feet/second. This infor-
mation was used as speed setting of the treadmill.
For walking motion, the test subject was asked to per-
form a normal walking on the treadmill with speed of 3.7
feet/second for a 10 meter, 15 meter, 20 meter, 25 meter
and 30 meter as a session. Then, every single session was
repeated 10 times for each of the different distance. Jog-
ging activity with speed 6.5 feet/second was performed
using the same characteristics of the walking activity.
Thus 50 sets of data for jogging and walking motion
were logged by the sensor were saved in .txt file.
3.2. Angular Velocity
The leg and arm are playing important role in human
motion. These two components are moving in a periodi-
cal wave while the test subject is performing jogging and
walking activities. The arm of the subject is the main
focus of the study.
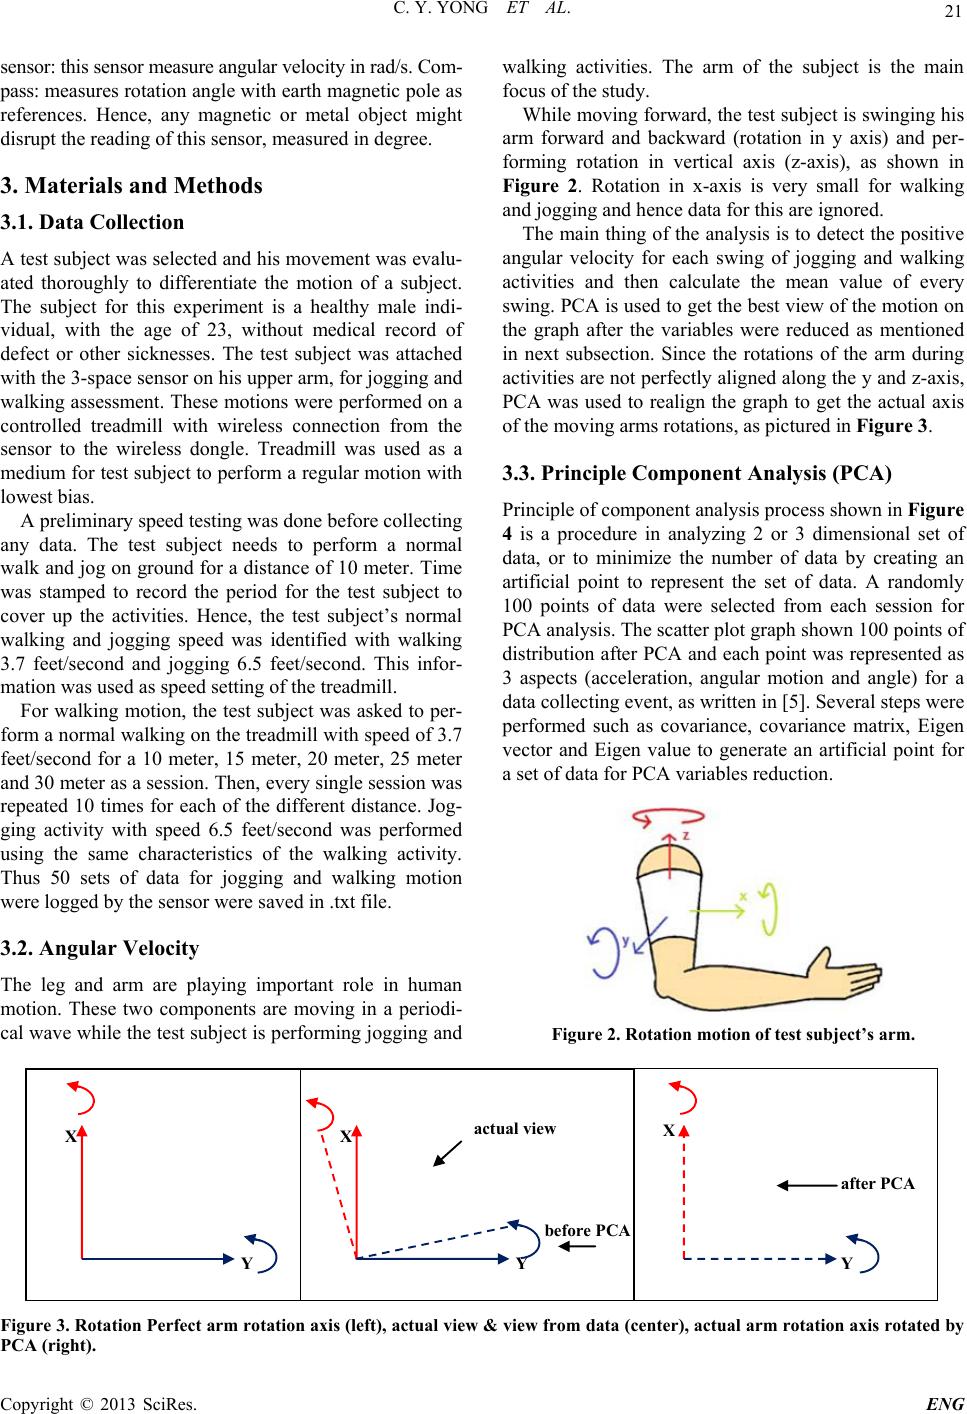
While moving forward, the test subject is swinging his
arm forward and backward (rotation in y axis) and per-
forming rotation in vertical axis (z-axis), as shown in
Figure 2. Rotation in x-axis is very small for walking
and jogging and hence data for this are ignored.
The main thing of the analysis is to detect the positive
angular velocity for each swing of jogging and walking
activities and then calculate the mean value of every
swing. PCA is used to get the best view of the motion on
the graph after the variables were reduced as mentioned
in next subsection. Since the rotations of the arm during
activities are not perfectly aligned along the y and z-axis,
PCA was used to realign the graph to get the actual axis
of the moving arms rotations, as pictured in Figure 3.
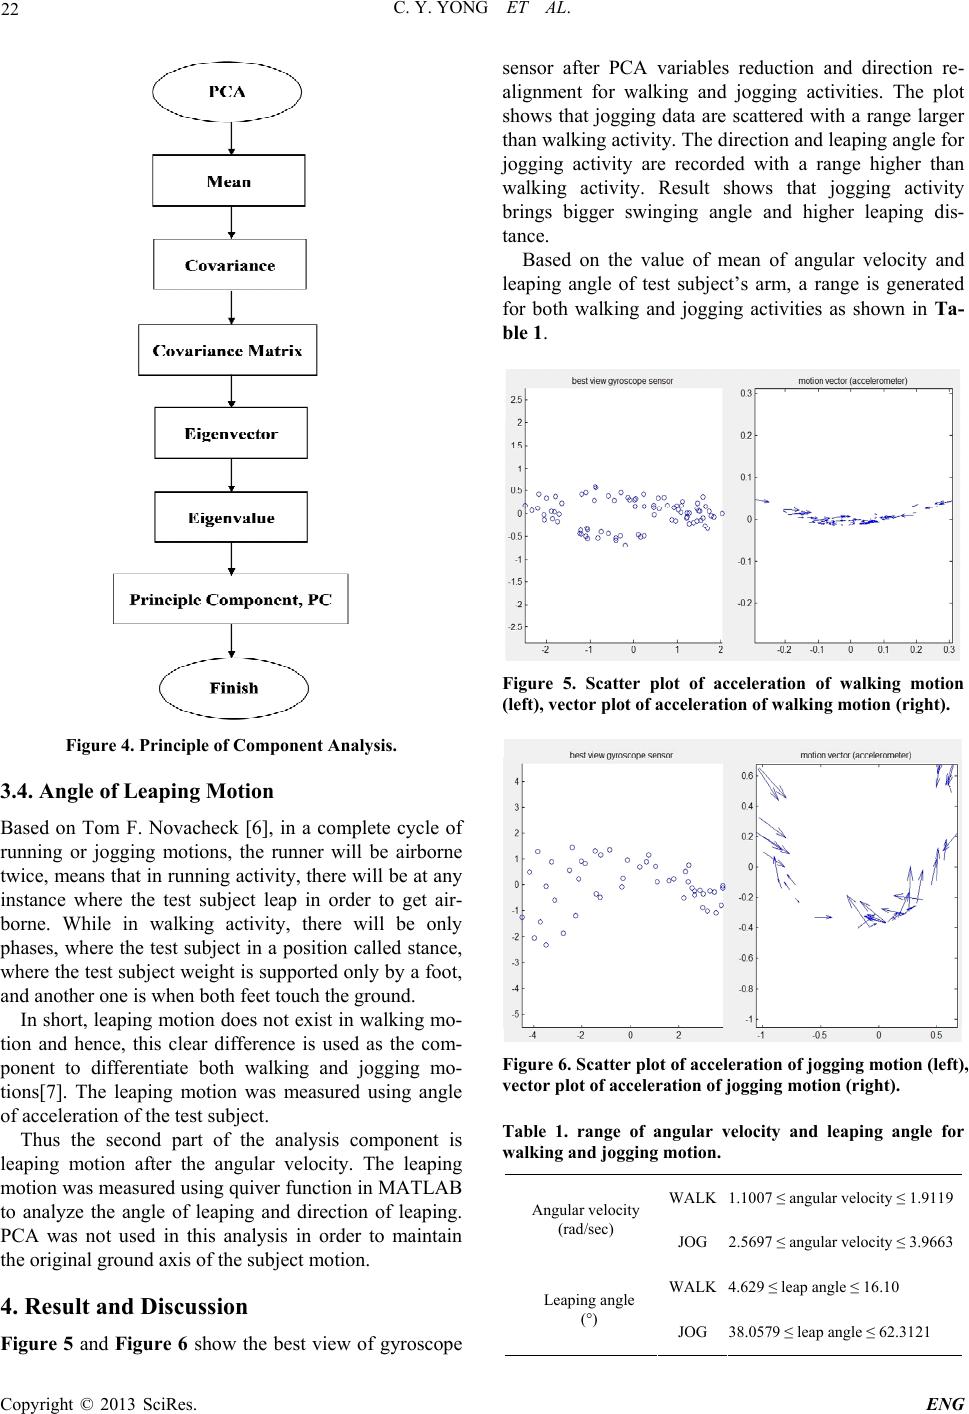
3.3. Principle Component Analysis (PCA)
Principle of component analysis process shown in Figure
4 is a procedure in analyzing 2 or 3 dimensional set of
data, or to minimize the number of data by creating an
artificial point to represent the set of data. A randomly
100 points of data were selected from each session for
PCA analysis. The scatter plot graph shown 100 points of
distribution after PCA and each point was represented as
3 aspects (acceleration, angular motion and angle) for a
data collecting event, as written in [5]. Several steps were
performed such as covariance, covariance matrix, Eigen
vector and Eigen value to generate an artificial point for
a set of data for PCA variables reduction.
Figure 2. Rotation motion of test subject’s arm.
X
Y
X
Y
actual view
before PCA
after PCA
X
Y
Figure 3. Rotation Perfect arm rotation axis (left), actual view & view from data (center), actual arm rotation axis rotated by
PCA (right).
Copyright © 2013 SciRes. ENG
C. Y. YONG ET AL.
22
Figure 4. Principle of Component Analysis.
3.4. Angle of Leaping Motion
Based on Tom F. Novacheck [6], in a complete cycle of
running or jogging motions, the runner will be airborne
twice, means that in running activity, there will be at any
instance where the test subject leap in order to get air-
borne. While in walking activity, there will be only
phases, where the test subject in a position called stance,
where the test subject weight is supported only by a foot,
and another one is when both feet touch the ground.
In short, leaping motion does not exist in walking mo-
tion and hence, this clear difference is used as the com-
ponent to differentiate both walking and jogging mo-
tions[7]. The leaping motion was measured using angle
of acceleration of the test subject.
Thus the second part of the analysis component is
leaping motion after the angular velocity. The leaping
motion was measured using quiver function in MATLAB
to analyze the angle of leaping and direction of leaping.
PCA was not used in this analysis in order to maintain
the original ground axis of the subject motion.
4. Result and Discussion
Figure 5 and Figure 6 show the best view of gyroscope
sensor after PCA variables reduction and direction re-
alignment for walking and jogging activities. The plot
shows that jogging data are scattered with a range larger
than walking activity. The direction and leaping angle for
jogging activity are recorded with a range higher than
walking activity. Result shows that jogging activity
brings bigger swinging angle and higher leaping dis-
tance.
Based on the value of mean of angular velocity and
leaping angle of test subject’s arm, a range is generated
for both walking and jogging activities as shown in Ta-
ble 1.
Figure 5. Scatter plot of acceleration of walking motion
(left), vector plot of acceleration of walking motion (right).
Figure 6. Scatter plot of acceleration of jogging motion (left),
vector plot of acceleration of jogging motion (right).
Table 1. range of angular velocity and leaping angle for
walking and jogging motion.
WALK1.1007 angular velocity 1.9119
Angular velocity
(rad/sec) JOG 2.5697 angular velocity 3.9663
WALK4.629 leap angle 16.10
Leaping angle
(°) JOG 38.0579 leap angle 62.3121
Copyright © 2013 SciRes. ENG
C. Y. YONG ET AL. 23
Through observation from the table, the angular veloc-
ity of test subject’s arm is faster in jogging compared to
walking. It means that the test subject swing his arm
faster in jogging compared in walking. Since the range of
angular velocity of walking and jogging are not overlap
with each other, this range is used to recognize and dif-
ferentiate both walking and jogging motion.
Same thing goes to leaping angle assessment. Jogging
activity has recorded a range higher than 35°.
The mean of angular velocity and the mean of leap an-
gle of the test data yield from the analysis are used to
evaluate the motion classification program represented
by flowchart in Figure 7. A system was developed based
on the range of angular velocity and leaping angle for
motion classification.
5. Conclusions
It can be concluded that a 3-space sensor is useful in
analyzing human motion since the device consists of
three different sensors which give advantage in measure-
ing the motion in several aspects simultaneously[8]. The
success of the data collecting session also put wearable
sensor approach one step forward of the vision based
approach in terms of the number of different measure-
ment can be done simultaneously.
There are two kinds of graph generated in analyzing
both motions: they are PCA scatter plot and quiver func-
tion graph. PCA scatter plot realigned the graph for the
best view in angular velocity and reduced nine variables
become three for better analysis. The quiver function in
MATLAB is used to generate the direction vector plot of
the given motion. The vector plot shows the increment
and decrement of the motion direction. This information
shows clearly every move for a swing of human arm.
Finally, the range of angular velocity generated in Ta-
ble 1 is used to develop a motion classification system.
The system was trained by using the recent collected data
and the process of increasing the amount of data is
planned to be done in the future in order to increase the
accuracy and specificity of the system.
Start
2.5697<=angular_velocity<=3.9663?
1.1007<=angular_velocity<=1.9119?
38.0579<=mean_elev<=62.3121?
4.629<=mean_elev<=16.10?
Display JOG
Display WALK
Display
UNIDENTIFIED
Finish
yes
no
yes
yes
yes
no
no
no
Figure 7. Flowchart of motion classification program.
Copyright © 2013 SciRes. ENG
C. Y. YONG ET AL.
24
Figure 8. Motion classification system.
The classification system was shown as in Figure 8.
The GUI is developed to be user friendly as users can
easily load their file to the system within a click. The
system displays gyroscope best view plot, acceleration
gait plot (human arm swinging animation), and accelera-
tion vector plot (direction of swinging arm). The mean
value of angular velocity and mean value of leaping an-
gle of the motion are displayed at the bottom of the plots.
The classification result is shown at the bottom right of
GUI. The system will display “WALK” for walking ac-
tivity, “JOG” for jogging activity, and “UNIDENTI-
FIED” for unidentified motion.
6. Acknowledgements
A study of this magnitude depends on the hard work and
commitment of many professionals, and we are pleased
to acknowledge their contributions. The authors are
deeply indebted and would like to express our gratitude
to the Universiti Teknologi Malaysia for supporting and
funding this study under Research University Grant
(QJ13000.2636.05J69) and MyPhD Scholarship Scheme
from Ministry of Higher Education (MOHE). Apprecia-
tion also goes to Muhammad N. Hafizuddin Zainudin in
assisting the data acquisition.
REFERENCES
[1] L. Tao, I. Yoshio, S. Kyoko and M. Haruhiko, “Devel-
opment of Wearable Sensor Combinations for Human
Lower Extremity Motion,” Proceedings 2006 IEEE In-
ternational Conference on analysis in Robotics and
Automation, ICRA 2006.
[2] H. Zhou, T. Stone, H. S. Hu and N. Harris, “Use of Mul-
tiple Wearable Inertial Sensors in Upper Limb Motion
Tracking,” Medical Engineering & amp; Physics. Vol. 30,
No. 1, 2008, pp. 123-133.
[3] R. Liu, J. Z. Zhou, M. Liu and X. F. Hou, “A Wearable
Acceleration Sensor System for Gait Recognition,” Pro-
ceedings of the 2nd IEEE Conference in Industrial Elec-
tronics and Applications, 2007.
[4] 3-Space Sensor, User Manual, YEI Technology.
[5] J. Shlens, “A tutorial on Principal Components Analysis,
Version 2,” Salk institute for Biological Studies and In-
stitute for Nonlinear Science, University of California,
San Diego, 2005.
[6] T. F. Novacheck, “The Biomechanics of Running,” Gait
& amp; Posture, Vol. 7, No. 1, 1998, pp. 77-95.
doi:10.1016/S0966-6362(97)00038-6
[7] M. Hanlon and R. Anderson, “Real-time gait event detec-
tion using wearable sensors,” Gait & amp; Posture, Vol.
30, No. 4, 2009, pp. 523-527.
doi:10.1016/j.gaitpost.2009.07.128
[8] A. Minami, H. Teruo, O. Tomoyuki, K. Kazuyuki, W.
Kajiro and K. Yosuke, “A Study on Gait Analysis by
Measuring Axis Rotation Based on 3D Magnetic and
Acceleration Sensors,” Proceedings of SICE Annual Con-
ference 2010.
Copyright © 2013 SciRes. ENG