Paper Menu >>
Journal Menu >>
 Open Journal of Fluid Dynamics, 2013, 3, 28-35 http://dx.doi.org/10.4236/ojfd.2013.32A005 Published Online July 2013 (http://www.scirp.org/journal/ojfd) Guide Vane with Current Plate to Improve Efficiency of Cross Flow Turbine Kiyoshi Kokubu1, Toshiaki Kanemoto2, Keisuke Yamasaki1 1Graduate School of Engineering, Kyushu Institute of Technology, Kitakyushu, Japan 2Faculty of Engineering, Kyushu Institute of Technology, Kitakyushu, Japan Email: kiyoshi-kokubu@tanasui.co.jp Received June 3, 2013; accepted June 10, 2013; accepted June 17, 2013 Copyright © 2013 Kiyoshi Kokubu et al. This is an open access article distributed under the Creative Commons Attribution License, which permits unrestricted use, distribution, and reproduction in any medium, provided the original work is properly cited. ABSTRACT To get the sustainable society, the hydropower with not only the large but also the small/mini/micro capacities has been paid attention to in the power generation. The cross flow turbine can work effectively at the comparatively low head and/or low discharge, then the runner and the turbine profile has been optimizing. In this paper, the model turbine was prepared in accordance with the traditional design, and the performance and the flow condition were investigated ex- perimentally at the various operating conditions. The hydraulic efficiency is doubtlessly maximal while the guide vane is at the normal/design position, and deteriorates in the lower discharges adjusted by the guide vane. Such deteriorations are brought from the unacceptable flow conditions in the inlet nozzle. To improve the efficiency dramatically in the lower discharge, the guide vane installed in the inlet nozzle was equipped with the current plate, and the fruitful effects of the plate on the efficiency were confirmed experimentally. Keywords: Hydraulic Turbine; Cross Flow Turbine; Guide Vane; Inlet Nozzle; Hydraulic Efficiency; Discharge 1. Introduction It is desired to exploit the renewable energies, and the hydro resources, such as small/mini/micro-scaled rivers, agricultural/industrial channel/drain and so on, are ex- pected to play a great role in the power generation [1]. It is very important, for meeting such needs, to reduce the initial cost of the power plant, since the plant does not generate much electricity in comparison with the large- scaled power plant [2]. The cross flow turbine is assem- bled with few components, and can work effectively at the comparatively low head and/or low discharge in the onshore and offshore without nature disruptions. These advantages have been demonstrated in many researches, moreover, the turbine profile has been optimizing [2-4]. Nevertheless, the hydraulic efficiency of the cross flow turbine is still lower than the efficiency of the turbines such as the bulb/Francis/Pelton types used widely [5]. The supposable reasons for the lower efficiency are as follows: 1) the flow crossing in the runner may contact the main shaft at the partial load; 2) the flow direction re-entering to the runner at the inner diameter does not meet the blade angle; 3) the guide vane makes the flow condition unacceptable for the runner blade in the low discharge. To address these points, the installation of the passage in the runner has been proposed to guide the flow direction [6,7]. On the contrary, this paper proposes to modify the guide vane profile in response to the dis- charge. 2. Preparations to Improve Efficiency 2.1. Model Cross Flow Turbine in Tradition The inlet nozzle and the runner profiles affect directly the performance of the cross-flow turbine, and are prepared for house works in accordance with the traditional design [8] to understand the factors lowing the efficiency. 2.1.1. Inlet Nozzle The inlet nozzle gives the angular momentum to the runner, and it is desirable to give the same momentum in the peripheral/tangential direction. Besides, the flow an- gle at the nozzle outlet, measured from the circumferen- tial direction, should be smaller in the same way as the jet flow of Pelton turbine. Taking the material strength and the fabrication into account, the angle was set at α1 = 17 degrees on the casing walls and the concave surface of the guide vane, as shown in Figure 1. The opening angle of the nozzle outlet is 109 degrees in accordance C opyright © 2013 SciRes. OJFD 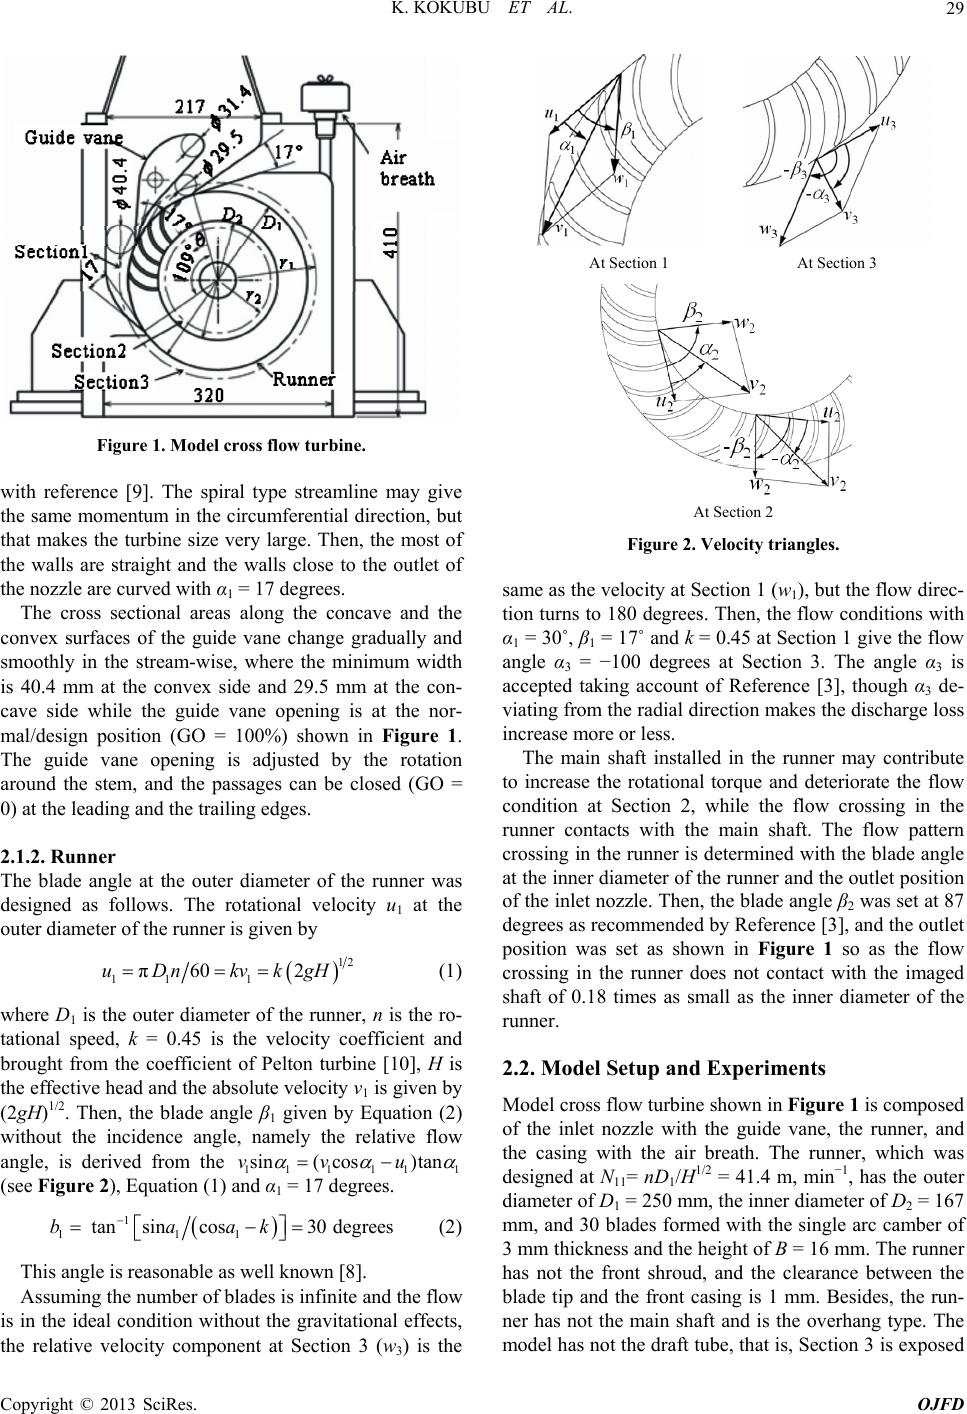 K. KOKUBU ET AL. 29 Figure 1. Model cross flow turbine. with reference [9]. The spiral type streamline may give the same momentum in the circumferential direction, but that makes the turbine size very large. Then, the most of the walls are straight and the walls close to the outlet of the nozzle are curved with α1 = 17 degrees. The cross sectional areas along the concave and the convex surfaces of the guide vane change gradually and smoothly in the stream-wise, where the minimum width is 40.4 mm at the convex side and 29.5 mm at the con- cave side while the guide vane opening is at the nor- mal/design position (GO = 100%) shown in Figure 1. The guide vane opening is adjusted by the rotation around the stem, and the passages can be closed (GO = 0) at the leading and the trailing edges. 2.1.2. Runner The blade angle at the outer diameter of the runner was designed as follows. The rotational velocity u1 at the outer diameter of the runner is given by 12 11 1 π60 2uDn kvkgH (1) where D1 is the outer diameter of the runner, n is the ro- tational speed, k = 0.45 is the velocity coefficient and brought from the coefficient of Pelton turbine [10], H is the effective head and the absolute velocity ν1 is given by (2gH)1/2. Then, the blade angle β1 given by Equation (2) without the incidence angle, namely the relative flow angle, is derived from the 111 11 sin( cos)tanvvu 1 (see Figure 2), Equation (1) and α1 = 17 degrees. 1 111 tansincos30degreesbaak (2) This angle is reasonable as well known [8]. Assuming the number of blades is infinite and the flow is in the ideal condition without the gravitational effects, At Section 1 At Section 3 At Section 2 Figure 2iangles. me as the velocity at Section 1 (w1), but the flow direc- lled in the runner may contribute to 2.2. Model Setup and Experiments e 1 is composed . Velocity tr sa tion turns to 180 degrees. Then, the flow conditions with α1 = 30˚, β1 = 17˚ and k = 0.45 at Section 1 give the flow angle α3 = −100 degrees at Section 3. The angle α3 is accepted taking account of Reference [3], though α3 de- viating from the radial direction makes the discharge loss increase more or less. The main shaft insta increase the rotational torque and deteriorate the flow condition at Section 2, while the flow crossing in the runner contacts with the main shaft. The flow pattern crossing in the runner is determined with the blade angle at the inner diameter of the runner and the outlet position of the inlet nozzle. Then, the blade angle β2 was set at 87 degrees as recommended by Reference [3], and the outlet position was set as shown in Figure 1 so as the flow crossing in the runner does not contact with the imaged shaft of 0.18 times as small as the inner diameter of the runner. Model cross flow turbine shown in Figur of the inlet nozzle with the guide vane, the runner, and the casing with the air breath. The runner, which was designed at N11= nD1/H1/2 = 41.4 m, min−1, has the outer diameter of D1 = 250 mm, the inner diameter of D2 = 167 mm, and 30 blades formed with the single arc camber of 3 mm thickness and the height of B = 16 mm. The runner has not the front shroud, and the clearance between the blade tip and the front casing is 1 mm. Besides, the run- ner has not the main shaft and is the overhang type. The model has not the draft tube, that is, Section 3 is exposed the relative velocity component at Section 3 (w3) is the Copyright © 2013 SciRes. OJFD 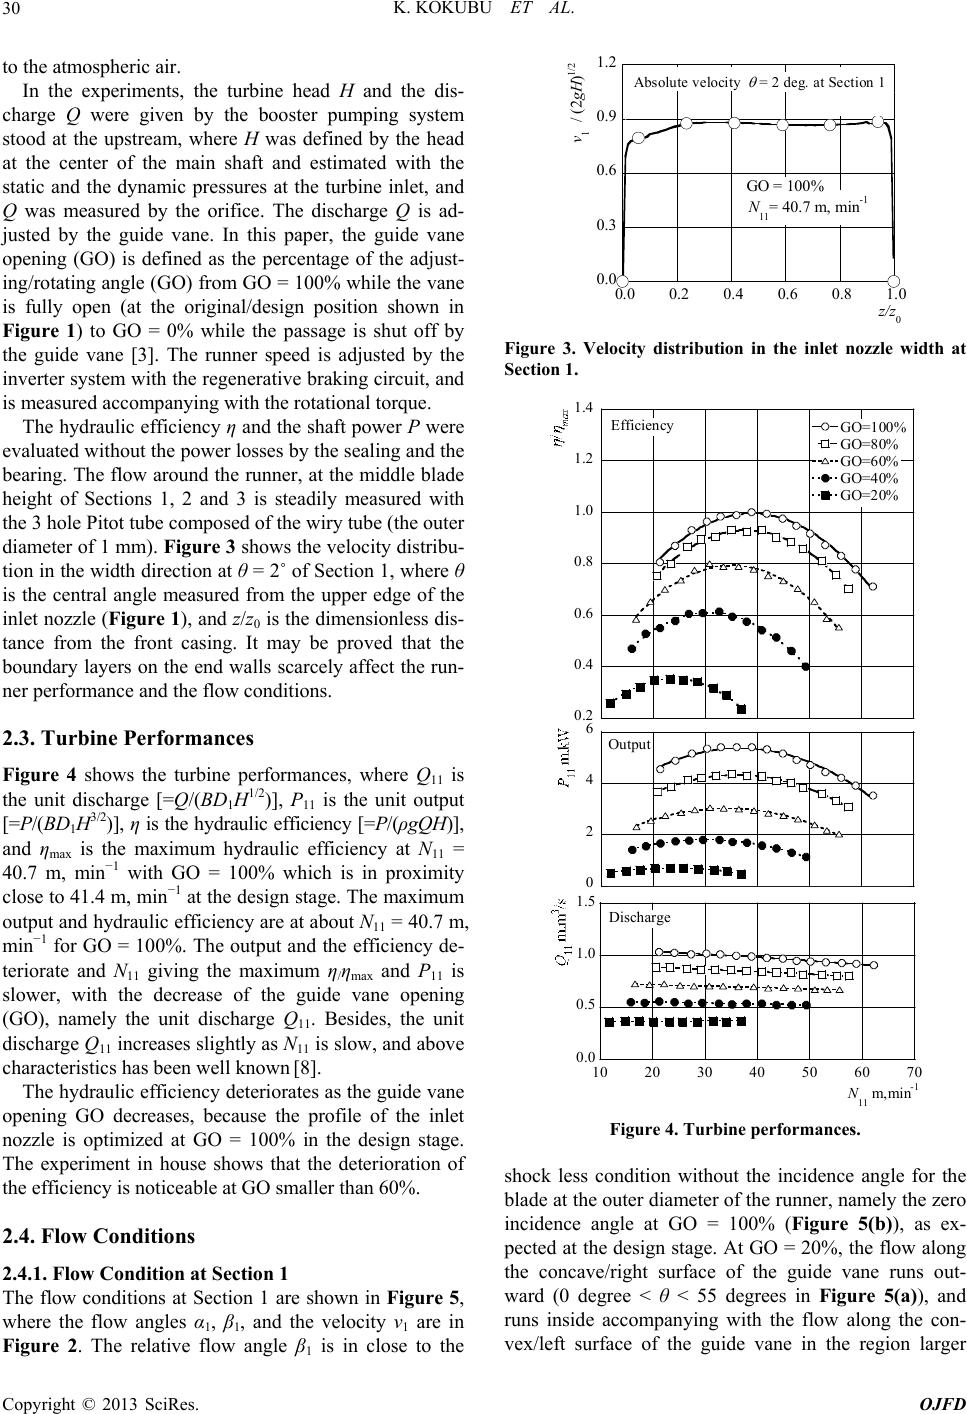 K. KOKUBU ET AL. 30 to the atmospheric air. In the experiments, the turbine head H and the dis- ch re ev 2.3. Turbine Performances ormances, where Q11 is s the guide vane op 2.4. Flow Conditions Section 1 own in Figure 5, arge Q were given by the booster pumping system stood at the upstream, where H was defined by the head at the center of the main shaft and estimated with the static and the dynamic pressures at the turbine inlet, and Q was measured by the orifice. The discharge Q is ad- justed by the guide vane. In this paper, the guide vane opening (GO) is defined as the percentage of the adjust- ing/rotating angle (GO) from GO = 100% while the vane is fully open (at the original/design position shown in Figure 1) to GO = 0% while the passage is shut off by the guide vane [3]. The runner speed is adjusted by the inverter system with the regenerative braking circuit, and is measured accompanying with the rotational torque. The hydraulic efficiency η and the shaft power P we aluated without the power losses by the sealing and the bearing. The flow around the runner, at the middle blade height of Sections 1, 2 and 3 is steadily measured with the 3 hole Pitot tube composed of the wiry tube (the outer diameter of 1 mm). Figure 3 shows the velocity distribu- tion in the width direction at θ = 2˚ of Section 1, where θ is the central angle measured from the upper edge of the inlet nozzle (Figure 1), and z/z0 is the dimensionless dis- tance from the front casing. It may be proved that the boundary layers on the end walls scarcely affect the run- ner performance and the flow conditions. Figure 4 shows the turbine perf the unit discharge [=Q/(BD1H1/2)], P11 is the unit output [=P/(BD1H3/2)], η is the hydraulic efficiency [=P/(ρgQH)], and ηmax is the maximum hydraulic efficiency at N11 = 40.7 m, min−1 with GO = 100% which is in proximity close to 41.4 m, min−1 at the design stage. The maximum output and hydraulic efficiency are at about N11 = 40.7 m, min−1 for GO = 100%. The output and the efficiency de- teriorate and N11 giving the maximum η/ηmax and P11 is slower, with the decrease of the guide vane opening (GO), namely the unit discharge Q11. Besides, the unit discharge Q11 increases slightly as N11 is slow, and above characteristics has been well known [8]. The hydraulic efficiency deteriorates a ening GO decreases, because the profile of the inlet nozzle is optimized at GO = 100% in the design stage. The experiment in house shows that the deterioration of the efficiency is noticeable at GO smaller than 60%. 2.4.1. Flow Condition at The flow conditions at Section 1 are sh where the flow angles α1, β1, and the velocity ν1 are in Figure 2. The relative flow angle β1 is in close to the 0.0 0.3 0.6 0.9 1.2 )1/2 0.0 0.2 0.4 0.6 0.8 1.0 v1 / (2gH z/z0 Absolute velocity = 2 deg. at Section 1 N11= 40.7 m, min-1 GO = 100% Figure 3. Velocity distribution in the inlet nozzle w idth at Section 1. 0.2 0.4 0.6 0.8 1.0 1.2 1 . 4 GO=100% GO=80% GO=60% GO=40% GO=20% Efficiency 0.0 0.5 1.0 1.5 10 20 30 40 50 60 70 N11 m,min-1 Discharge 0 2 4 6 Output Figure 4. Turbine performances. ock less condition without the incidence angle for the sh blade at the outer diameter of the runner, namely the zero incidence angle at GO = 100% (Figure 5(b)), as ex- pected at the design stage. At GO = 20%, the flow along the concave/right surface of the guide vane runs out- ward (0 degree < θ < 55 degrees in Figure 5(a)), and runs inside accompanying with the flow along the con- vex/left surface of the guide vane in the region larger Copyright © 2013 SciRes. OJFD  K. KOKUBU ET AL. 31 (a) θdeg. (b) θdeg. (c) Figure 5. Flow conditions at (a) Absolute flow an θ = 55 degrees in Figure 5(a). That is, the runner pposable that such flow conditions make the ru 2.4.2. Flow Condition at Section 2 ection 2, where the Section 1: angle; (b) Relative flow angle; (c) Absolute velocity. th works effectively in the lower casing wall (large θ) at the small GO. The flow may contribute to break more or less the runner rotation near θ = 70 degrees, because the flow is very slow with the comparatively large β1 (Figure 5(b) and (c)). It is su nner work, namely the hydraulic efficiency, deteriorate in the small guide vane opening (low discharge). Thus, it is expected to improve the flow condition through the passage surrounded by the concave/right surface of the guide vane in the small opening. Figure 6 shows the flow angles at S flow angles are also given in Figure 2 and the boundary between the flow crossing in the runner and the ambient air was measured with the flow visualization. Section 2 has the flow discharging from the runner blade in α2 > 0 degree (discharging region) and the flow re-attacking to the runner blade in α2 < 0 degree (attacking region), where θ giving α2 = 0 degree is the border to separate those two regions. The discharging region moves to the large central angle θ at the small guide vane opening, but the flow angle against θ is scarcely affected by the guide vane opening, because the discharging flow direction depends on the blade angle. -60 -40 -20 0 20 40 60 6090120 150 180 210 240 GO=100% N 11 =40.7 m,min -1 GO=20% N 11 =23.8 m,min -1 deg. Section 2 Absolute flow angle Visualized boundary (a) -100 -50 0 50 100 150 200 6090120 150 180 210 240 GO=100% N 11 =40.7 m,min -1 GO=20% N 11 =23.8 m,min -1 deg. Section 2 Relative flow angle Inlet angle of runner blade Outlet angle of runner blade Visualized boundary (b) Figure 6. Flow angles at Sec 2: (a) Absolute flow angle; tion (b) Relative flow angle. Copyright © 2013 SciRes. OJFD  K. KOKUBU ET AL. 32 The relative flow angle changes in the tangential di- re 2.4.3. Flow Condition at Section 3 angle at Section 3, 2.4.4. Analysis of Output lines obtained experimentally ction and does not meet the blade angle, as shown Figure 6(b). To rectify the flow direction and reduce the shock loss, the flow passage was installed in the runner [6,7]. The authors, however, cannot improve the hydrau- lic efficiency by such passages, in house experiments [11]. Figure 7 shows the absolute flow which has the flow discharging not to the inside but to the outside of the runner (Section 1-3) and the flow after crossing in the runner inside (Section 1-3), where α3 is given in Figure 2. Both flows are separated at θ = 187 degrees for GO = 100%, and θ = 203 degrees for GO = 20%. The discharging flow angle is larger than α3 = −90 degrees and may make the discharging loss increase at GO = 20%, though the optimum angle is α3 = −90 de- grees. Figure 8 shows the stream from the absolute flow, where these are at the N11 giving the maximum hydraulic efficiency, respectively, S2 - S9 were estimated with the flow quantitatively measured at Sections, S1 and S10 were estimated from the flow visu- alization. Figure 9 shows the theoretical power fraction estimated from the angular momentum measured -100 -50 0 50 100 120 140 160 180 200 220 240 260 GO=100%, N 11 =40.7 m,min -1 GO=20%, N 11 =23.8 m,min -1 deg. Section 3Absolute flow angle Section 1-2-3 Visualized boundary Figure 7. Absolute flow angle at Section 3. S 1 S 2 S 3 S 4 S 5 S 6 S 7 S 8 S 9 S 10 (a) (b) Figure 8. S11 , min−1); tion is ε = the power ne treamlines: (a) GO = 100% (N = 40.7 m (b) GO = 20% (N11 = 23.8 m, min−1). on each streamline, where the frac on each streamline: PST)/the summation of PST: ΣPST). At the small guide vane opening GO = 20% (Figures 8(b) and 9(b)), the power fraction ε through Section 1-3 increases, that is, the fraction through Section 1-2-3, especially 1-2, decrease obviously. On the contrary, the flow through Section 1-2 contributes to increase the power at the large guide vane opening (Figures 8(a) and 9(a)). These results and Figure 5 suggest that it is very important to improve the flow condition in the smaller central angle θ at Section 1 while the guide vane opening is small. 3. Improving Efficiency in Low Discharge 3.1. Guide Vane Equipping with Current Plate In response to the above suggestion, the guide va equipped with the current plate of the single arc as shown in Figure 10. Current Plate A is attached to the concave surface of the guide vane at θ = 4 degrees of GO = 60% and comes at the outer diameter of the runner with the clearance of 1mm on θ = 31 degrees, where the plate angle at the trailing edge coincides with the relative flow angle β1 while operating at the maximum efficiency of GO = 20%. In the same manner, Current Plate B is at- tached to the guide vane at θ = 17 degrees and comes at the runner outside on θ = 43 degrees. In the practical use, the current plate may be made of the shape-memory alloy plates. Figure 9. Power fraction between streamlines: (a) GO = 100% (N11 = 40.7 m, min−1); (b) GO = 20% (N11 = 23.8 m, min−1). Current plate A 4° Current plate B 17°31° 43° GO=60% =20% Figure 10. Current plates. Copyright © 2013 SciRes. OJFD 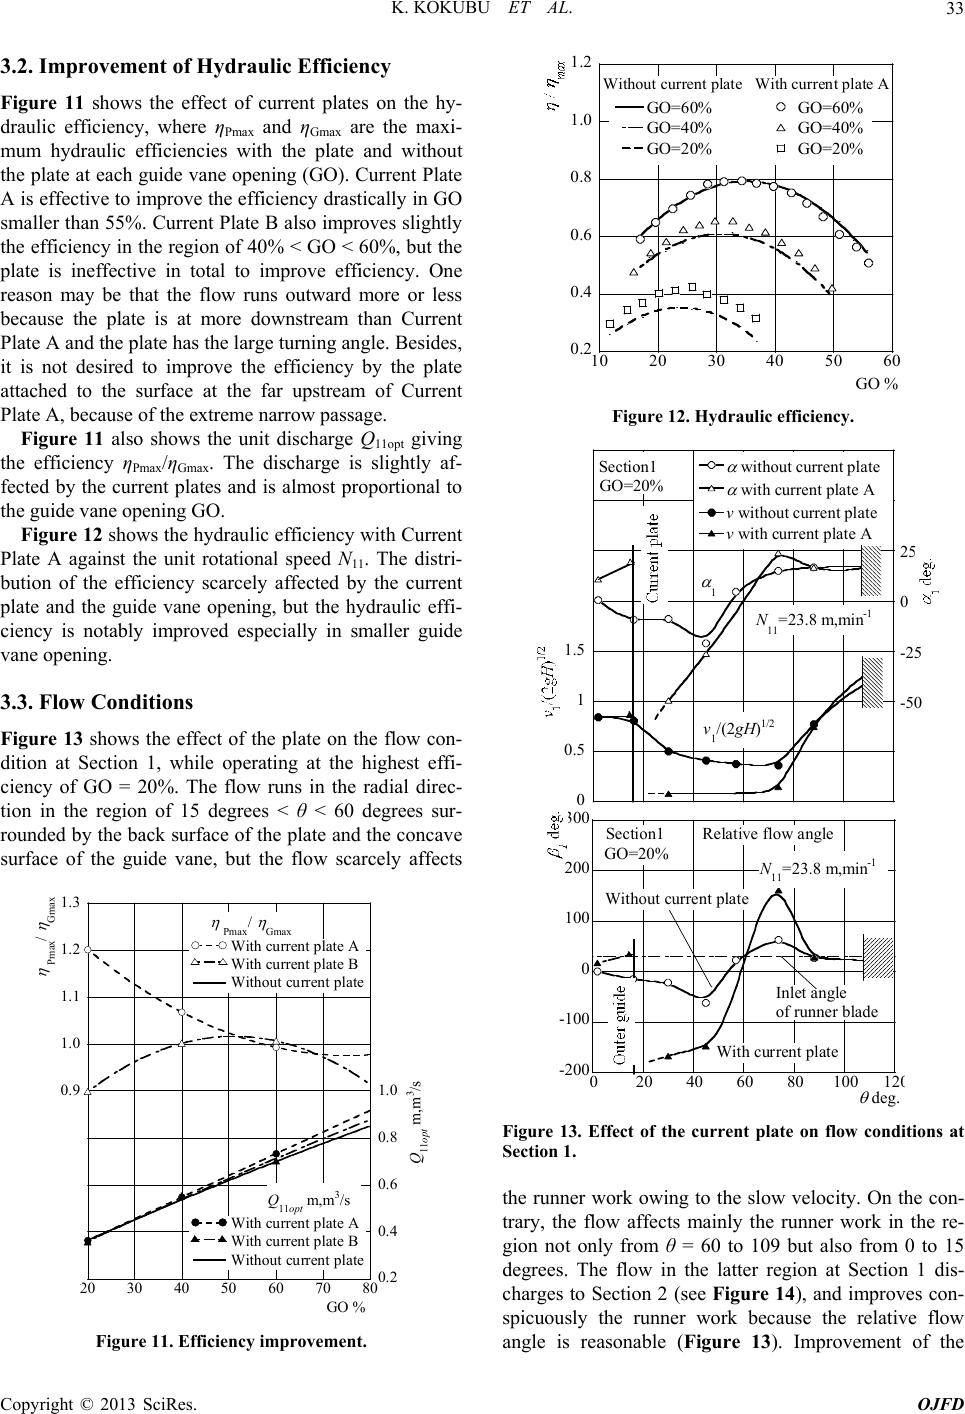 K. KOKUBU ET AL. 33 3.2. Improvemiency the hy- axi- htly af- fe tional speed N. The distri- bu ditions ct of the plate on the flow con- erating at the highest effi- ent of Hydraulic Effic Figure 11 shows the effect of current plates on draulic efficiency, where η and η are the m Pmax Gmax mum hydraulic efficiencies with the plate and without the plate at each guide vane opening (GO). Current Plate A is effective to improve the efficiency drastically in GO smaller than 55%. Current Plate B also improves slightly the efficiency in the region of 40% < GO < 60%, but the plate is ineffective in total to improve efficiency. One reason may be that the flow runs outward more or less because the plate is at more downstream than Current Plate A and the plate has the large turning angle. Besides, it is not desired to improve the efficiency by the plate attached to the surface at the far upstream of Current Plate A, because of the extreme narrow passage. Figure 11 also shows the unit discharge Q11opt giving the efficiency ηPmax/ηGmax. The discharge is slig cted by the current plates and is almost proportional to the guide vane opening GO. Figure 12 shows the hydraulic efficiency with Current Plate A against the unit rota11 tion of the efficiency scarcely affected by the current plate and the guide vane opening, but the hydraulic effi- ciency is notably improved especially in smaller guide vane opening. 3.3. Flow Con Figure 13 shows the effe dition at Section 1, while op ciency of GO = 20%. The flow runs in the radial direc- tion in the region of 15 degrees < θ < 60 degrees sur- rounded by the back surface of the plate and the concave surface of the guide vane, but the flow scarcely affects 0.5 0.6 0.7 0.8 0.9 1.0 1.1 1.2 1.3 1.8 Gmax 0. 2 0. 4 0. 6 0. 8 1. 0 1. 2 1. 4 1. 6 20 3040 5060 7080 GO % Pmax Q11opt m,m3/s 0.2 0.4 0.6 0.8 1.0 1.2 GO=60% GO=40% GO=20% GO=6 0% GO=4 0% GO=2 0% 10 20 30 40 50 60 Without current plateWith current plate A GO % Figure 12. Hydraulic efficiency. 0 0.5 1 1.5 -50 -25 0 25 v without current plate v with current plate A without current plate with current plate A Se ction1 N 11 =23.8 m,min -1 GO=20% v 1 /(2gH) 1/2 1 Pmax Gmax Q11opt m,m3/s With current plate A With current plate B Without current plate With current plate A With current plate B Without current plate Figure 11. Efficiency improvement. -200 -100 0 100 200 300 020 40 60 8010012 0 deg. Section1 Relative flow angle Inlet angle of runner blade GO=20% With current plate Without current plate N 11 =23.8 m,min -1 Figure 13. Effect of the current plate on flow conditions at Section 1. the runner work owing to the slow velocity. On the con- trary, the flow affects mainly the runner work in the re- gion not only from θ = 60 to 109 but also from 0 to 15 degrees. The flow in the latter region at Section 1 dis- charges to Section 2 (see Figure 14), and improves con- spicuously the runner work because the relative flow angle is reasonable (Figure 13). Improvement of the Copyright © 2013 SciRes. OJFD 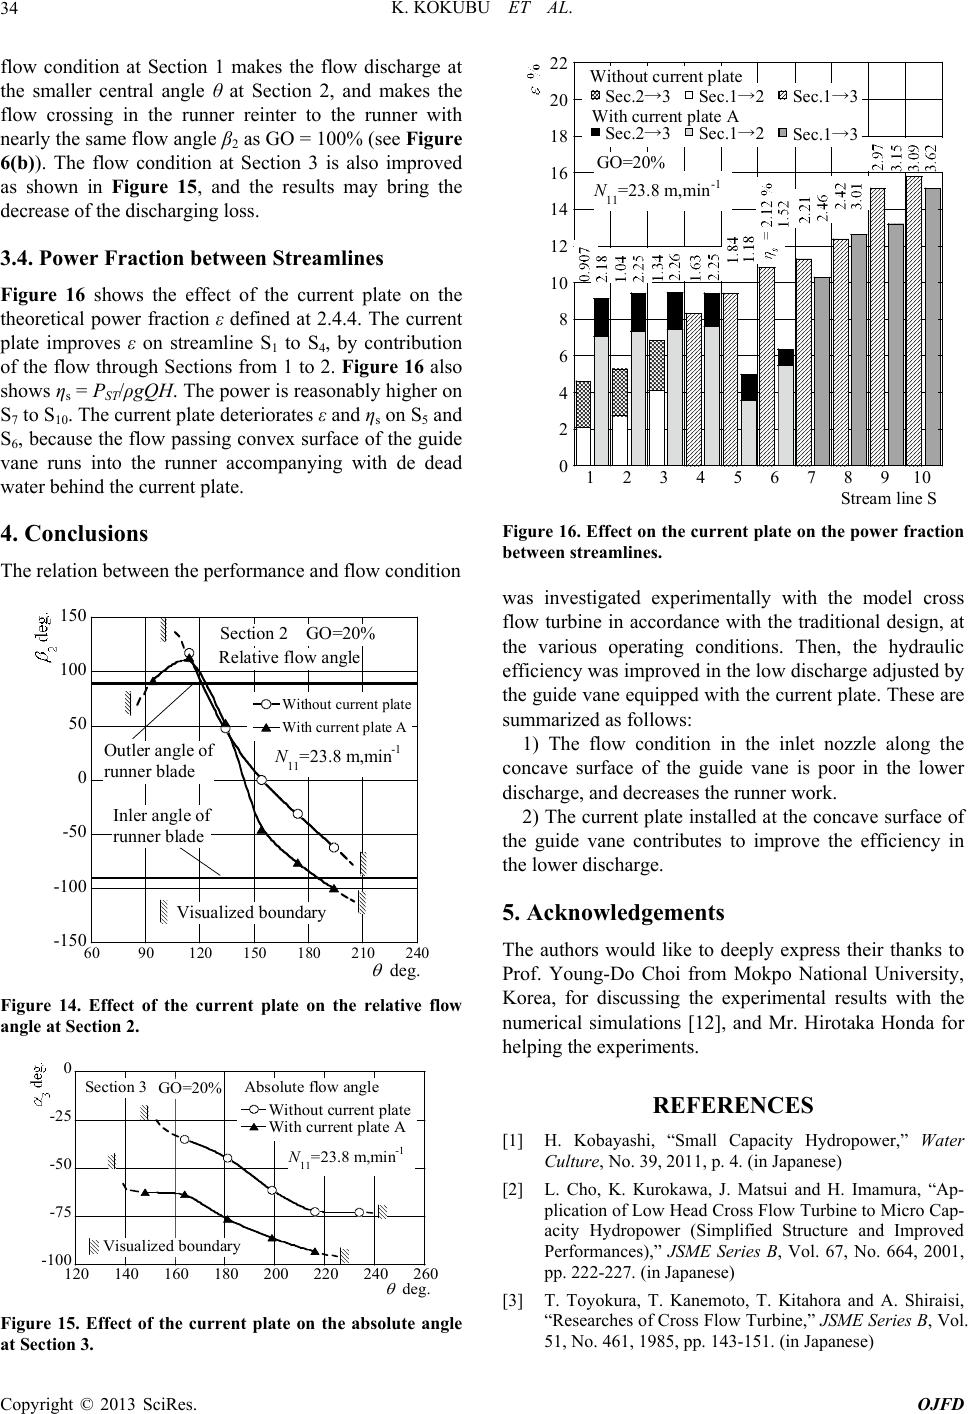 K. KOKUBU ET AL. 34 flow condition at Section 1 makes the flow discharge at the smaller central angle θ at Section 2, and makes the flow crossing in the runner reinter to the runner with nearly the same flow angle β2 as GO = 100% (see Figure 6(b)). The flow condition at Section 3 is also improved as shown in Figure 15, and the results may bring the decrease of the discharging loss. 3.4. Power Fraction between Streamlines Figure 16 shows the effect of the current plate on the theoretical power fraction ε defined at 2.4.4. The current plate improves ε on streamline S1 to S4, by contribution of the flow through Sections from 1 to 2. Figure 16 also shows ηs = PST/ρgQH. The power is reasonably higher on S7 to S10. The current plate deteriorates ε and ηs on S5 and S6, because the flow passing convex surface of the guide vane runs into the runner accompanying with de dead water behind the current plate. 4. Conclusions The relation between the performance and flow condition -150 -100 -50 6090120 150 180 210 240 0 100 150 50 Without current plate With current plate A deg. Section 2 Relative flow angle Inler angle of runner blade Outler angle of runner blade GO=20% Visualized boundary N 11 =23.8 m,min -1 Figure 14. Effect of the current plate on the relative flow angle at Section 2. -100 -75 120 140 160 180 200 220 240 260 -50 -25 0 Without current plate With current plate A deg. Section 3Absolute flow angle Visualized boundary GO=20% N 11 =23.8 m,min -1 Figure 15. Effect of the current plate on the absolute angle at Section 3. 0 2 4 6 8 10 12 14 16 18 20 22 12345678910 Sec.2→3 Sec.2→ Sec.1→ Without current plate 2Sec.1→3 3Sec.1→2 With current plate A Sec.1→3 GO =2 0% N=23.8 m,min-1 11 Stream line S Figure 16. Effect on the current plate on the power fraction between streamlines. itions. Then, the hydraulic proved in the low discharge adjusted by the guide vane equipped with the current plate. These are summarized as follows: 1) The flow condition in the inlet nozzle along the concave surface of the guide vane is poor in the lower discharge, and decreases the runner work. 2) The current plate installed at the concave surface of the guide vane contributes to improve the efficiency in the lower discharge. ould like to deeply express their thanks to Prof. Young-Do Choi from Mokpo National University, Korea, for discussing the experimental results with the numerical simulations [12], and Mr. Hirotaka Honda for helping the experiments. REFERENCES [1] H. Kobayashi, “Small Capacity Hydropower,” Water Culture, No. 39, 2011, p. 4. (in Japanese) [2] L. Cho, K. Kurokawa, J. Matsui and H. Imamura, “Ap- plication of Low Head Cross Flow Turbine to Micro Cap- acity Hydropower (Simplified Structure and Improved Performances),” JSME Series B, Vol. 67, No. 664, 2001, pp. 222-227. (in Japanese) [3] T. Toyokura, T. Kanemoto, T. Kitahora and A. Shiraisi, “Researches of Cross Flow Turbine,” JSME Series B, Vol. 51, No. 461, 1985, pp. 143-151. (in Japanese) was investigated experimentally with the model cross flow turbine in accordance with the traditional design, at e various operating condth efficiency was im 5. Acknowledgements The authors w Copyright © 2013 SciRes. OJFD  K. KOKUBU ET AL. Copyright © 2013 SciRes. OJFD 35 doi:10.1299/kikaib.51.143 [4] T. Kitahora, M. Inagaki, M. Uchida and S. Ooike, “In- fluence of Pressure in Runner Chamber on Performance Estimation of Micro-Head Cross Flow Hydraulic Turbine,” Proceedings of Renewable Energy 2010, Yokohama, 31 May-2 June 2010, CD-ROM: O-Sh-4-5. [5] Turbomachinery Society of Japan, “Hydro Turbine,” Ja- pan Industrial Publishing Co. Ltd., Tokyo, 1992, pp. 65- 67. (in Japanese) [6] S. Croquer, M. Asuaje, J. de Andrade, F. Jeanty Clarembaux, “Use of CFD Tools in Internal Deflector Design for Cross Flow Turbine Efficiency Improvement,” Proceedings of ASME 2012 Fluids Engineering Summer Meeting, Rio Grande, 10 July 2012, CD-ROM: FEDSM 2012-72017. [7] H. Olgun, “Effect of Interior Guide in Cross Flow Tur- bine Runner on Turbine Performance,” International Jour- nal of Energy Researches, Vol. 24, No. 11, 2000, pp. 953- 964. doi:10.1002/1099-114X(200009)24:11<953::AID-ER634 and J. >3.0.CO;2-3 o. Ltd., Tokyo, 1992, p. 78. 92, p. 64. e Korean Society of Marine Engi- [8] T. Toyokura and T. Kanemoto, “Cross Flow Turbine,” Energy and Resource, Vol. 4, No. 3 1983, pp. 234-239. (in Japanese) [9] Turbomachinery Society of Japan, “Hydro Turbine,” Ja- pan Industrial Publishing C (in Japanese) [10] Turbomachinery Society of Japan, “Hydro Turbine,” Japan Industrial Publishing Co. Ltd., Tokyo, 19 (in Japanese) [11] K. Kokubu, K. Yamasaki, H. Hond and T. Kanemoto, “Effect of Inner Guide on Performances of Cross Flow Turbine,” Proceedings of 26th IAHR Symposium on Hydraulic Machinery and System, Beijing, 19-23 August 2012, CD-ROM: IAHRXXVI-198. [12] K. Kokubu, T. Kanemoto, S. Son and Y. Choi, “Perform- ance Improvement of a Micro Eco Cross-Flow Hydro Turbine,” Journal of th neering, Vol. 36, No. 7, 2012, pp. 902-909. doi:10.5916/jkosme.2012.36.7.902 |