 International Journal of Clean Coal and Energy, 2013, 2, 35-43 doi:10.4236/ijcce.2013.22B008 Published Online May 2013 (http://www.scirp.org/journal/ijcce) Prospects for Renewable and Fossil-Based Electricity Generation in a Carbon-Constrained World Takayuki Takeshita Transdisciplinary Initiative for Global Sustainability, The University o f Tokyo, T okyo, Japan Email: takeshita@ir3s.u-tokyo.ac.jp Received April 24, 2013; revised June 2, 2013; accepted April 29, 2013 ABSTRACT In this paper, a regionally disaggregated global energy system model with a detailed treatment of the electricity supply sector is used to derive the cost-optimal choice of electricity generation technologies for each of 70 world regions over the period 2010-2050 under a constraint of halving global energy-related CO2 emissions in 2050 compared to the 2000 level. It is first shown that the long-term global electricity generation mix under the CO2 constraint becomes highly di- versified, which includes coal, natural gas, nuclear, biomass, hydro, geothermal, onshore and offshore wind, solar photovoltaics (PV), and concentrated solar power (CSP). In this carbon-constrained world, 89.9% of the electricity gen- eration from coal, natural gas, and biomass is combined with CO2 capture and storage (CCS) in 2050. It is th en shown that the long-term electricity generation mix under the CO2 constraint varies significantly by world region. Fossil fuels with CCS enter the long-term electricity generation mix in all world regions. In contrast, there is a sharp regional dif- ference in the renewable generation technology of choice in the long term. For example, the world regions suitable for PV plants include the US, Western Europe, Japan, Korea, and China, while those suitable for CSP plants include the Middle East, Africa, Australia, and western Asia. Offshore wind is deployed on a large scale in the UK, Ireland, Nordic countries, the southern part of Latin America, and Japan. Keywords: Renewable Power Sources; Fossil Power Sources; CO2 Mitigation; Regionally Detailed Analysis; Global Energy System Model 1. Introduction Climate change is the most pressing and threatening is- sue facing human beings. However, the United Nations warned in a recent report [1] that international efforts to mitigate climate change are, at this stage, insufficient to meet the goal of keeping global warming to below 2.0 degrees Celsius above pre-industrial levels. In order to avoid dangerous climate change and to achieve sustain- able development, a portfolio of rational greenhouse gas (GHG) mitigation actions must be identified and their implementation must be accelerated. In response to such political needs, many research or- ganizations have proposed desirable strategies for reduc- ing CO2 emissions from the energy sector under a global 2.0 degrees Celsius stabilization target. They have often indicated that the decarbonization of the electricity gen- eration sector is an attractive CO2 mitigation option in terms of CO2 mitigation potential and cost-effectiveness (e.g., [2,3]). However, there are fewer studies available conducting a regionally detailed analysis on CO2 mitiga- tion strategies for the electricity generation sector, al- though they have insisted that desirable CO2 mitigation strategies are very likely to vary by region depending on regional characteristics. Thus, the purpose of this paper is to derive the cost- optimal choice of electricity generation technologies in regional detail over the period 2010-2050 under a con- straint of halving global energy-related CO2 emissions in 2050 compared to the 2000 level. Due to space limita- tions, the focus of this paper is confined to (1) the com- petitiveness of renewable and fossil-based electricity generation technologies under this constraint and (2) re- gional differences in technology choices in the electricity generation sector under this constraint. This is done by using the global energy system model REDGEM70 (an acronym for a REgionally Disaggregated Global Energy Model with 70 regions) [4,5], which treats the electricity supply sector in detail. For the model to be used for this purpose, it was updated to properly consider the variabil- ity of renewable electricity generation and flexibility measures needed to integrate variable renewables into a power grid . 2. Methodology 2.1. Overview of the REDGEM70 Model REDGEM70 is a technology-rich, bottom-up global en- Copyright © 2013 SciRes. IJCCE  T. TAKESHITA 36 ergy systems optimization model formulated as an in- tertemporal linear programming problem (see [5] for a schematic representation of the structure of the model). With a 5% discount rate, the model is designed to deter- mine the cost-optimal energy strategy (e.g., the cost-op- timal choice of technology options) from 2010 to 2050 at 10-year intervals for each of 70 world regions so that total discounted global energy system costs are mini- mized under constraints on the satisfaction of exoge- nously given en ergy end-use demands, the availab ility of primary energy resources, material and energy balances, the maximum market growth rates of new technologies, etc. In the model, price-induced energy demand reduc- tions and energy efficiency improvements, fuel switching to less carbon-intensive fuels, and CO2 capture and stor- age (CCS) in geologic formations are the three options for CO2 emissions reduction. Furthermore, in the current version of the model used in this study, there is also a constraint that global en- ergy-related CO2 emissions in 2050 are to be halved compared to the 2000 level. This constraint is imposed because the Intergovernmental Panel on Climate Change has concluded that a 50% to 80% reduction of global CO2 emissions by 2050 compared to the 2000 level can limit the long-term global mean temperature rise to 2.0 degrees Celsius above pre-industrial levels [6]. The model has a full flexibility in where and how CO2 emis- sions reduction is achieved to meet this co nstraint. As described above, REDGEM70 uses 70 world re- gions. Figure 1 shows how the 70 world regions are de- fined in the model. These 70 regions are categorized into “energy production and consumption regions” and “en- ergy production regions”. The whole world was first di- vided into the 48 energy production and consumption regions to which future energy end-use demands are al- located. The 22 energy production regions, which are defined as geographical points, were then distinguished from the energy production and consumption regions to represent the geographical characteristics of the areas endowed with large amounts of fossil energy resources. While the 48 energy production and consumption regions cover the global final energy consumption, all the en- ergy-related activities except final energy consumption are conducted in each of the two region types in the model. Such a detailed regional disaggregation enables the explicit consideration of regional characteristics in terms of energy resource supply, energy demands, geog- raphy, and climate. Future trajectories for energy end-use demands were estimated as a function of those for socio-economic driving forces such as population and income in the in- termediate B2 scenario developed by [7]. Allocation of the energy end-use demand estimates to the 48 energy production and consumption regions was done by using country- and state-level statistics/estimates (and projec- tions if available) on population, income, geography, energy use by type, and transport activity by mode, and by taking into account the underlying storyline of the B2 scenario that regional diversity might be somewhat pre- served throughout the 21st century. Assumptions on the availability and extraction cost of fossil energy resources and uranium resources were de- rived from [8] and [9], respectively. For non-biomass renewable resources, electricity supply potentials and electricity generation costs by world region are exoge- nous inputs to the model, which were obtained from Representative cities in energy production and consumption regions Represe ntative s ite s in energy production regions Figure 1. Regional disaggregation of REDGEM70. Copyright © 2013 SciRes. IJCCE  T. TAKESHITA 37 [10,11]. For biomass resources, the model considers not only terrestrial biomass, but also waste biomass. The availability of these biomass resources and excess crop- land that can be used for energy purposes without con- flicting with other biomass uses such as food production was estimated for each region and each time point. They were estimated assuming that biomass is produced in a sustainable way so that biomass-derived energy carriers can be regarded as carbon neutral. Data for these biomass resources (e.g., resource availability, yield s per hectare of land, and supply costs) are provided in [12]. These re- source availability estimates were then allocated to the 70 model regions by using country-, state-, and site-level statistics/estimates. 2.2. Electricity Supply Sector Submodel The electricity supply sector submodel of REDGEM70 was developed based on the ReEDS model [13]. In this submodel, time is subdivided within each 10-year time period: each year is divided into four seasons, each sea- son is divided into three diurnal time-slices, and there is one superpeak time-slice. Given a set of input data and constraints, this submodel determines the cost-optimal choice of electricity generation technologies and elect ricity storage technologies for each region and each time point and determines their cost-optimal operation patterns for each region, each time-slice, and each time point. This submodel explicitly takes into account the vari- ability of wind an d so lar p hotovo ltaics (PV) power, flex i- bility measures needed to integrate these variable re- newables into a power grid (e.g., installing additional, flexible generation capacities and/or electricity storage technologies on the grid), and the costs associated with such measures. In contrast, it is assumed that concen- trated solar power (CSP) plants have some form of heat storage to deliver power on demand and thus do not in- crease the operating reserve requirement [2]. This sub- model also accounts for the cost of constructing adequate transmission capacity from renewable distributed gen- erators to the nearest grid that must be built specifically to carry their generation. Table 1 shows the input data for electricity generation technologies other than non-biomass renewables, while Table 2 shows the input data for CO2 capture technolo- gies for power plants (which represent the bulk of the Table 1. Data for electricity generation technologies other than non-biomass renew ablesa. Technologies Capital costb (US$2000/kW) Conversion efficiencyb (%, LHV basis) Maximum capacity factor (%) Technical lifetime (years) Coal-fired steam cycle 1,500-1,170 43.0-52.0 85 40 Coal IGCC 1,680-1,300 46.0-54.0 85 40 Coal IGCC-SOFC 2,080-1,830 56.0-60.0 85 30 Oil-fired steam cycle 760-640 43.0-52.0 85 30 NGCC 630-530 57.0-63.0 85 30 NGCC-SOFC 1,260-1,060 66.0-70.0 85 30 Light-water nuclear r eactor 2,350-2,100 34.0-37.0 85 40 Biomass-fired steam cycle using wood chips 1,880-1,460 24.9-34.0 85 30 using wood pellets 1,790-1,400 28.5-34.0 85 30 using grain residues 2,120-1,660 24.9-34.0 85 30 using sugarcane residues (a uniform mixture of bagasse and trash) 1,880-1,460 22.1-30.2 (el ect ricity) 18.5 (heat) 85 30 using black liquor 4,420-3,440 12.4-13.0 (electricity) 61.0 (heat) 85 30 using municipal wastes 1,630-1,270 22.7-31.0 85 30 Biomass IGCC using wood chips 2,390-1,530 37.6-45.0 85 30 using wood pellets 2,300-1,470 39.8-47.1 85 30 using sugarcane residues (a uniform mixture of bagasse and trash) 2,780-1,780 32.4-37.9 (electricity) 18.5 (heat) 85 30 using black liquor 2,010-1,280 25.4-28.7 (electricity) 45.7 (heat) 85 30 Biogas-fueled gas engine for CHP applications 3,200-1,650 35.9-40.0 (electricity) 84.0 (total efficiency) 85 20 a Sources: [3,12,14-21]. LHV = lower heating value; IGCC = integrated gasification combined cycle; NGCC = natural gas combined cycle; CHP = co mbined heat and po wer; SOFC = solid oxide fuel cell. b These ranges denote the assumed evolution of the parameter values over the period 2010-2050. All cost num- bers are based on North American manufacture and construction. Copyright © 2013 SciRes. IJCCE  T. TAKESHITA 38 overall CCS costs). The input data for six types of sta- tionary fuel cell technologies for CHP applications are not presented here because of space limitations. The ac- tual model inputs for capital costs vary by word region by applying a region-specific plant location factor (see [22] for the location factor values). Table 3 shows the global technical potential of six non-biomass renewable electricity technologies at different cos t ca teg orie s. Th es e non-biomass renewable resource availability estimates were allocated to the 48 energy production and consump- tion regions based on data provided by [23]. Although not shown here, electricity generation technologies are also characterized by their load-following, quick-start, and operating/sp inning reserve capabilities. This submodel includes batteries and hydro-pumping as electricity storage technologies. The capital cost of batteries is assumed to decrease from 1,790 US$2000/kW in 2010 to 1,290 US$2000/kW in 2050, while their round trip efficiency is assumed to increase from 77% in 2010 to 82% in 2050 [13]. On the other hand, there is assumed to be potential for approximately 1,000 GW of pumped storage capacity worldwide, while the overall efficiency of pumped storage is assumed to be 80% [2]. The cost of pumped storage systems is assumed to be 20% to 200% higher than that of equivalent unpumped hydropower systems depending on the cost category [2]. There are two important constraints imposed to inte- gration of variable renewables into a power grid. First, the planning reserve margin constraints ensure that the sum of (1) the capacities of dispatchable generators and storage technologies and (2) the capacity value of vari- able renewable generators as represented by their effec- tive load-carrying capability is larger than the annual peak load plus a reserve margin. The capacity value of each type of variable renewable electricity generation technology was calculated for each region and each time point using the approach proposed by [13,24]. Second, the operating reserve constraints ensure that the sum of the capacities of spinning reserves, quick-starts, and storage technologies is larger than the normal operating reserve requirement plus that imposed by variable re- newables. The normal operating reserve requirement and the additional operating reserve requirement per unit ca- pacity of variable renewable generators were calculated for each region, each time-slice, and each time point us- ing the approach proposed by [13]. Table 2. Data for CO2 capture technologies for new pow er plantsa. Technologies Incremental capital costsb (US$2000/t-C/year) Electric power requiredb (MWh/t-C) CO2 capture efficiency (%) Post-combustion ca pt ure from coal steam cycle plants 240-210 1.077-0.861 90 Oxyfuel combustion c a p tu re from coal steam cy c l e p l a nts 340-300 1.077-0.861 95 Pre-combustion capture from coal IGCC plants 130-110 0.861-0.646 90 Post-combustion capture from NGCC plants 370-330 1.535-1.343 90 Oxyfuel combustion capture from NGCC plants 470-420 1.814-1.633 95 Pre-combustion capture from biomass IGCC plants 280-250 0.702-0.526 90 Pre-combustion captur e f rom black liquor IG C C p la nt s 160-140 0.373-0.280 90 a Sources: [3,12,17,19,20]. b These ranges denote the assumed evolution of the parameter values over the period 2010-2050. All cost numbers are based on North American manufacture an d constructi on. The incremental capital costs of CO2 capture are assumed to be 60% higher for existing power plants than for new power plants, while the electric p ower consump tion for CO2 capture is a s sumed to be 32% higher for existing power p lants than for new power plants [12]. Table 3. Technical potential of non-biomass renewable electricity supply in 2050 by cost category, in TWh/yeara. Renewable electricity type < 30 US$2000/MWh 30 – 50 US$2000/MWh 50 – 100 US$2000/MWh 100 – 150 US$2000/MWh 150 – 200 US$2000/MWh Hydroelectricity 3,151 6,673 4,065 0 0 Geothermal electricity 82 1,183 11,236 0 0 Onshore wind powerb 1,254 23,891 70,562 9,570 0 Offshore wind powerb 0 127 1,436 4,827 0 CSPc 0 42,842 180,753 52,377 0 Solar PV powerc 54 450,314 14,601 5,032 0 a Sources: [10,11]. b The technical potential of onshore and offshore wind power is assumed to increase at an annual rate of 0.54% and 0.42%, respectively, until 2050, while the generation costs of onshore and offshore wind power are assumed to decrease at an annual rate of 1.04% and 1.03%, respectively, until 2030. c The technical potential of CSP and PV is assumed to increase at an annual rate of 0.48% and 1.14%, respectively, until 2050, while the generation costs of CSP and PV are assumed to decrease at an annual rate of 3.52% and 4. 59%, respec tively, until 2050. Copyright © 2013 SciRes. IJCCE 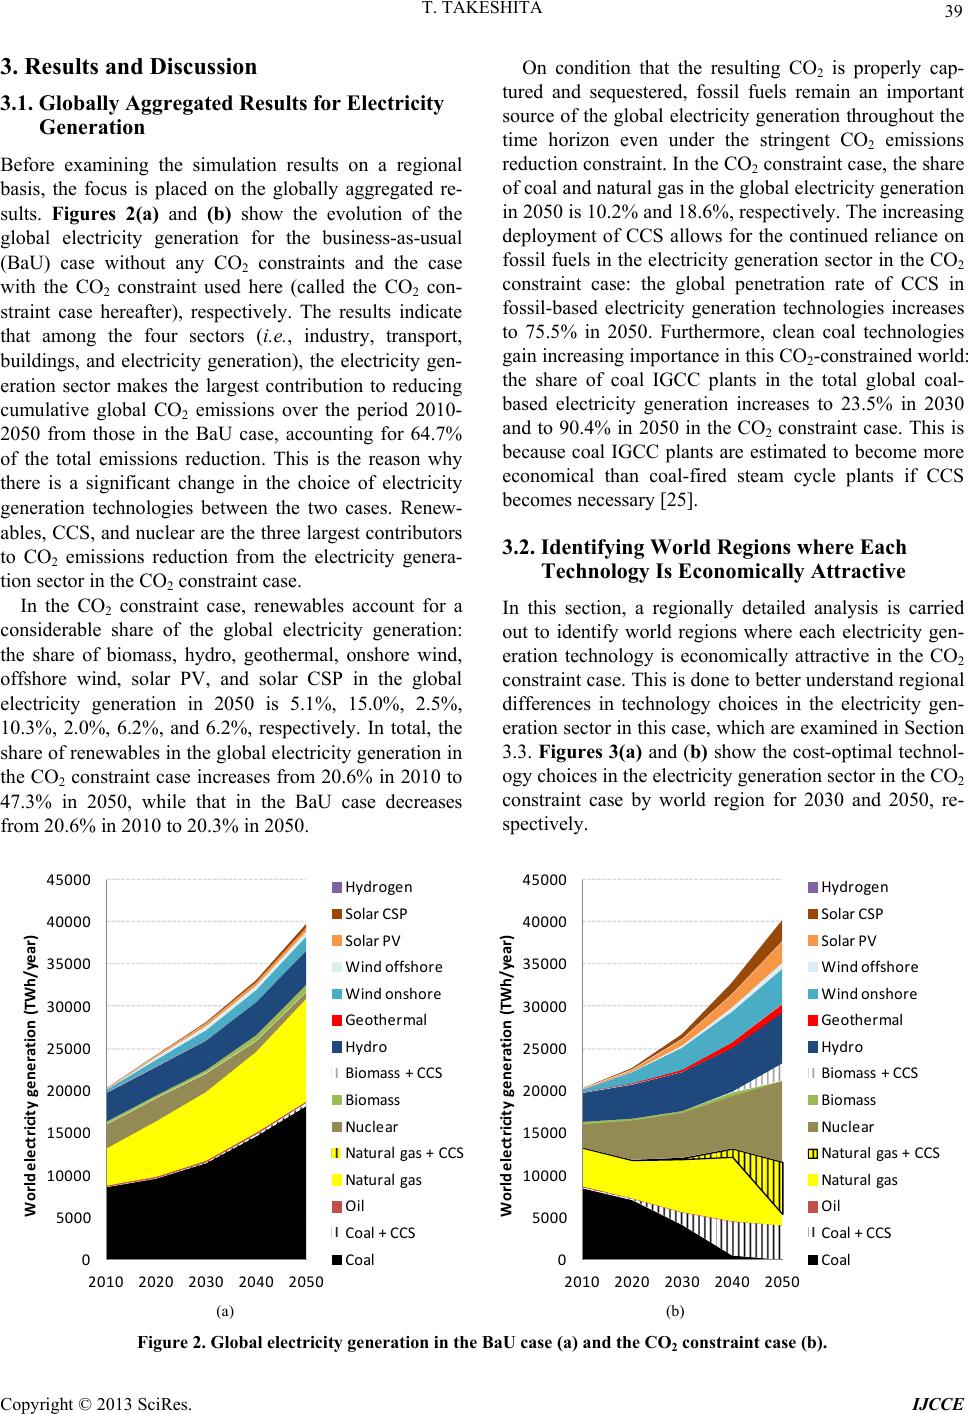 T. TAKESHITA 39 3. Results and Discussion 3.1. Globally Aggregated Results for Electricity Generation Before examining the simulation results on a regional basis, the focus is placed on the globally aggregated re- sults. Figures 2(a) and (b) show the evolution of the global electricity generation for the business-as-usual (BaU) case without any CO2 constraints and the case with the CO2 constraint used here (called the CO2 con- straint case hereafter), respectively. The results indicate that among the four sectors (i.e., industry, transport, buildings, and electricity generation), the electricity gen- eration sector makes the largest contribution to reducing cumulative global CO2 emissions over the period 2010- 2050 from those in the BaU case, accounting for 64.7% of the total emissions reduction. This is the reason why there is a significant change in the choice of electricity generation technologies between the two cases. Renew- ables, CCS, and nuclear are the three largest contributors to CO2 emissions reduction from the electricity genera- tion sector in the CO2 constraint case. In the CO2 constraint case, renewables account for a considerable share of the global electricity generation: the share of biomass, hydro, geothermal, onshore wind, offshore wind, solar PV, and solar CSP in the global electricity generation in 2050 is 5.1%, 15.0%, 2.5%, 10.3%, 2.0%, 6.2%, and 6.2%, respectively. In total, the share of renewables in the global electricity generation in the CO2 constraint case increases from 20.6% in 2010 to 47.3% in 2050, while that in the BaU case decreases from 20.6% in 2010 to 20.3% in 2050. On condition that the resulting CO2 is properly cap- tured and sequestered, fossil fuels remain an important source of the global electricity gen eration throughout the time horizon even under the stringent CO2 emissions reduction constraint. In the CO2 constraint case, the share of coal and natural gas in the global electricity generation in 2050 is 10.2% and 18.6%, respectively. The increasing deployment of CCS allows for the continued reliance on fossil fuels in the electricity generation sector in the CO2 constraint case: the global penetration rate of CCS in fossil-based electricity generation technologies increases to 75.5% in 2050. Furthermore, clean coal technologies gain increasing impor tance in this CO2-constrained world: the share of coal IGCC plants in the total global coal- based electricity generation increases to 23.5% in 2030 and to 90.4% in 2050 in the CO2 constraint case. This is because coal IGCC plants are estimated to become more economical than coal-fired steam cycle plants if CCS becomes necessary [25]. 3.2. Identifying World Regions where Each Technology Is Economically Attractive In this section, a regionally detailed analysis is carried out to identify world regions where each electricity gen- eration technology is economically attractive in the CO2 constraint case. This is done to better understand regional differences in technology choices in the electricity gen- eration sector in this case, which are examined in Section 3.3. Figures 3(a) and (b) show the cost-optimal technol- ogy choices in the electricity generation sector in the CO2 constraint case by world region for 2030 and 2050, re- spectively. 0 5000 10000 15000 20000 25000 30000 35000 40000 45000 2010 2020 2030 2040 2050 Worldelectricityge n erat io n (TWh/year) Hydrogen SolarCSP SolarPV Windoffshore Windonshor e Geoth ermal Hydro Biomass+CCS Biomass Nu cl ear Natura l gas+CCS Natura l gas Oil Coal+CCS Coal 0 5000 10000 15000 20000 25000 30000 35000 40000 45000 2010 2020 2030 2040 2050 Worldelectricityge n erat io n (TWh/year) Hydrogen SolarCSP SolarPV Windoffshore Windonshor e Geoth ermal Hydro Biomass+CCS Biomass Nu cl ear Natura l gas+CCS Natura l gas Oil Coal+CCS Coal (a) (b) Figure 2. Global electricity generation in the BaU case (a) and the CO2 constraint case (b). Copyright © 2013 SciRes. IJCCE 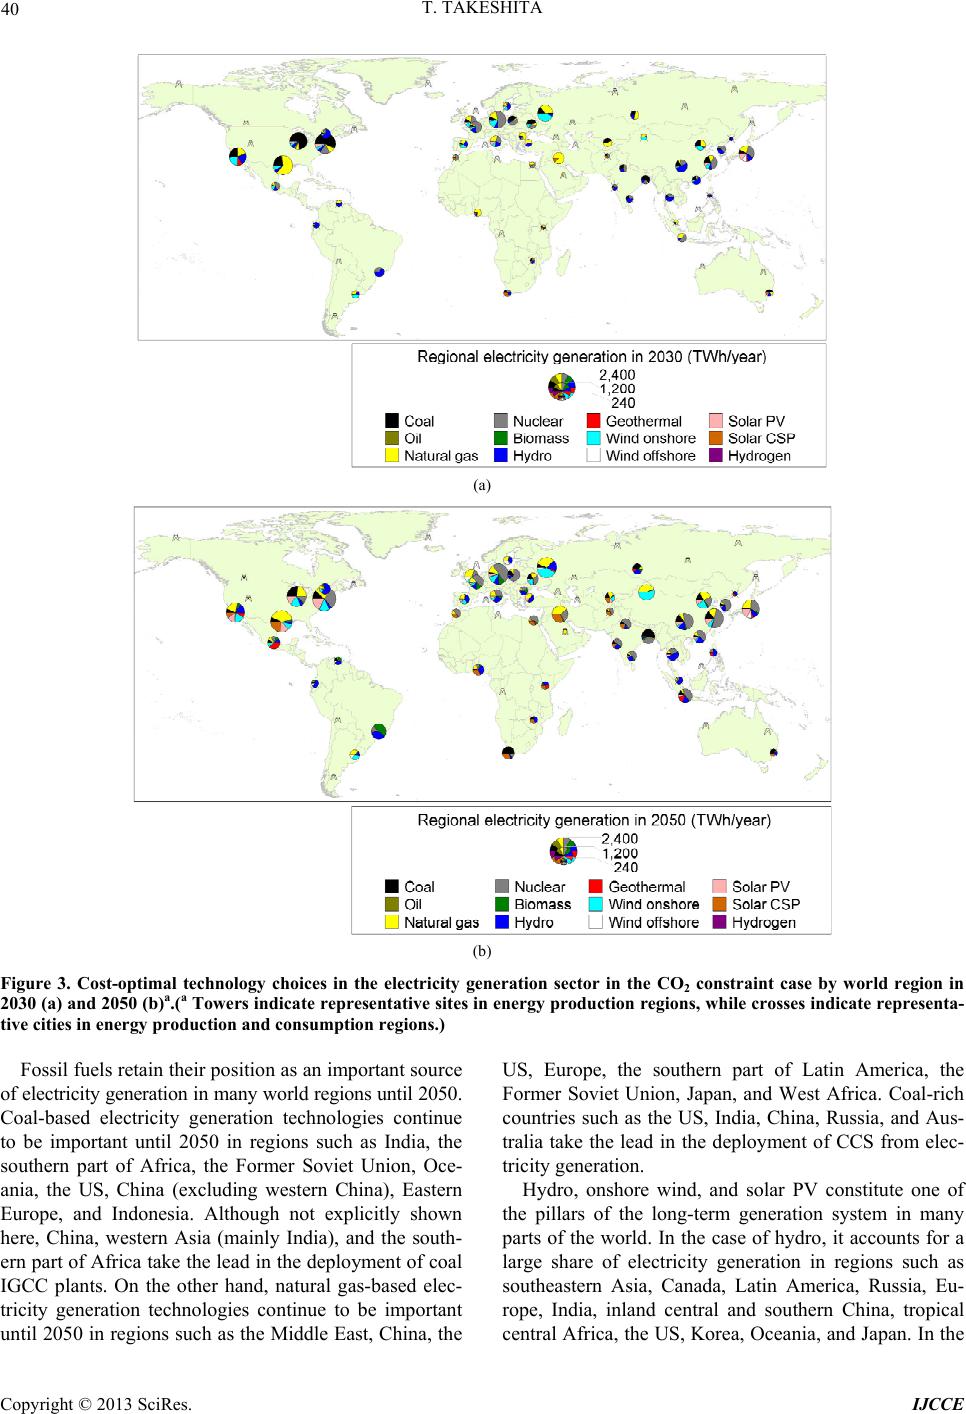 T. TAKESHITA 40 (a) (b) Figure 3. Cost-optimal technology choices in the electricity generation sector in the CO2 constraint case by world region in 2030 (a) and 2050 (b)a.(a Towers indicate representative sites in energy production regions, while crosses indicate representa- tive cities in energy production and consumption re gions. ) Fossil fuels retain their position as an important sou rce of electricity generation in many world regions until 2050. Coal-based electricity generation technologies continue to be important until 2050 in regions such as India, the southern part of Africa, the Former Soviet Union, Oce- ania, the US, China (excluding western China), Eastern Europe, and Indonesia. Although not explicitly shown here, China, western Asia (mainly India), and the south- ern part of Africa take the lead in the deployment of coal IGCC plants. On the other hand, natural gas-based elec- tricity generation technologies continue to be important until 2050 in reg ions such as the Middle East, Chin a, the US, Europe, the southern part of Latin America, the Former Soviet Union, Japan, and West Africa. Coal-rich countries such as the US, India, China, Russia, and Aus- tralia take the lead in the deployment of CCS from elec- tricity generation. Hydro, onshore wind, and solar PV constitute one of the pillars of the long-term generation system in many parts of the world. In the case of hydro, it accounts for a large share of electricity generation in regions such as southeastern Asia, Canada, Latin America, Russia, Eu- rope, India, inland central and southern China, tropical central Africa, the US, Korea, Oceania, and Japan. In the Copyright © 2013 SciRes. IJCCE  T. TAKESHITA 41 case of onshore wind, it penetrates into the generation system in regions such as China, the southern part of Latin America, Western Europe, the Former Soviet Un- ion, and North America. In the case of solar PV, it pene- trates into the generation system in regions such as Jap an, the US, China (excluding western China), Western Eu- rope, Korea, parts of the Former Soviet Union, and southeastern Asia. This result is comparable to that of the International Energy Agency [2], which projected that solar PV would grow very significantly in solar-rich in- dustrialized countries (particularly in the US) and China. In regions where onshore wind and/or solar PV are de- ployed, natural gas-based electricity plants and/or flexi- ble hydroelectricity plants play a major role as a backup for these variable renewables. In contrast, biomass-based electricity generation tech- nologies (mainly biomass IGCC plants), geothermal electricity generation technologies, and offshore wind electricity generation technologies participate visibly in the electricity generation mix in a limited number of world regions in the long term. In 2050, biomass (most of which is combined with CCS) enters the electricity generation mix in biomass-rich regions such as Latin America and Europe. In the case of geothermal, it enters the long-term electricity generation mix in countries around the “Ring of Fire” (e.g., Indonesia, the Philip- pines, Central America, and the western coast of the US), rift zones (e.g., East Africa), and Russia. In the case of offshore wind, it enters the long-term electricity genera- tion mix in Nordic countries, Latin America, the UK and Ireland, Japan, and Korea. Solar CSP has a large share of electricity generation in the widespread Sunbelt regions, which include the Mid- dle East, Africa, Australia, the southern US, and western Asia. In these regions with high direct solar radiation (excluding the southern US), solar PV is excluded from the electricity generation mix. This result is plausible because CSP electricity is estimated to be cheaper than solar PV electricity in the Sunbelt regions [2] and be- cause flexibility measures need to be taken to integrate variable solar PV electricity into a power grid, which worsen its overall economics. 3.3. Regional Differences in Technology Choices in the Electricity Generation Sector Taking into account the findings of Section 3.2, regional differences in long-term technology choices in the elec- tricity generation sector in the CO2 constraint case can be summarized as follows: The long-term generation system in the US is charac- terized by diversified sources of electricity generation such as coal, natural gas, hydro, onshore wind, and solar PV. In addition, so lar CSP plays an important role in the long-term generation system in the southern US, while geothermal is deployed on a large scale in the long-term generation system in the western coast of the US. On the other hand, the Canada’s generation system continues to be dominated by hydroelectricity. The Central America’s long-term generation system is highly diversified and depends largely on geothermal electricity, while onshore and offshore wind play an important role in the genera- tion system in the southern part of Latin America. The long-term generation system in other parts of Latin America is characterized by a large dependence on hydro and biomass and a small dependence on fossil fuels. A distinctive feature of the long-term generation sys- tem in Western Europe and the southern part of Eastern Europe is that its components include hydroelectricity plants, onshore wind electricity plants (except in Turkey, Greece, Cyprus, and Eastern European countries), bio- mass-based electricity plants, and solar PV electricity plants (except in the UK, Ireland, and Nordic countries) and that it depends much less on coal-based electricity plants. Offshore wind is a significant part of the long- term generation system in the UK, Ireland, and Nordic countries. The Former Soviet Union’s long-term genera- tion system varies significantly by region. Coal, hydro, and geothermal are common sources of electricity gen- eration in Russia in the long term, while onshore and offshore wind are deployed on a large scale in the long-term generation system in the western part of the Former Soviet Union. Natural gas continues to dominate the Middle East’s generation system. Also, the long-term generation system in the Middle East and Africa is characterized by a large dependence on solar CSP. Coal and hydro play marginal roles in the generation system in the Middle East and North Africa, while natural gas plays an important role only in the West Africa’s generation system among Sub-Saharan Africa. Geothermal is deployed on a large scale in the East Africa’s long-term generation system, while coal with CCS has a large share of the long-term generation system in the southern part of Africa. The China’s long-term generation system can be clas- sified into three types. First, onshore wind and solar PV participate visibly in the generation system in northern and eastern China, but hydro has a very small participa- tion in it. Second, the generation system in inland central and southern China is highly diversified, in which coal, natural gas, nuclear, hydro, onshore wind, and solar PV have a visible participation. Third, the western China’s generation system is dominated by natural gas and on- shore wind. The western Asia’s generation system is characterized by a small dependence on natural gas and wind (except in the northern part of western Asia). Not solar CSP but solar PV participates in the long-term generation system in eastern and southern India with the eastern India’s Copyright © 2013 SciRes. IJCCE  T. TAKESHITA 42 generation system relying heavily on coal with CCS. In contrast, solar CSP plays an important role in the long-term generation system in other parts of western Asia. Solar CSP and solar PV co-exist in the long-term generation system in the northern part of western Asia. The southeastern Asia’s long-term generation system is characterized by a large dependence on hydro, partici- pation of solar PV, and absence of wind. Geothermal is deployed on a large scale in the long-term generation system in Indonesia and the Philippines. There are simi- larities in the long-term generation system in Japan and Korea, that is, these systems consist mainly of natural gas, nuclear, hydro, offshore wind, and solar PV. In addition, geothermal constitutes one of the pillars of the Japan’s long-term generation system. On the other hand, coal with CCS, hydro, and solar CSP are the major compo- nents of the Oceania’s long-term generation system. 4. Conclusions Using the regionally disaggregated global energy system model with a detailed treatment of the electricity supply sector, this paper has derived the cost-optimal choice of electricity generation technolog ies in regional detail over the period to 2050 under the constraint of halving global energy-related CO2 emissions in 2050 compared to the 2000 level. The majo r find ings and notes are su mmarized below: First, all the seven renewable power sources consid- ered in this study and the two fossil power sources, coal and natural gas, will become cost-competitive in the long-term global generation system under the stringent CO2 constraint used here. For these two fossil fuels to remain important power sources throughout the time ho- rizon even under the stringent CO2 constraint, the CO2 resulting from fossil fuel co mbu stion /co nversio n needs to be properly captured and sequestered. According to the simulation results, fossil-based power plants with CCS produce 75.5% of the total global fossil-based electricity generation in 2050. Among all the renewable power sources, hydro will continue to account for the largest share of the global electricity generation, followed by onshore wind, solar PV, solar CSP, and biomass. Off- shore wind and geothermal sources are less competitive than the other renewable pow e r s ources. Second, a future generation system in each world re- gion will evolve over time in a very different manner to form a regionally highly diverse electricity supply struc- ture. For example, the long-term generation syste m in the northeastern US and northern and eastern China consists mainly of coal, natural gas, nuclear, onshore wind, and solar PV, while that in Japan and Korea consists mainly of natural gas, nuclear, hydro, offshore wind, and solar PV. The main components of the Western Europe’s long-term generation system include natural gas, nuclear, biomass, hydro, onshore and/or offshore wind, and solar PV. Solar CSP plays an important role in the long-term generation system in the Middle East, Africa, Australia, the southern US, and western Asia, while hydro has a large share of the long-term generation system in Canada, Latin America, inland central and southern China, and southeastern Asia. Such a large regional difference in long-term generation systems is caused mainly by re- gional characteristics in terms of primary energy resource endowments, the need for a backup for variable renew- ables, the seasonal and daily load pattern, and the eco- nomics of CCS. The results of this study must be interpreted with the following two limitations in mind. First, although the model solutions presented here are optimal in terms of cost under the stringent CO2 constraint, electricity gen- eration systems in the “real world” are designed to meet not only the goals of cost-effectiveness and reduced GHG emissions, but also other goals (e.g., of improved energy security and increased public acceptance), which are important but very difficult to consider in bottom-up optimization models like REDGEM70. Second, policy actions, targets, and incentives to reduce GHG emissions, to promote renewables, etc. have a large impact on the choice of technologies in the “real world”, which are only partially considered in the model due to the lack of worldwide information. Nevertheless, this study is novel and significant in that the findings obtained from the re- gionally disaggregated results have important implica- tions for the cost-optimal deployment of different elec- tricity generation technologies under CO2 constraints in many countries and regions. REFERENCES [1] R. Moncel, P. Joffe, K. McCall and K. Levin, “Building the Climate Change Regime,” World Resource Institute, Washington DC, 2011. [2] International Energy Agency (IEA), “Energy Technology Perspectives 2008,” IEA, Paris, 2008. [3] IEA, “Energy Technology Perspectives 2010,” IEA, Paris, 2010. [4] T. Takeshita and K. Yamaji, “Important Roles of Fisch- er-Tropsch Synfuels in the Global Energy Future,” En- ergy Policy, Vol. 36, No. 8, 2008, pp. 2791-2802. doi:10.1016/j.enpol.2008.02.044 [5] T. Takeshita, “Assessing the Co-Benefits of CO2 Mitiga- tion on Air Pollutants Emissions from Road Vehicles,” Applied Energy, Vol. 97, 2012, pp. 225-237. doi:10.1016/j.apenergy.2011.12.029 [6] B. Metz, O. Davidson, P. Bosch, R. Dave and L. Meyer, Eds., “Climate Change 2007: Mitigation,” Contribution of Working Group III to the 4th Assessment Report of the Intergovernmental Panel on Climate Change (IPCC), Cambridge University Press, New York, 2007. Copyright © 2013 SciRes. IJCCE  T. TAKESHITA Copyright © 2013 SciRes. IJCCE 43 [7] International Institute for Applied Systems Analysis, “GGI Scenario Database,” 2007. http://www.iiasa.ac.at/Research/GGI/DB/ [8] H.-H. Rogner, “Energy Resources and Potentials,” In: T. B. Johansson, A. Patwardhan, N. Nakicenovic and L. G. Echeverri, Eds., Global Energy Assessment, Cambridge University Press, New York, 2012, pp. 425-512. [9] Organization for Economic Co-Operation and Develop- ment (OECD) Nuclear Energy Agency (NEA) and Inter- national Atomic Energy Agency, “Uranium 2001: Re- sources, Production and Demand,” OECD, Paris, 2002. [10] M. Hoogwijk and W. Graus, “Global Potential of Re- newable Energy Sources: A Literature Assessment,” ECOFYS, Utrecht, The Netherlands, 2008. [11] W. Turkenburg, “Renewable Energy,” In: T. B. Johans- son, A. Patwardhan, N. Nakicenovic and L. G. Echeverri, Eds., Global Energy Assessment, Cambridge University Press, New York, 2012, pp. 761-900. [12] T. Takeshita, “A Strategy for Introducing Modern Bio- energy into Developing Asia to Avoid Dangerous Climate Change,” Applied Energy, Vol. 86, 2009, pp. S222-S232. doi:10.1016/j.apenergy.2009.04.023 [13] W. Short, N. Blair, P. Sullivan and T. Mai, “ReEDS Model Documentation: Base Case Data and Model De- scription,” National Renewable Energy Laboratory, Golden, CO, 2009. [14] M. Grahn, C. Azar, M. I. Williander, J. E. Anderson, S. A. Mueller and T. J. Wallington, “Fuel and Vehicle Tech- nology Choices for Passenger Vehicles in Achieving Stringent CO2 Targets: Connections between Transporta- tion and Other Energy Sectors,” Environmental Science & Technology, Vol. 43, No. 9, 2009, pp. 3365-3371. doi:10.1021/es802651r [15] E. D. Larson, “Technology for Electricity and Fuels from Biomass,” Annual Review of Energy and the Environment, Vol. 18, 1993, pp. 567-630. doi:10.1146/annurev.eg.18.110193.003031 [16] CES-KULeuven-VITO, “The Belgian MARKAL Data- base,” DWTC/SSTC, Brussel, 2001. [17] IEA, “Prospects for CO2 Capture and Storage,” IEA, Paris, 2004. [18] IEA, “Prospects for Hydrogen and Fuel Cells,” IEA, Paris, 2005. [19] IEA and NEA, “Projected Costs of Generating Electric- ity,” OECD, Paris, 2005. [20] IPCC, “Special Report on Carbon Dioxide Capture and Storage,” Cambridge University Press, Cambridge, 2005. [21] IEA and NEA, “Projected Costs of Generating Electricity 2010 Edition,” OECD, Paris, 2010. [22] T. Takeshita and K. Yamaji, “Potential Contribution of Coal to the Future Global Energy System,” Environ- mental Economics and Policy Studies, Vol. 8, No. 1, 2006, pp. 55-88. doi:10.1007/s10018-005-0123-x [23] IEA, “Renewables for Power Generation,” IEA, Paris, 2003. [24] IEA, “World Energy Outlook 2011,” IEA, Paris, 2011. [25] J. David and H. Herzog, “The Cost of Carbon Capture,” Proceedings of the 5th International Conference on Greenhouse Gas Control Technologies, Cairns, Australia, 13-16 August, 2000.
|