 Journal of Geographic Information System, 2013, 5, 337-346 http://dx.doi.org/10.4236/jgis.2013.54032 Published Online August 2013 (http://www.scirp.org/journal/jgis) Spatial Analysis of Affected Areas by Extreme Hydrological Events in Rio de Janeiro (The Host City for the 2016 Olympic Games)—Brazil Leandro Andrei Beser de Deus1,2, Camilla Silva Motta Santos2, Patricia Gomes da Silveira2, Marcos Aurélio Vasconcelos Freitas2, Paulo Márcio Leal Menezes2 1Federal Rural University of Rio de Janeiro, Rio de Janeiro, Brazil 2Federal University of Rio de Janeiro, Rio de Janeiro, Brazil Email: leandroandrei@yahoo.com.br Received April 2, 2013; revised May 12, 2013; accepted June 12, 2013 Copyright © 2013 Leandro Andrei Beser de Deus et al. This is an open access article distributed under the Creative Commons Attri- bution License, which permits unrestricted use, distribution, and reproduction in any medium, provided the original work is properly cited. ABSTRACT The most frequent types of disasters in Brazil are associated with extreme hydrological events. Adding to this situation, in Brazil, there are the extreme sociospatial discrepancies that are historically constructed. They leave marks in space, making specific areas, for political interest or not, more vulnerable to the different mentioned processes. To this extent, the public management should plan actions and, also, it may act in a more holistic way adding new trends, such as, the use of geotechnologies that are applied to environmental management in the realm of urban planning. From a case study in the city of Rio de Janeiro, this paper aims to contribute and draw attention to such issues. It may reach its target through pointing and spatially analyzing which areas are in the most critical situation related to the occurrence of ex- treme hydrological events. To achieve this goal, it was proposed a methodology to inventory the occurrence of inunda- tion/flooding for a certain period, in this case 2001-2008. Besides, the methodology could systematize data and inte- grate them with other important issues for supporting the process of identification and analysis of the most critical areas. Historical aspects of occupation and the most vulnerable socio-environmental aspects were raised, too, in order to vali- date the highlighted areas. This integration was enabled concerning the support of geoprocessing techniques. The results of this integr ation subsidized the mapping an d spatial analysis of the affected areas in the city and the criticality in rela- tion to the extreme hydrological events. Finally, it was possible to observe that the identification of the most critical affected areas does not mean the exhaustion of the subject. The location of these areas is directly linked to the sample that was used as the basis for analyses. This data set only represents recorded events by the Municipal Civil Defense re- specting the studied time frame. However, the results permit to take notes and raise relevant environmental questions about the roots and the occurred impacts that were originated from the extreme hydrological events, which have been observed in recent decades. Keywords: Extreme Events; Flood Hazards; GIS; Hydric Resources; Spatial Analysis 1. Introduction The most frequent types of disasters in Brazil are associ- ated with extreme hydrological events. According to Emergency Events Database [1], during the period of 1900-2006, the majority of these disasters (over than 80%) are associated with severe atmospheric instability, which is responsible for triggering off inundation, gale, tornadoes, hail and slid ing [2]. Adding to this situation, in Brazil, there are the ex- treme sociospatial discrepancies that are historically con- structed. Besides, they leave marks in space, making specific areas, for political interest or not, more vulner- able to the different mentioned processes. Anthropic ac- tion seems to produce an effect on such system and it is also focused on sp ace, producing great changes that may bring significant impacts (often irreparably) on the own mankind and the nature. On the other hand, the urban space and its different dimensions often suffer the pres- sures of the growing demand and the lack of planning and infrastructure that are typical of developing coun- tries. C opyright © 2013 SciRes. JGIS  L. A. BESER DE DEUS ET AL. 338 More recently, several papers were published based on the subject of Extreme Events, especially about Droughts and Floods in general and/or specific way. Moreover, they were applied in different areas and different scales of analysis. Some of them may be mentioned: [3-9]. Nowadays, it appears that the main impacts of climatic and extreme hydrological events are intensified by defi- ciencies in urban planning, in regional and local scales and, in practice, in the lack of an integrated view of management, creating irreversible damage to downstr eam. It should be highlighted that, in general, the regional and local scales require approaches that focus on collective interests. Considerin g thi s scenar io, PIRES DO RIO & G AL V Ã O [10] explain that the notion of management may assume a wider connotation today. Moreover, based on this new reality, the environmental management is presented as a keyword for the strategies of companies and public ac- tors. It may be understood that the environmental man- agement “can not be grasped in its entirety outside the processual context of the organization of space, which is social and historical”. Through spatial analysis, the geo- graphical approach can bring elements of reflection, par- ticularly with regard to the scales and strategies of inter- vention in space, to the process of decision making and to the impositions of institutionalized actors. To this extent, the public management should plan ac- tions and, also, it may act in a more holistic way adding new trends, such as, the use of geotechnologies that are applied to environmental management in the realm of urban planning. From a case study in the city of Rio de Janeiro, this paper aims to contribute and draw attention to such issues. It may reach its target through pointing and spatially analyzing which areas are in the most criti- cal situation related to the occurrence of extreme hydro- logical events. Consequently, these specific areas deserve greater attention from the government and from the plan- ning agencies and the urba n management. To achieve this goal, it will be proposed a methodol- ogy to inventory the occurrence of inundation/flooding for a certain period, in this case 2001-2008. Besides, the methodology may systematize data and integrate them with other important issues that can support the process of identification and analysis of the most critical areas. Historical aspects of occupation and the most vulnerable socio-environmental aspects will be raised, too, in order to validate the highlighted areas. This integration will be enabled concerning the support of geoprocessing tech- niques. The result of this integration will subsidize the mapping and spatial analysis of the affected areas in the city and the criticality in relation to the extreme hydro- logical events. Finally, it may be considered that the identification and analysis of these areas can act as fun- damental tools to guide the remaining steps of the proc- ess of environmental management within the urban con- text. It should be observed that the identification of the most critical affected areas does not mean the exhaustion of the subject. The location of these areas is directly linked to the sample that was used as the basis for analy- ses. This data set only represents recorded events by the Municipal Civil Defense respecting the studied time frame. However, the results permit to take notes and raise relevant environmental questions about the roots and the occurred impacts that were originated from the extreme hydrological events, which have been observed in recent decades. 2. Extreme Hydrological Events and the City of Rio de Janeiro 2.1. Hydrological Cycle and the Land-Use Planning The capacity of water to renew itself continuously is property that renders it different from other natural re- sources. Its natural behavior is characterized by the con- cept of hydrological cycle, which can be regarded as a close system of global scale. In other words, it is a sys- tem that has input and output of energy, but there is con- servation of mass and the water circulates between the earth’s surface and the atmosphere [11]. Water is the main element of the hydrological cycle and it can be found in solid, liquid or gas phase, depending on the adequate temperature conditions and pressure. In the liquid phase, the water has direct relevance to humans, because it is available for using in the atmos- phere as rain, in the earth’s surface, in lakes, rivers and oceans or in the ground in aquifers. The main energy sources that drive the hydrological cycle and allow its continuity are the solar energy and the gravity. The exchange between the circulations of the surface and atmosphere may occur in two ways (Figure 1): In the sense of surface-atmosphere, where the water flow fundamentally occurs in steam form as a conse- quence of the phenomena of evaporation and transpi- ration; In the sense of atmosphere-surface, where the trans- fer of water occurs in any physical state, however, the precipitations of rain and snow are more signifi- cant. Based on the difficulty in directing the dynamic of ur- ban growth in large cities, which often ignores the natu- ral functions of rivers and, besides, it impermeabilizes and occupies new areas, including those subject to inun- dation, there is frequently th e need to review both criteria and data of projects. This need aims at human welfare and conservation of natural elements in order to realize Copyright © 2013 SciRes. JGIS  L. A. BESER DE DEUS ET AL. 339 Figure 1. Movement and changes of water in the hydro- logical cycle. Source: [12]. interventions that are con sistent with a sustainable model of occupation. Fostering the comprehension of basic concepts of the hydrological cycle, a set of ideas, suggestions and actions should be incorporated into regional and local global planning. Consequently, that action strengthens the ex- pected effects of strategically designed works within the scope of dr a inage basin [13]. 2.2. Floods, Inundations and Flooding In a general aspect, disasters are results of adverse events, natural or provoked by man, on a vulnerable ecosystem. Therefore, a sequence of damage may be caused, for in- stance, in human, material, social and environmental scenarios. Thus, the intensity of a disaster depends on the interaction between the magnitude of the adverse event and the vulnerability of the receiving system. Moreover, it is quantified in terms of damages and impairment that are characterized. In Brazil, the most common natural disasters are inundation, droughts, erosion and landslides (Figure 2). Regarding floods, rain water seems to seek the paths that are offered by the natural and/or artificial drainage after supplying the natural retention of vegetation, satu- rating the void of soil and filling in th e depression s of the ground. In this way, rain water flows until the maximum available capacity in the direction of the water body as the final receptor. Such limits can be overcome and the exceeded volumes may invade marginal areas depending on both a number of physical factors and the proportions of the rain. When these marginal areas are occupied by man, the water comes into direct conf lict with his saving s, improvements and activities [13]. The increase in surface flow can be caused by many immediate and/or competitive factors. In Brazil, in the majority of times, it is caused by intense rainfall, which originates overflow of rivers, lakes, canals and im- poundment areas [15]. Only in 2000, about 1.7 million of people were af- fected by inundation, which corresponds to 1% of Bra- zilian population. Based on a record of 89 dead and Figure 2. Major natural disasters in Brazil between 2000 and 2007. Source: adapted from MMA [14]. 16,045 homeless, there was an application of $11.9 mil- lions of federal resources in assistance actions, beyond the contribution of state and municipal resources [15]. Nowadays, this situation seems to be more critical. News of floods occurrences in various parts of the country is constantly broadcast in media. The most fre- quent occurrences are related to large cities, such as São Paulo and Rio de Janeiro, where the floods may cause serious problems to society [14]. This mentioned circum- stance can be aggravated by certain factors, for instance, the density of land occupation, the types of buildings, the existence of water supply network and sewage [16]. It is important to emphasize that the performed human interventions along the drainage basin represent the ma- jor cause of damage, or they may exacerbate or reduce the magnitude of floods. As it was previously mentioned, the urbanization may waterproof the soils causing the increase of the volumes of superficially runoff. For this reason, it also does change the dynamics of these natural environments in which their respo nse to human interven- tions may come in the form of disasters. An urbanized basin may present a response time 5 to 20 times smaller than a natural basin. This reduction in response time renders the basin more sensitive to shorter rainfall, which are more intense [14]. Control and/or prevention measures intend to mini- mize the inundations damage. According to TUCCI [11], they are dealt with two different ways, though comple- mentary ways: structural measures and nonstructural measures. The first ones involve the traditional engi- neering works to control the floods in order to correct and/or prevent the problems that can arise from them. The nonstructural measures include all kinds of measures that can provide a living with the floods, that is, reduce the damage and/or its consequences. Through this research, it is possible to acknowledge that human actions can significantly increase the risk of inundations. On the other hand, the natural factors are relatively stable. In addition to this point, the human in- duced factors can be changed in time and space and they Copyright © 2013 SciRes. JGIS  L. A. BESER DE DEUS ET AL. 340 may increase the frequency of floods, inundations and flooding. Thus it may be stressed that the environmental policies that were elaborated by the competent parts should consider that “(...) the vulnerability to natu ral dis- asters is linked not only to geoecological aspects of the site (climate, relief, drainage), but, it is especially linked to the socioe conomic status of the population situated on this environment” [17]. 2.3. History of Extreme Events in the City of Rio de Janeiro BRANDÃO [18] depicted the historical intense rain epi- sodes that were considered responsible for social and environmental impacts in the city of Rio de Janeiro. Highlighting two different features: the site of the city and the way it is spatially organized by man, they may influence the occurrence of recent events of larger mag- nitude, for example, the events of 1988 and 1996, amongst others in the city. The massifs of Pedra Branca, Gericinó-Mendanha and, especially, Tijuca Massif guide urban gr owth (Figure 3), imposing a form that is characteristically d ivergen t-linear to urban sprawl. As a consequence, the creation of barri- ers to the movement occurs. They constitute important disperser centers of rainwater that converge to the valley floors and surrounding areas of lowlands where neigh- borhoods of greater density are settled. This site does give the city a unique natural scenery. However, it also generates a series of problems that are related to natural processes affected by urban growth. Therefore, it appears that an aggravation of natural disaster occurrences is no- ticed (op cit: 62). Considering the year of 1988, it may be mentioned that it was registered in the memory of Rio de Janeiro due to one of the biggest meteorological disaster in the his t o ry of the city . Between Februar y 19 and February 22, Figure 3. Massifs in the city of Rio de Janeiro. the urban area of Rio de Janeiro was punished with 384 mm of rain. Half of this volume was precipitated only at night of 19 to 20 (Table 1), as BRANDÃO [18] cited . The magnitude of that rain gives an idea of the strength and torrentiality of the meteorological pheno- menon that befell the city as a real disaster. Deforested hillsides and with poorly consolidated underground slid with great violence, causing destruction and death on an overwhelming scale. (...) Disaster of such magnitude replaced once again the issue of inappropriate use of the environment, where the rule has been dictated by lack of harmony between anthropic action and the laws of nature (op cit: 89). Another year of focu s on this issue is the year of 1996. It was when a violent storm happened affecting the population. It was responsible for the catastrophe that struck the city again (Table 2). The following is a tran- script on this event for the city. The violent storm, that was responsible for the catas- trophe that struck the city on February 13 of 1996, mainly punished the South and West Zones. Besides, it let the sad balance of 59 deaths and 1500 homeless, the most part in the neighborhood of Jacarepaguá. The big- gest intensity of rainfall was 2000 mm in just eight hours, on the southern side of the massif of Tijuca and it caused 38 landslides (...) (op cit: 90). 2.4. Main Environmental Implications According to BRANDÃO [18], the City of Rio de Ja- neiro seems to have, in the geographical position, one of the factors with major significance in its climatic defini- tion. It is located at latitude of 22˚54', in the north of Tropic of Capricorn and the trajectory of the sun pro- duces intense insolation throughout the year. Besides, this latitude may locate Rio de Janeiro in the transac- tional region of conflict between the polar atmospheric systems and intertropical systems. The site of the city constitutes another factor that is equally important to determine its local climatic frame- work. The expansion of the city follo wed in the direction of lowlands of Santa Cruz, Jacarepaguá and Fluminense, practically involving the coastal massifs. Thus, the low- lands and the mountainous parts compose the main physiographic areas of the City of Rio de Janeiro that worked effectively as natural restrictions on the occupa- tion of the city. However, this process can contribute to accentuate some environmental problems that are faced by society considering the fast occupation of urban space. In relation to this aspect, it needs to be observed that the occupation of urban space is not always in accordance with the supported limits by the natural environment (op cit). To a certain extent, Rio de Janeiro is characterized by the complexity of its orography, with irregular hillsides Copyright © 2013 SciRes. JGIS 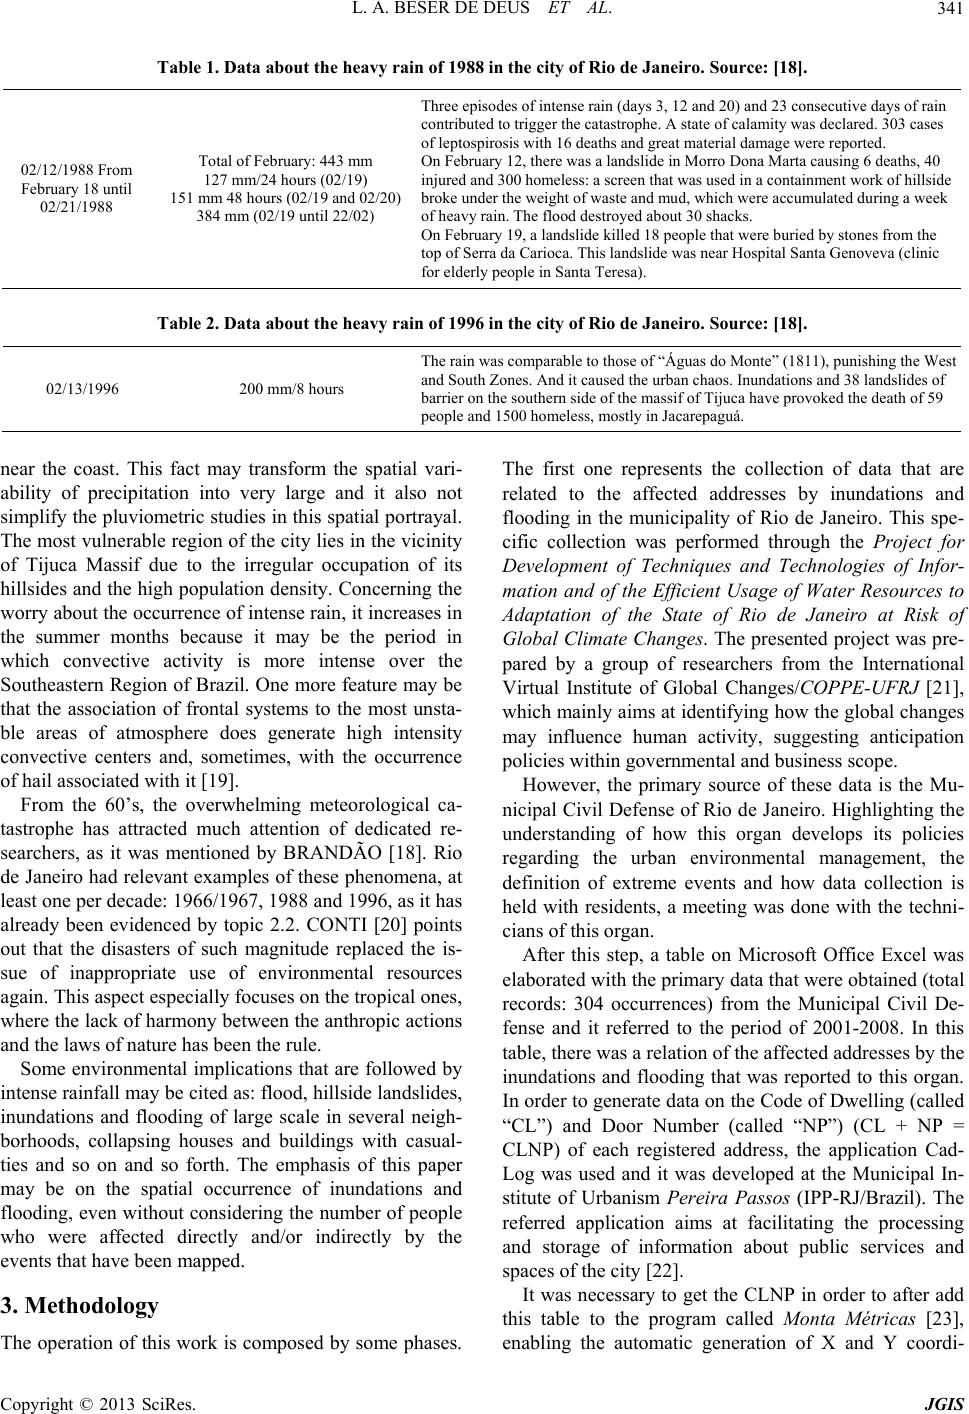 L. A. BESER DE DEUS ET AL. Copyright © 2013 SciRes. JGIS 341 Table 1. Data about the heavy rain of 1988 in the city of Rio de Janeiro. Source: [18]. 02/12/1988 Fr om February 18 until 02/21/1988 Total of February: 443 mm 127 mm/24 hours (02/19) 151 mm 48 hours (02/19 an d 02/20) 384 mm (02/19 until 22/02) Three episodes of intense rain (days 3, 12 and 20) and 23 consecutive days of rain contributed to trigger the catastrophe. A state of calamity was declared. 303 cases of leptospirosis with 16 deaths and great material damage were reported. On February 12, there was a landslide in Morro Dona Ma rta causing 6 deaths, 40 injured and 300 homeless: a screen that was used in a containment work of hillside broke under the weight of waste and mud, which were accumulated during a week of heavy rain. The flood destroyed about 30 shacks. On February 19, a landslide killed 18 people that were buried by stones from the top of Serra da Carioca. This landslide was near Hospital Santa Genoveva (clinic for elderly people in Santa Teresa). Table 2. Data about the heavy rain of 1996 in the city of Rio de Janeiro. Source: [18]. 02/13/1996 200 mm/8 hours The rain was comparable to those of “Águas do Monte” (1811), punishing the West and South Zones. And it caused the urban chaos. Inundations and 38 landslides of barrier on the southern side of the massif of Tijuca have provoked the deat h of 59 people and 1500 homeless, mostly in Jacarepaguá. near the coast. This fact may transform the spatial vari- ability of precipitation into very large and it also not simplify the pluviometric studies in this spatial p ortrayal. The most vulnerable region of the city lies in th e vicinity of Tijuca Massif due to the irregular occupation of its hillsides and the high population density. Concerning the worry about the occurrence of intense rain, it increases in the summer months because it may be the period in which convective activity is more intense over the Southeastern Region of Brazil. One more feature may be that the association of frontal systems to the most unsta- ble areas of atmosphere does generate high intensity convective centers and, sometimes, with the occurrence of hail associated with it [19]. From the 60’s, the overwhelming meteorological ca- tastrophe has attracted much attention of dedicated re- searchers, as it was mentioned by BRANDÃO [18]. Rio de Janeiro had relevant examples of these phenomena, at least one per decade: 1966/1967, 1988 and 1996, as it has already been evidenced by topic 2.2. CONTI [20] points out that the disasters of such magnitude replaced the is- sue of inappropriate use of environmental resources again. This aspect especially focuses on the tropical ones, where the lack of harmony between the anthropic actions and the laws of nature has been the rule. Some environmental implications that are followed by intense rainfall may be cited as: flood, hillside lan dslides, inundations and flooding of large scale in several neigh- borhoods, collapsing houses and buildings with casual- ties and so on and so forth. The emphasis of this paper may be on the spatial occurrence of inundations and flooding, even without considering the number of people who were affected directly and/or indirectly by the events that have been mapped. 3. Methodology The operation of this work is composed by some phases. The first one represents the collection of data that are related to the affected addresses by inundations and flooding in the municipality of Rio de Janeiro. This spe- cific collection was performed through the Project for Development of Techniques and Technologies of Infor- mation and of the Efficient Usage of Water Resources to Adaptation of the State of Rio de Janeiro at Risk of Global Climate Changes. The presented project was pre- pared by a group of researchers from the International Virtual Institute of Global Changes/COPPE-UFRJ [21], which mainly aims at identifying how the global changes may influence human activity, suggesting anticipation policies within governmental and business scope. However, the primary source of these data is the Mu- nicipal Civil Defense of Rio de Janeiro. Highlighting the understanding of how this organ develops its policies regarding the urban environmental management, the definition of extreme events and how data collection is held with residents, a meeting was done with the techni- cians of t his organ. After this step, a table on Microsoft Office Excel was elaborated with the primary data that were obtained (total records: 304 occurrences) from the Municipal Civil De- fense and it referred to the period of 2001-2008. In this table, there was a relation of the affected addresses by the inundations and flooding that was reported to this organ. In order to generate data on the Code of Dwelling (called “CL”) and Door Number (called “NP”) (CL + NP = CLNP) of each registered address, the application Cad- Log was used and it was developed at the Municipal In- stitute of Urbanism Pereira Passos (IPP-RJ/Brazil). The referred application aims at facilitating the processing and storage of information about public services and spaces of the city [22]. It was necessary to get the CLNP in order to after add this table to the program called Monta Métricas [23], enabling the automatic generation of X and Y coordi- 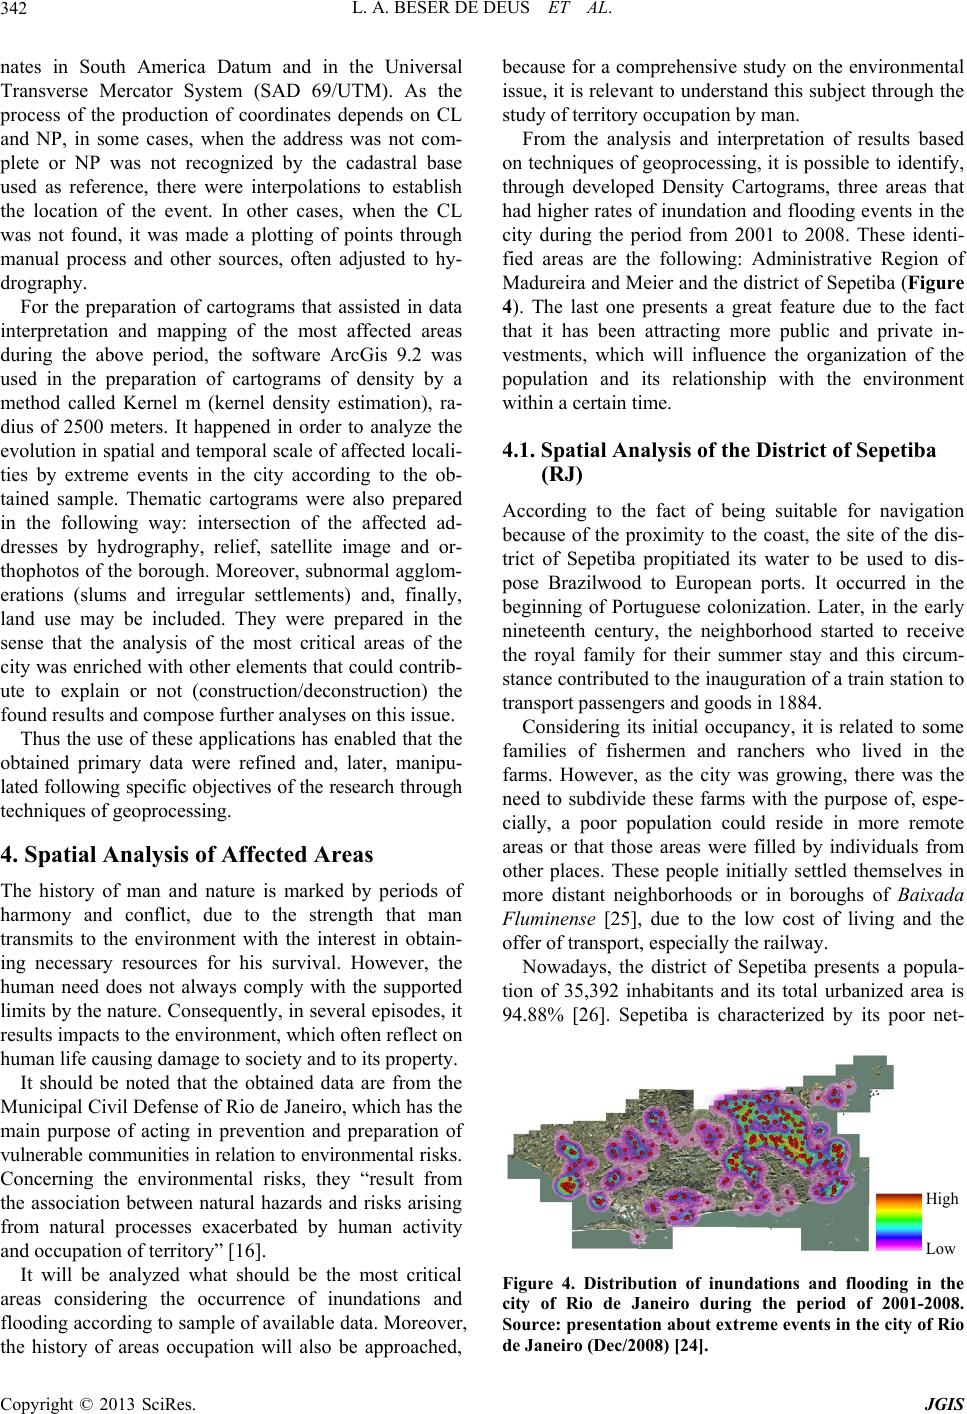 L. A. BESER DE DEUS ET AL. 342 nates in South America Datum and in the Universal Transverse Mercator System (SAD 69/UTM). As the process of the production of coordinates depends on CL and NP, in some cases, when the address was not com- plete or NP was not recognized by the cadastral base used as reference, there were interpolations to establish the location of the event. In other cases, when the CL was not found, it was made a plotting of points through manual process and other sources, often adjusted to hy- drography. For the preparation of cartograms that assisted in data interpretation and mapping of the most affected areas during the above period, the software ArcGis 9.2 was used in the preparation of cartograms of density by a method called Kernel m (kernel density estimation), ra- dius of 2500 meters. It happened in order to analyze the evolution in spatial and tempo ral scale of affected locali- ties by extreme events in the city according to the ob- tained sample. Thematic cartograms were also prepared in the following way: intersection of the affected ad- dresses by hydrography, relief, satellite image and or- thophotos of the bor ough. Moreover, subnormal agglom- erations (slums and irregular settlements) and, finally, land use may be included. They were prepared in the sense that the analysis of the most critical areas of the city was enriched with other elements that could con trib- ute to explain or not (construction/deconstruction) the found results and compose further analyses on this issue. Thus the use of these applications has enabled that the obtained primary data were refined and, later, manipu- lated following specific objectives of the research through techniques of geoprocessing. 4. Spatial Analysis of Affected Areas The history of man and nature is marked by periods of harmony and conflict, due to the strength that man transmits to the environment with the interest in obtain- ing necessary resources for his survival. However, the human need does not always comply with the supported limits by the nature. Conseq uently, in several episodes, it results impacts to the environment, which often reflect on human life causing damage to society and to its property. It should be noted that the obtained data are from the Municipal Civil Defense of Rio de Janeiro, which has the main purpose of acting in prevention and preparation of vulnerable communities in relation to environmental risk s. Concerning the environmental risks, they “result from the association between natural hazards and risks arising from natural processes exacerbated by human activity and occupation of terr itory” [16]. It will be analyzed what should be the most critical areas considering the occurrence of inundations and flooding according to sample of available data. Moreover, the history of areas occupation will also be approached, because for a comprehensive study on the environmental issue, it is relevant to understand this subject th rough the study of territory occupation by man. From the analysis and interpretation of results based on techniques of geoprocessing, it is possible to id entify, through developed Density Cartograms, three areas that had higher rates of inundation and flooding events in the city during the period from 2001 to 2008. These identi- fied areas are the following: Administrative Region of Madureira and Meier and the district of Sepetiba (Figure 4). The last one presents a great feature due to the fact that it has been attracting more public and private in- vestments, which will influence the organization of the population and its relationship with the environment within a certain time. 4.1. Spatial Analysis of the District of Sepetiba (RJ) According to the fact of being suitable for navigation because of the proximity to the coast, the site of the dis- trict of Sepetiba propitiated its water to be used to dis- pose Brazilwood to European ports. It occurred in the beginning of Portuguese colonization. Later, in the early nineteenth century, the neighborhood started to receive the royal family for their summer stay and this circum- stance contributed to the inauguration of a train station to transport passengers and goods in 1884. Considering its initial occupancy, it is related to some families of fishermen and ranchers who lived in the farms. However, as the city was growing, there was the need to subdivide these farms with the purpose of, espe- cially, a poor population could reside in more remote areas or that those areas were filled by individuals from other places. These people initially settled themselves in more distant neighborhoods or in boroughs of Baixada Fluminense [25], due to the low cost of living and the offer of transport, especially the railway. Nowadays, the district of Sepetiba presents a popula- tion of 35,392 inhabitants and its total urbanized area is 94.88% [26]. Sepetiba is characterized by its poor net- High Low Figure 4. Distribution of inundations and flooding in the city of Rio de Janeiro during the period of 2001-2008. Source: presentation about extreme events in the city of Rio de Janeiro (Dec/2008) [24]. Copyright © 2013 SciRes. JGIS 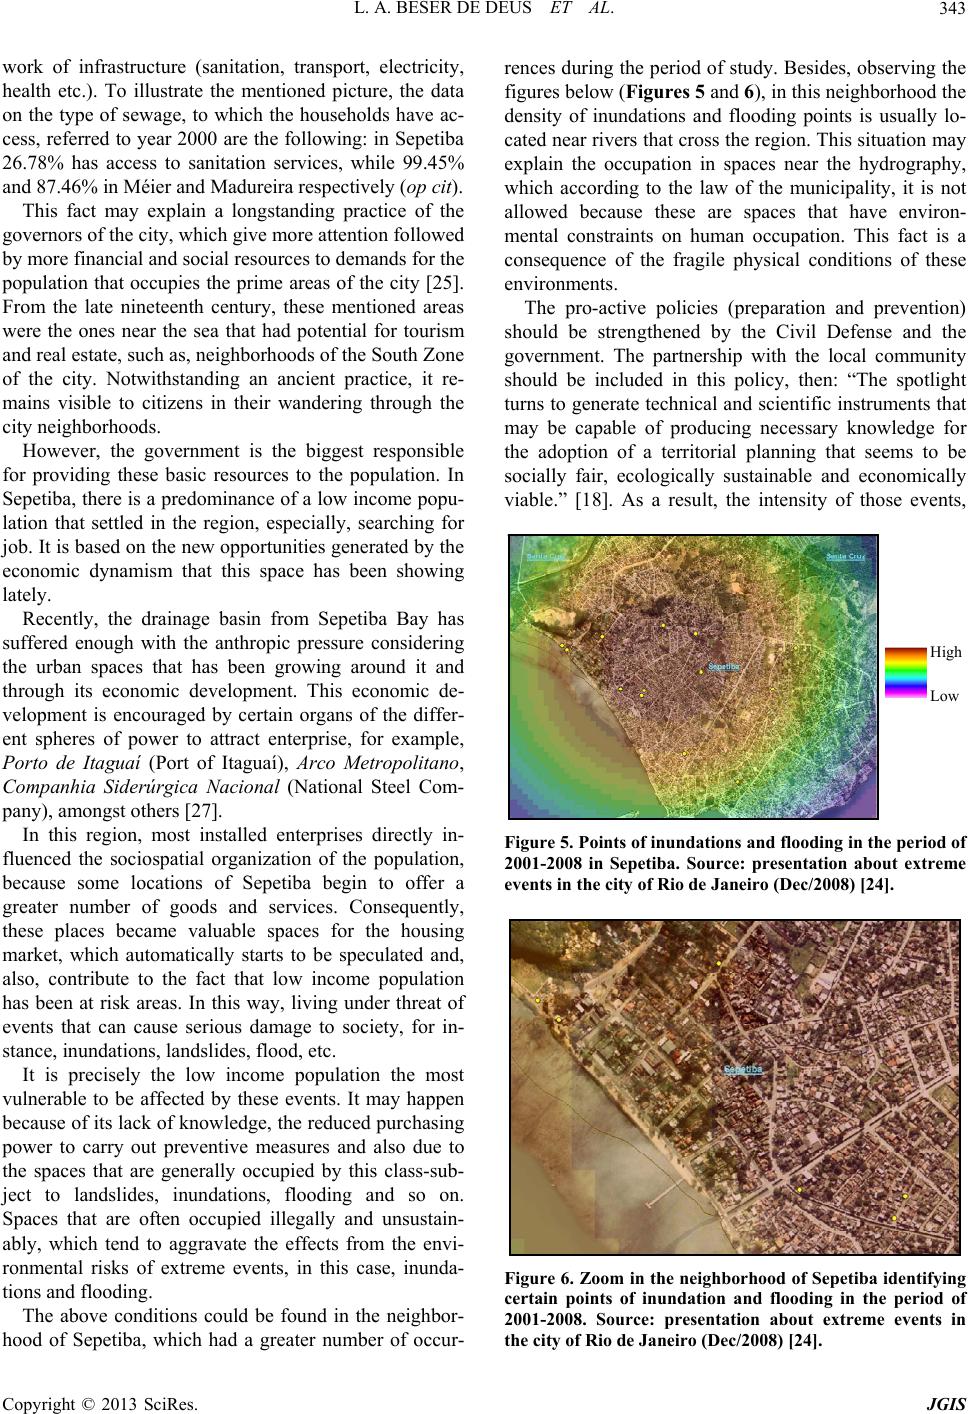 L. A. BESER DE DEUS ET AL. 343 work of infrastructure (sanitation, transport, electricity, health etc.). To illustrate the mentioned picture, the data on the type of sewage, to which the households have ac- cess, referred to year 2000 are the following: in Sepetiba 26.78% has access to sanitation services, while 99.45% and 87.46% in Méier and Madureira respectively (op cit). This fact may explain a longstanding practice of the governors of the city, which give more attention followed by more financial and social resources to demands for the population that occupies the prime areas of the city [25]. From the late nineteenth century, these mentioned areas were the ones near the sea that had potential for tourism and real estate, such as, neighborhoods of the Sou th Zon e of the city. Notwithstanding an ancient practice, it re- mains visible to citizens in their wandering through the city neighborhoods. However, the government is the biggest responsible for providing these basic resources to the population. In Sepetiba, there is a predo minance of a low income popu- lation that settled in the region, especially, searching for job. It is based on the new opportunities g enerated by the economic dynamism that this space has been showing lately. Recently, the drainage basin from Sepetiba Bay has suffered enough with the anthropic pressure considering the urban spaces that has been growing around it and through its economic development. This economic de- velopment is encouraged by certain organs of the differ- ent spheres of power to attract enterprise, for example, Porto de Itaguaí (Port of Itaguaí), Arco Metropolitano, Companhia Siderúrgica Nacional (National Steel Com- pany), amongst others [27]. In this region, most installed enterprises directly in- fluenced the sociospatial organization of the population, because some locations of Sepetiba begin to offer a greater number of goods and services. Consequently, these places became valuable spaces for the housing market, which automatically starts to be speculated and, also, contribute to the fact that low income population has been at risk areas. In this way, living under threat of events that can cause serious damage to society, for in- stance, inundations, landslides, flood, etc. It is precisely the low income population the most vulnerable to be affected by these events. It may happen because of its lack of knowledge, the reduced purchasing power to carry out preventive measures and also due to the spaces that are generally occupied by this class-sub- ject to landslides, inundations, flooding and so on. Spaces that are often occupied illegally and unsustain- ably, which tend to aggravate the effects from the envi- ronmental risks of extreme events, in this case, inunda- tions and flooding. The above conditions could be found in the neighbor- hood of Sepetiba, which had a greater number of occur- rences during the period of study. Besides, observing the figures below (Figures 5 and 6), in this neighborhood the density of inundations and flooding points is usually lo- cated near rivers that cross the region. This situatio n may explain the occupation in spaces near the hydrography, which according to the law of the municipality, it is not allowed because these are spaces that have environ- mental constraints on human occupation. This fact is a consequence of the fragile physical conditions of these environments. The pro-active policies (preparation and prevention) should be strengthened by the Civil Defense and the government. The partnership with the local community should be included in this policy, then: “The spotlight turns to generate technical and scien tific instruments that may be capable of producing necessary knowledge for the adoption of a territorial planning that seems to be socially fair, ecologically sustainable and economically viable.” [18]. As a result, the intensity of those events, High Low Figure 5. Points of inundations and flooding in the period of 2001-2008 in Sepetiba. Source: presentation about extreme events in the city of Rio de Janeiro (Dec/2008) [24]. Figure 6. Zoom in the neighborhood of Sepetiba ide ntifying certain points of inundation and flooding in the period of 2001-2008. Source: presentation about extreme events in the city of Rio de Janeiro (Dec/2008) [24]. Copyright © 2013 SciRes. JGIS 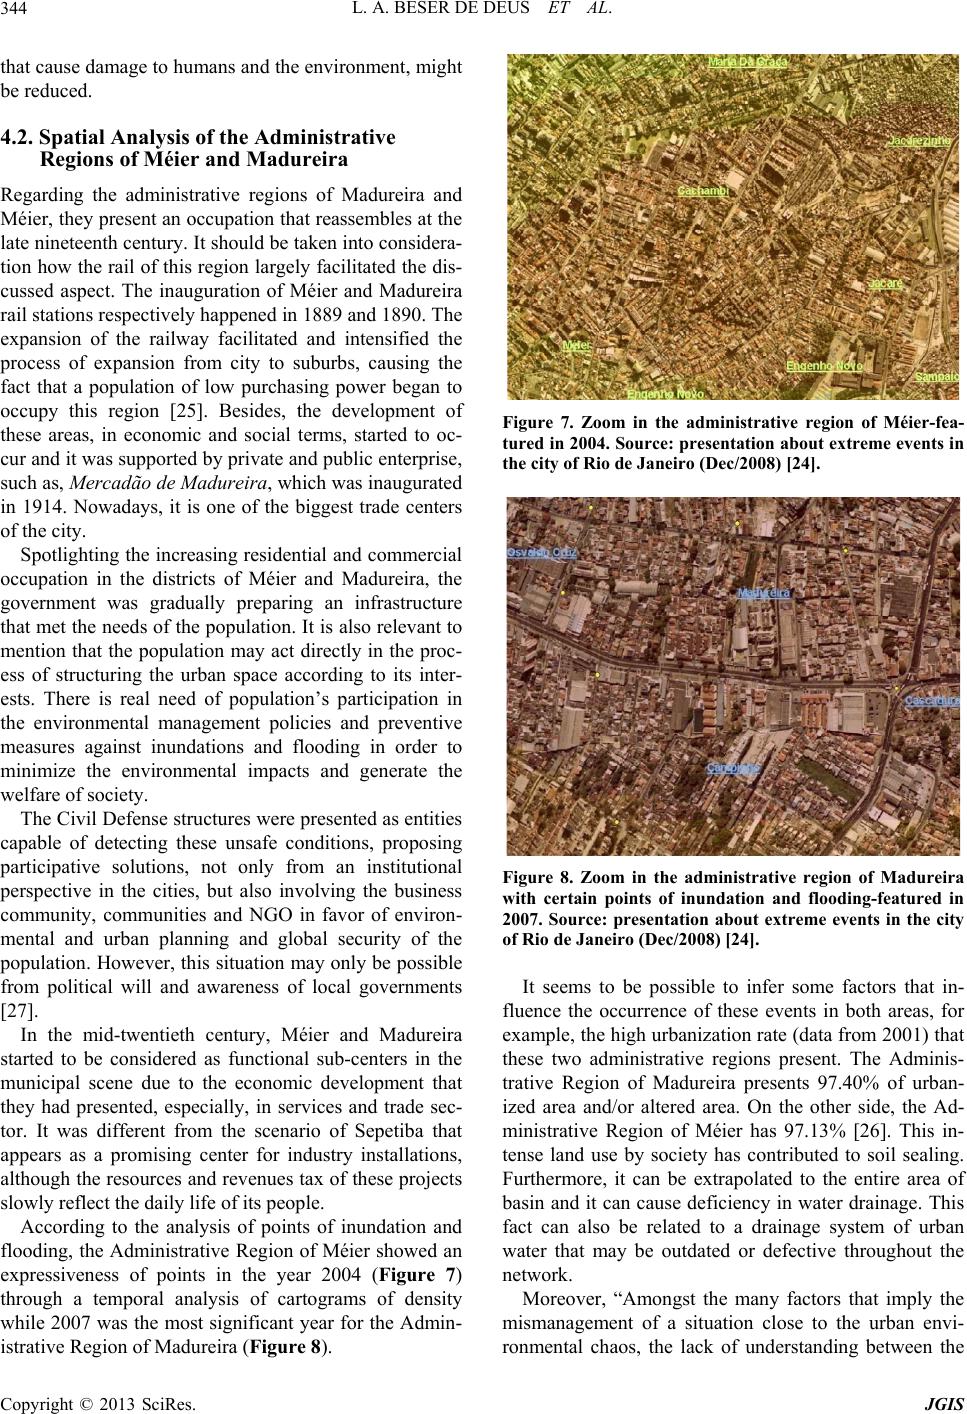 L. A. BESER DE DEUS ET AL. 344 that cause damage to humans and the environment, might be reduce d . 4.2. Spatial Analysis of the Administrative Regions of Méier and Madureira Regarding the administrative regions of Madureira and Méier, they present an occupation that reassembles at the late nineteenth century. It should be taken into con sidera- tion how the rail of this region largely facilitated the d is- cussed aspect. The inauguration of Méier and Madureira rail stations respectively happened in 1889 and 1890. The expansion of the railway facilitated and intensified the process of expansion from city to suburbs, causing the fact that a population of low purchasing power began to occupy this region [25]. Besides, the development of these areas, in economic and social terms, started to oc- cur and it w as suppo rted b y private and public enterprise, such as, Mercadão de Madureira, which was inau gurated in 1914. Nowadays, it is one of the biggest trade centers of the city. Spotlighting the increasing residen tial and commercial occupation in the districts of Méier and Madureira, the government was gradually preparing an infrastructure that met the needs of the population. It is also relevant to mention that the population may act directly in the proc- ess of structuring the urban space according to its inter- ests. There is real need of population’s participation in the environmental management policies and preventive measures against inundations and flooding in order to minimize the environmental impacts and generate the welfare of society. The Civil Defense structures were presented as entities capable of detecting these unsafe conditions, proposing participative solutions, not only from an institutional perspective in the cities, but also involving the business community, communities and NGO in favor of environ- mental and urban planning and global security of the population. However, this situation may only be possible from political will and awareness of local governments [27]. In the mid-twentieth century, Méier and Madureira started to be considered as functional sub-centers in the municipal scene due to the economic development that they had presented, especially, in services and trade sec- tor. It was different from the scenario of Sepetiba that appears as a promising center for industry installations, although the resources and rev enues tax of these projects slowly reflect the daily life of its people. According to the analysis of points of inundation and flooding, the Administrative Region of Méier showed an expressiveness of points in the year 2004 (Figure 7) through a temporal analysis of cartograms of density while 2007 was the most significant year for the Admin- istrative Region of Madureira (Figure 8). Figure 7. Zoom in the administrative region of Méier-fea- tured in 2004. Source: presentation about extreme events in the city of Rio de Janeiro (Dec/2008) [24]. Figure 8. Zoom in the administrative region of Madureira with certain points of inundation and flooding-featured in 2007. Source: presentation about extreme events in the city of Rio de Janeiro (Dec/2008) [24]. It seems to be possible to infer some factors that in- fluence the occurrence of these events in both areas, for example, the high urbanization rate (data from 2001) that these two administrative regions present. The Adminis- trative Region of Madureira presents 97.40% of urban- ized area and/or altered area. On the other side, the Ad- ministrative Region of Méier has 97.13% [26]. This in- tense land use by society has contributed to soil sealing. Furthermore, it can be extrapolated to the entire area of basin and it can cause deficiency in water drainage. This fact can also be related to a drainage system of urban water that may be outdated or defective throughout the network. Moreover, “Amongst the many factors that imply the mismanagement of a situation close to the urban envi- ronmental chaos, the lack of understanding between the Copyright © 2013 SciRes. JGIS  L. A. BESER DE DEUS ET AL. 345 involved actors and the institutional disorganization in the municipalities is prominent” [27]. In order to consist of an effective action, it becomes essential to know the mechanisms of conformation of reality and to have a multidisciplinary focus on its con- solidation. The effectiveness of environmental manage- ment, which is ultimately comprehended as a grounded practice in reality, requires an understanding of the dy- namic of processes that structurally configures this real- ity. The environmental management presupposes the dif- ferentiation of strategies and interests of modeling agents of geographical space. Therefore, the environmental ma- nagement may be a political process [10]. Lastly, it will be used a passage that summarizes wh at has been approached about this issue in relation to the highlighted areas in this study. Furthermore, how the politics of environmental management and land occupa- tion in the municipality of Rio de Janeiro are directly related to the results of spatial analysis. The historical process of occupation of metropolitan urban space in Rio de Janeiro created serious problems that were spatially differentiated. As a result, there is currently a critical environmental framework in which issues related to high demographic density, slums, sani- tation, movement of vehicles, pollution, floods and in- undations occupy a position of prominence and originate emergency solutions. These problems overlap in certain areas of the city, resulting in high risks for the population that resides in them. The most significant examples of critical environmental p roblems, which are consequences of spatial segreg ation in the metrop olis of Rio de Jan eiro, are found in marginal areas occupied by low-income population. And in these areas, the almost complete lack of basic infrastructure results in high degree of environ- mental vulnerability [18]. 5. Conclusions This work aimed to develop a preliminary analysis of inundation s and flooding occurrences in the municipality of Rio de Janeiro during the period of 2001-2008. To realize it, techniques of geoprocessing were used to en- rich the process in order to, in the future, be possible to suggest the monitoring of the most affected areas, which were identified in this wo rk, to the competent organs. It should be noted that the occurrences of inundations and flooding refer only to those registered by the Mu- nicipal Civil Defense from 2001 to 2008. Then, the re- sults refer to the presented scenario. Therefore, other possible critical areas can also be identified from another sample set using a different method of collection and, perhaps, a wider range of time frame. Thus, there is em- phasis on absence and lack of systematization of data and information about the theme that represented the greatest obstacles to a more detailed spatial analysis with respect to extreme hydrological events. It may be also high- lighted that it is essential to integrate the geotechnologies with such studies to support, in a more effective way, planning guidance and urban sustainable management in areas that are already occupied or in expansion. In conclusions of a report about environmental vul- nerability that was based on the context of the State of Rio de Janeiro, FREITAS et al. [28] mentions that, in general way, it can be said that the consequences of ex- treme hydrological events are directly related to envi- ronmental impacts caused by the use and occupation of urban land. Furthermore, the most vulnerable places are those that have deficit of infrastructure, mainly when they are associated with poor management of water re- sources. Accomplishing the distribution of space of risk and the development of the systems of supply and sewer, the act of planning the areas of occupation in the cities according to the plans for drainage basins management would have much lower costs and losses at a time of ex- treme climate events. In fact, preventive measures of adaptation against these risks may actually provide a significant reduction of economic, environmental, mate- rial and human damage. Finally, it may be mentioned that the National Policy of Civil Defense recommends that there is an important interaction amongst the following topics: sustainable development, disaster reduction, environmental protec- tion and social welfare. It is imperative that the planning process of national development considers the prevention of disasters in a clear and permanent manner. In the scope of the discussed issues, as a suggestion for future work, it is possible to spotlight that data about weather stations is being analyzed in the municipality of Rio de Janeiro in order to enrich, enhance and validate the obtained results in this research. Another important item to be highlighted concerns the degrees of uncer- tainty and validation of the areas identified as a stage to be implemented in future activities of this study. REFERENCES [1] EM-DAT—Emergency Events Database, “The OFDA/ CRED International Disaster Database,” 2007. http://www.em-dat.net/ [2] E. V. Marcelino, “Desastres Naturais e Geotecnologias: Conceitos Básicos,” Caderno Didático, No. 1, INPE/CRS, Santa Maria, 2008. [3] S. Nadarajah and J. T. Shiau, “Analysis of Extreme Flood Events for the Pachang River, Taiwan,” Water Resources Management, Vol. 19, No. 4, 2005, pp. 363-374. doi:10.1007/s11269-005-2073-2 [4] S. Mosquera-Machado and S. Ahmad, “Flood Hazard As- sessment of Atrato River in Colombia,” Water Resources Management, Vol. 21, No. 3, 2007, pp. 591-609. doi:10.1007/s11269-006-9032-4 Copyright © 2013 SciRes. JGIS  L. A. BESER DE DEUS ET AL. Copyright © 2013 SciRes. JGIS 346 [5] L. T. Guimarães and A. Magrini, “A Proposal of Indica- tors for Sustainable Development in the Management of River Basins,” Water Resources Management, Vol. 22, No. 9, 2008, pp. 1191-1202. doi:10.1007/s11269-007-9220-x [6] Z. W. Kundzewicz, Y. Hirabayashi and S. Kanae, “River Floods in the Changing Climate—Observations and Pro- jections,” Water Resources Management, Vol. 24, No. 11, 2010, pp. 2633-2646. doi:10.1007/s11269-009-9571-6 [7] Z. Hussain, “Application of the Regional Flood Frequen- cy Analysis to the Upper and Lower Basins of the Indus River, Pakistan,” Water Resources Management, Vol. 25, No. 11, 2011, pp. 2797-2822. doi:10.1007/s11269-011-9839-5 [8] J. F. Santos, M. M. Portela and I. Pulido-Calvo, “Regi onal Frequency Analysis of Droughts in Portugal,” Water Re- sources Management, Vol. 25, No. 14, 2011, pp. 3537- 3558. doi:10.1007/s11269-011-9869-z [9] P. C. Tiwari and B. Joshi, “Environmental Changes and Sustainable Development of Water Resources in the Hi- malayan Headwaters of India,” Water Resources Mana- gement, Vol. 26, No. 4, 2011, pp. 883-907. doi:10.1007/s11269-011-9825-y [10] G. A. Pires Do Rio and M. C. C. Galvão, “Gestão Am- biental: Apontamentos para uma Reflexão,” Anuário do Instituto de Geociências, Vol. 19, 1996. [11] C. E. M. Tucci, “Controle de Enchentes,” Hidrologia Ci- ência e Aplicação, 3rd Edition, Abrh-Editora Ufrgs, Porto Alegre, 2002, pp. 621-658. [12] A. L. Coelho Netto, “Hidrologia de Encosta na Interface com a Geomorfologia,” In: A. J. T. Guerra and S. B. Cun- ha, Eds., Geomorfologia: Uma Atualização de Bases e Conceitos, Bertrand Brasil, Rio de Janeiro, 1994, pp. 93- 148. [13] SEMADS—Secretaria de Estado de Meio Ambiente e Desenvolvimento Sustentável, Enchentes no Estado do Rio de Janeiro—Uma abordagem geral, Rio de Janeiro, 2001, 160 p. [14] MMA—Ministério do Meio Ambiente, Capítulo 2—En- chente e Inundação, Vulnerabilidade Ambiental—Desa- stres Naturais ou Fenômenos Induzidos? Brasília, 2007, 192 p. [15] IBAMA—Instituto Brasileiro do Meio Ambiente e dos Recursos Naturais Renováveis, O Estado do Meio Am- biente no Brasil, Geobrasil—Perspectivas do Meio Am- biente no Brasil, Edições Ibama, Brasília, 2002. [16] Y. Veyret, “Os Riscos: o Homem Como Agressor e Ví- tima do Meio Ambiente,” Contexto, São Paulo, 2007. [17] C. A. F. Monteiro, “Clima e Excepcionalismo,” Conjec- turas Sobre o Desempenho da Atmosfera Como Fenô- meno Geogr áfico. Editora da UFSC, Florianópolis, 1991, 233 p. [18] A. M. P. M. Brandão, “Clima Urbano e Enchentes no Rio de Janeiro,” In; A. J. T. Guerra and S. B. Cunha, Eds., Impactos Ambientais e Urbanos No Brasil, Bertrand Brasil, Rio de Janeiro, 2001, pp. 47-109. [19] M. Belassiano, S. M. Lima, M. C. D. Ba rbosa, B. P. Mar- ques and M. G. Justi, “Sistema de Alerta de Chuvas In- tensas na Cidade Do Rio De Janeiro: Eventos do Verão 1999/2000,” Sistema Alerta-Rio/GEORIO e UFRJ/Depar- tamento de Meteorologia, Rio de Janeiro, 2000. [20] J. B. O. Conti, “Meio Ambiente Tropical,” Geografia, Rio Claro, Vol. 14, No. 28, pp. 69-79. [21] IVIG, “Projeto de Desenvolvimento de Técnicas e Tec- nologias de Informação e de Uso Eficiente dos Recursos Hídricos para Adaptação do Estado do Rio de Janeiro aos Riscos das Mudanças Climáticas Globais—Projeto AQU- ACLIMA_RJ,” Instituto Virtual Internacional de Mudan- ças Globais—IVIG/Fundação COP PETEC/UFRJ/FAPERJ —Secretaria de Estado de Ciência e Tecnologia, 2008. [22] R. I. O. Portalgeo, 2009. http://portalgeo.rio.rj.gov.br [23] IPP—Instituto de Urbanismo Municipal Pereira Passos, “Monta Métricas,” Gerência de Geoprocessamento Dire- toria de Informações Geográficas, 2008. [24] Apresentação Sobre Eventos Extremos na Cidade do Rio de Janeiro, IPP—Instituto de Urbanismo Municipal Perei- ra Passos/IVIG—Instituto Virtual Internacional de Mu- danças Globais, Dez/2008. [25] M. A. Abreu, “Evolução Urbana do Rio de Janeiro,” Ins- tituto Pereira Passos, Rio de Janeiro, 2006. [26] Armazem de Dados, 2009. http://www.armazemdedados.rio.rj.gov.br/ [27] W. D. Araujo, “A Defesa Civil Co mo Instrumento da G es- tão Ambiental Urbana. Um Enfoque na Região da Bacia Hidrográfica da Baía de Sepetiba sob os Efeitos da Ins- talação de Novos Empreendimentos,” COPPE/UFRJ, Es- pecialização em Gestão de Bacias Hidrográficas, 2007. [28] M. Freitas, et al. “Estudo de Adaptação e Vulnerabilidade dos Recursos Hídricos do Estado do Rio de Janeiro às Mudanças Climáticas,” Instituto Virtual Internacional de Mudanças Globais—IVIG, 2008.
|