 American Journal of Industrial and Business Management, 2013, 3, 395-417 http://dx.doi.org/10.4236/ajibm.2013.34047 Published Online August 2013 (http://www.scirp.org/journal/ajibm) Copyright © 2013 SciRes. AJIBM 395 An Experimental Analysis of Over-Confidence Saoussen Jemaiel1, Chokri Mamoghli2, Mohamed Walid Seddiki3 1The Higher Institute of Management, DEFI Unit, Tunis, Tunisia; 2The Institute of High Commercial Studies, DEFI Unit, Tunis, Tunisia; 3The Faculty of Legal Sciences, Economic and Management of Jendouba, DEFI Unit, Tunis, Tunisia. Email: saoussen_jemaiel@yahoo.fr Received November 27th, 2012; revised January 12th, 2013; accepted February 12th, 2013 Copyright © 2013 Saoussen Jemaiel et al. This is an open access article distributed under the Creative Commons Attribution License, which permits unrestricted use, distribution, and reproduction in any medium, provided the original work is properly cited. ABSTRACT The purpose of this paper is to experimentally demonstrate the existence of the bias of over-confidence as a human psychological bias. This bias was measured by three methods: the estimation interval, the frequency estimation method and the method of question with two answer choices. The estimation interval method finds a very wide bias compared to the other two methods, but overconfidence persists in the other two methods at lower levels. In the first experiment, monetary incentives have exacerbated the over-confidence because of the given compensation. This system has demon- strated that there is a strong link between over-confidence and risk taking. The second experiment that used the method of question with two answer choices was given a different pay system and it was expected that overconfidence will be reduced by monetary incentives but the results show that the bias is not significantly reduced by these new monetary incentives. Similarly, the iteration that was made during the first experiment did not significantly reduce the bias. Keywords: Over-Confidence; Uncertainty; Monetary Incentives; Experiments 1. Introduction The behavior of financial markets is at the heart of be- havioral finance. The experiments of psychologists con- tinue to show that the investor is far from being placid and intellectually powerful relied on by financial and classical economic theory. Indeed, several scholar be- haviors were identified by the followers of the behavioral paradigm: among others, the behavior of loss aversion, the behavior of over-confidence, availability behavior, representation behavior, mimetic or follower behavior, the behavior of mental accounting and the behavior of mental anchor. However, there are other behaviors that are cited by proponents of this paradigm, but their impor- tance is minimal. The term over-confidence, for example, has been used to describe two distinct phenomena. The first is the ten- dency of individuals to express an excessive belief in their own abilities: for example the ability to drive peacefully [1]. The second phenomenon is the tendency of individuals to overestimate the precision of their knowledge [2]. If the over-confidence is a characteristic of invasive behavior, it will have profound implications for financial markets. Recently, quite a number of theoretical models of financial markets have incorporated on-confident judgments [3-5]. Recently, several models of behavioral finance based on overconfidence hypothesis have been proposed to explain abnormal results of return, such as momentum effect and reversal effect. This explanation represents a challenge for financial economists. We characterize the overconfidence hypothesis by four implications; firstly, if the investors are overconfident they over react to private information and under react to public information. Sec- ondly, the profit of market causes the excessive trading volume by overconfident investors. Thirdly, the exces- sive trading volume of overconfident investors contrib- utes at the excessive volatility. Fourthly, overconfident investors under estimate risk and exchange more in risk- ier securities. These hypotheses are empirically evaluated by using econometric models in order to proof the exis- tence of overconfidence in financial market. Daniel et al. [6] demonstrate that if investors are overconfident, they over react to private information and under react to public information. By consequence this asymmetric response of overconfident investors induces the short term momentum effect and the long term re- versal effect of return. Besides the overconfidence bias causes financial fraud in financial market. 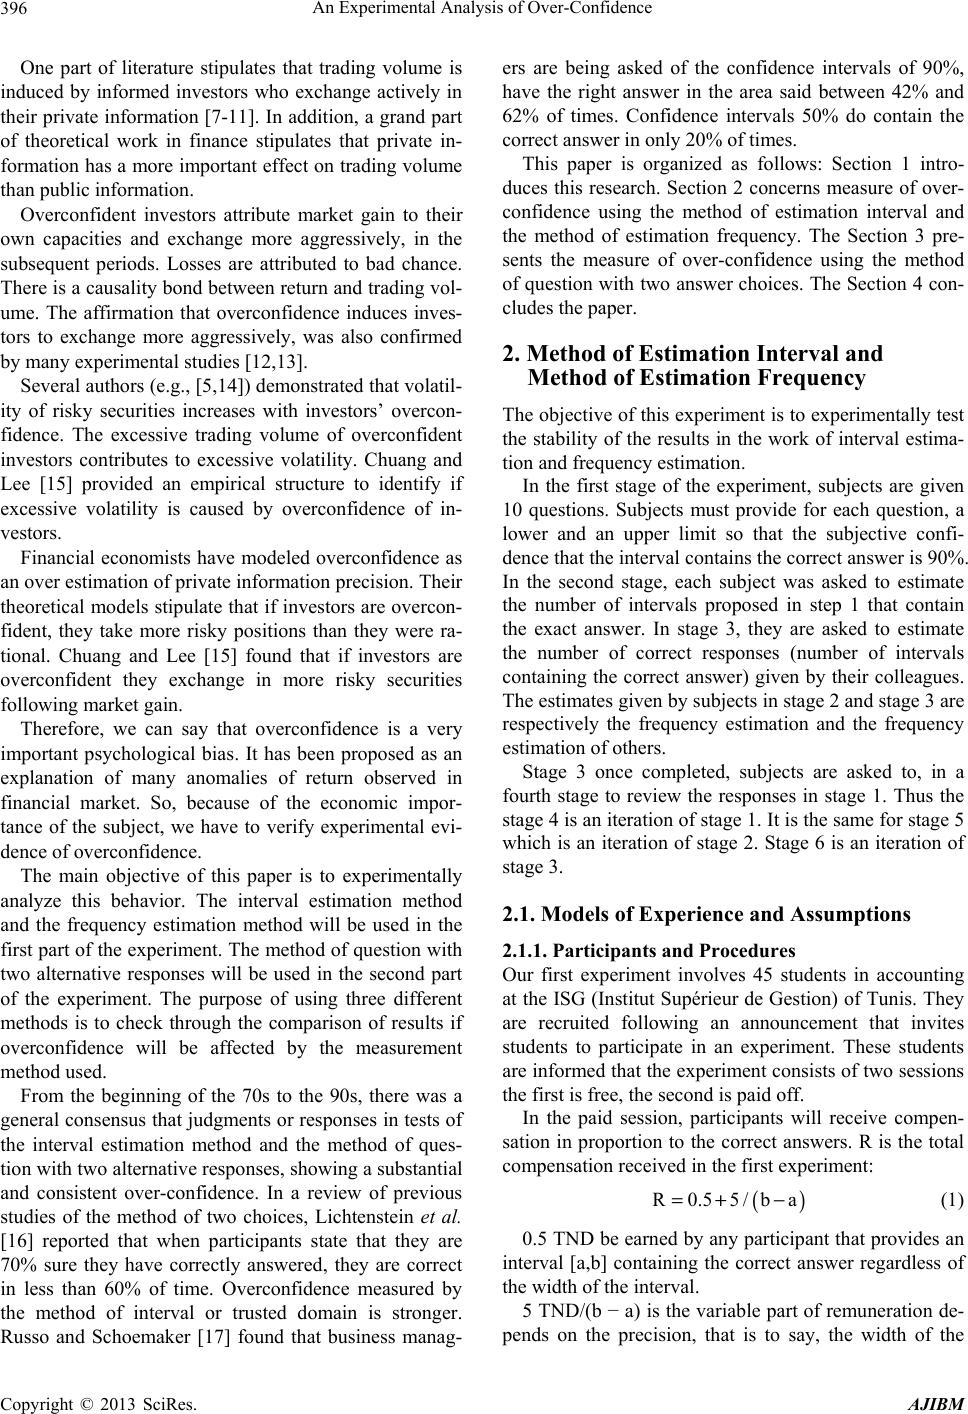 An Experimental Analysis of Over-Confidence Copyright © 2013 SciRes. AJIBM 396 One part of literature stipulates that trading volume is induced by informed investors who exchange actively in their private information [7-11]. In addition, a grand part of theoretical work in finance stipulates that private in- formation has a more important effect on trading volume than public information. Overconfident investors attribute market gain to their own capacities and exchange more aggressively, in the subsequent periods. Losses are attributed to bad chance. There is a causality bond between return and trading vol- ume. The affirmation that overconfidence induces inves- tors to exchange more aggressively, was also confirmed by many experimental studies [12,13]. Several authors (e.g., [5,14]) demonstrated that volatil- ity of risky securities increases with investors’ overcon- fidence. The excessive trading volume of overconfident investors contributes to excessive volatility. Chuang and Lee [15] provided an empirical structure to identify if excessive volatility is caused by overconfidence of in- vestors. Financial economists have modeled overconfidence as an over estimation of private information precision. Their theoretical models stipulate that if investors are overcon- fident, they take more risky positions than they were ra- tional. Chuang and Lee [15] found that if investors are overconfident they exchange in more risky securities following market gain. Therefore, we can say that overconfidence is a very important psychological bias. It has been proposed as an explanation of many anomalies of return observed in financial market. So, because of the economic impor- tance of the subject, we have to verify experimental evi- dence of overconfidence. The main objective of this paper is to experimentally analyze this behavior. The interval estimation method and the frequency estimation method will be used in the first part of the experiment. The method of question with two alternative responses will be used in the second part of the experiment. The purpose of using three different methods is to check through the comparison of results if overconfidence will be affected by the measurement method used. From the beginning of the 70s to the 90s, there was a general consensus that judgments or responses in tests of the interval estimation method and the method of ques- tion with two alternative responses, showing a substantial and consistent over-confidence. In a review of previous studies of the method of two choices, Lichtenstein et al. [16] reported that when participants state that they are 70% sure they have correctly answered, they are correct in less than 60% of time. Overconfidence measured by the method of interval or trusted domain is stronger. Russo and Schoemaker [17] found that business manag- ers are being asked of the confidence intervals of 90%, have the right answer in the area said between 42% and 62% of times. Confidence intervals 50% do contain the correct answer in only 20% of times. This paper is organized as follows: Section 1 intro- duces this research. Section 2 concerns measure of over- confidence using the method of estimation interval and the method of estimation frequency. The Section 3 pre- sents the measure of over-confidence using the method of question with two answer choices. The Section 4 con- cludes the paper. 2. Method of Estimation Interval and Method of Estimation Frequency The objective of this experiment is to experimentally test the stability of the results in the work of interval estima- tion and frequency estimation. In the first stage of the experiment, subjects are given 10 questions. Subjects must provide for each question, a lower and an upper limit so that the subjective confi- dence that the interval contains the correct answer is 90%. In the second stage, each subject was asked to estimate the number of intervals proposed in step 1 that contain the exact answer. In stage 3, they are asked to estimate the number of correct responses (number of intervals containing the correct answer) given by their colleagues. The estimates given by subjects in stage 2 and stage 3 are respectively the frequency estimation and the frequency estimation of others. Stage 3 once completed, subjects are asked to, in a fourth stage to review the responses in stage 1. Thus the stage 4 is an iteration of stage 1. It is the same for stage 5 which is an iteration of stage 2. Stage 6 is an iteration of stage 3. 2.1. Models of Experience and Assumptions 2.1.1. Participants and Procedures Our first experiment involves 45 students in accounting at the ISG (Institut Supérieur de Gestion) of Tunis. They are recruited following an announcement that invites students to participate in an experiment. These students are informed that the experiment consists of two sessions the first is free, the second is paid off. In the paid session, participants will receive compen- sation in proportion to the correct answers. R is the total compensation received in the first experiment: () R0.55/ba=+ − (1) 0.5 TND be earned by any participant that provides an interval [a,b] containing the correct answer regardless of the width of the interval. 5 TND/(b − a) is the variable part of remuneration de- pends on the precision, that is to say, the width of the  An Experimental Analysis of Over-Confidence Copyright © 2013 SciRes. AJIBM 397 interval. A participant may gain accurate up to 5 dinars, the more the width increases the more variable pay de- creases. In the second and third step, a correct answer will be paid by 0.5 TND. Steps 4, 5 and 6 concern the iteration and are similar to steps 1, 2 and 3. The experiment involves six steps outlined below: Step 1 Participants are asked to answer ten general knowl- edge questions. It should be noted that these issues are not selected for the difficulty. Since the set is heteroge- neous, the level of difficulty varies from one subject to another, a question may be considered difficult for a subject and easy for another. Subjects must answer these questions by an interval, providing its lower limit and upper limit so that their subjective confidence that the interval contains the true value is 90%. This step is called the interval estimate. Step 2 After answering the ten questions in the first stage, participants are asked to estimate how many of their own answers have contained the true value, that is to say, to give a rating out of ten. This is called frequency estima- tion or self-validation. Step 3 We ask each participant to estimate the average num- ber of correct responses made by these colleagues (other participants). We mean by a correct response interval containing the true value regardless of accuracy. This is called frequency estimation of others. Steps 4, 5 and 6 They are similar to steps 1, 2 and 3. They concern it- eration in the sense of giving a second chance for those who want to make adjustments to their ranges in step 4 by changing the lower bound, upper bound or both. Par- ticipants who do not want to make adjustments may mention that by confirming their answers. If a participant has made some adjustment in step 4, then he/she should provide a second frequency to estimate their own answer in step 5, and estimate a second frequency of the other in step 6. As previously mentioned, this experiment has two ses- sions, the first is free, the second is paid off. Each session consists of six steps described above. The questions in both sessions are different but of the same type, that is to say that the sample is heterogeneous and is not selected for difficulty. The purpose of this change is to avoid the effect of learning that can bias the analysis. 2.1.2. Hypotheses and Tests Let θ1, θ2.... θ6 be the population mean in each of the six steps in the free session and β1, β2.... β6 denote the popu- lation mean in each of the six steps in the paid session. So θ1 [β1] refers to the average number that includes the true value in step 1 for the free session [pay]. θ2 [β2] refers to the estimated average frequency in Step 2 for the free session [pay]. θ3 [β3] refers to the estimated av- erage frequency of the other session for free [pay]. θ4 [β4] θ5 [β5] and θ6 [β6] are strictly analogous to θ1 [β1] θ2 [β2] and θ3 [β3] on the iteration in the free session and pay respectively. Assumptions can be organized around four central points: • The comparison of over-confidence as measured by the method of estimation interval and the method of estimation frequency; • Check if participants anticipate the over-confidence of others through the estimation of the frequency of others; • Capture the effect of iteration on the results; • Determine the impact of monetary incentives on the behavior of individuals by comparing the free session and the session fee. 1) Comparison of over-confidence as measured by the method of confidence interval and the method of frequency estimation In our experiment, we measure the over-confidence by two methods. The first one is the method of the confi- dence interval or interval estimation used in step 1 and 4. The second one is the method of estimating frequency used in step 2 and 5. Hypothesis 1: the range of over-confidence is greater than the frequency of over-confidence Free Session (θ2 − θ1) < (9 − θ1) before iteration (θ5 − θ4) < (9 − θ4) after iteration Paid session (β2 − β1) < (9 − β1) before iteration (β5 − β4) < (9 − β4) after iteration. In the first case, we will see if the over-confidence as measured by the method of estimation interval is higher than that measured by the method of estimation fre- quency in the free session and the session fee, before and after iteration. 2) Estimated frequency of other By examining the frequency estimation of others through step 3 and before step 6 iteration after iteration, it is expected that participants expect the over-confidence of others. Hypothesis 2: Participants anticipate the over-con- fidence of others θn < 9 for n = 3, 6 free session βn < 9 for n = 3, 6 paid session. 3) Iteration Participants can give an inconsistent answer, they are then asked to repeat the work of the estimate of the range they want. The iteration is not required, because a subject satisfied with his first answer may keep mentioning that.  An Experimental Analysis of Over-Confidence Copyright © 2013 SciRes. AJIBM 398 In step 4, we recall about his answer by showing the lower and upper bound of the interval he has chosen. He then four choices: Enter 0 for nothing fit Type 1 only has to adjust, that is to say, the lower bound. Type 2 to adjust only b, that is to say, the upper bound. Type 3 to adjust a and b, that is to say, the two termi- nals. In step 5, which is the iteration of step 2, the subject has the choice of adjustment or maintenance of their re- sponse. Recall that in step 3, each subject was asked to estimate the average number of correct answers that his colleagues have conducted on the ten questions. In step 6, the subject has two choices: Enter 0 for nothing fit Type 1 to adjust the d, the average number of correct answers of other participants estimated in step 3. But it should be noted that the iteration will have the effect of anchor the concept that an interval of 90% con- fidence that actually involves 9 questions can be an- swered correctly on average. There is an element of learning for two reasons. First, the instructions are read and the other participants are to a degree aware of their failure to comply with the instructions. Hypothesis 3: The iteration will reduce the range of over-confidence that is overconfidence as measured by the method of estimating the range will be reduced by iteration (9 − θ4) for the free session <(9 − θ1) (9 − β4) for the paid session <(9 − β1). 4) Monetary incentives Our experience consists of two sessions, one is free and the other is paid for. To prevent participants from giving too wide intervals in the paid session in order to earn more money, we set a compensation system in a step that takes into account both accuracy and precision. We recall the compensation system in step 1: R = 0.5 + 5/(b − a) 0.5 TND will be won by any participant who provides an interval [a, b] containing the correct answer regardless of the width of the interval. 5 TND/(b − a) is the variable part of remuneration de- pends on the precision, that is to say, the width of the interval to ensure the 0.5 TND, or they provide narrow intervals to minimize (b − a) and maximize their profits. This arbitration depends on the psychology of it is risk-averse and under-confident, it will expand the range. But his aversion to risk decreases and confidence in- creases, the width of the interval that will supply de- creases. Previous research [5,18,19] believe that monetary in- centives will align declaratory judgments and judgments true. One simple reason is that subjects spend more cog- nitive resources in the work where good performance is rewarded financially. The second reason for providing monetary incentives is that subjects may be reluctant to admit they have not followed the instructions in the work of estimating the range and thus exaggerates the esti- mated frequency to align with the estimate of the interval. This trend can be offset through monetary incentives as the self-validation is not without cost. Self-validation is manifested in steps 2 and 5 before and after iteration. Previous researches also state that the subjects may be more predisposed to recognize the over-confidence of non-confidence on their own. This is the effect “above average”. Since the estimated frequency of the other will be paid in the session fee, we will check whether the ef- fect “above average” will be reduced by monetary incen- tives. Our goal in this section is to study the impact of monetary incentives on responses. If the over-confidence dominates the population of participants, it is expected that the range of over-confidence in the session fee will be greater than that of the free session. The study will be made also by topic, to see the change in this way from one person to another. Hypothesis 4-a: The interval of over-confidence in the session fee is larger than that of the session (9 − β1) > (9 − θ1) before iteration and (9 − β4) > (9 − θ4) after iteration. Our second objective in this section is to study the impact of monetary incentives on the estimated fre- quency. Since self-validation is paid, participants will try not to exaggerate. Hypothesis 4-b: The monetary incentives will de- crease the over-confidence as measured by the method of frequency estimation (θ2 − θ1) > (β2 − β1) before iteration and (θ5 − θ4) > (β5 − β4) after iteration. Our third objective in this section is to study the im- pact of monetary incentives on estimating the frequency of others. Since this estimate is paid in steps 3 and 6. As we have already declared the subjects may be more pre- disposed to accept the over-confidence of other than their own over-confidence. Hypothesis 4-c: The monetary incentives will re- duce the effect “above average” (θ2 − θ3) > (β2 − β3) before iteration and (θ5 − θ6) > (β5 − β6) after iteration. 2.2. Results Figure 1 below shows the average results in the six stages of the experiment for the free session and the ses- sion fee. For the free session, the average number of cor- rect answers in the work of estimating the range in step 1 (before iteration) is θ1 = 4.555 and in step 4 (after itera- tion) θ4 = 4.644. As for the session, the average number of correct answers before iteration β1 goes up to 2.111, 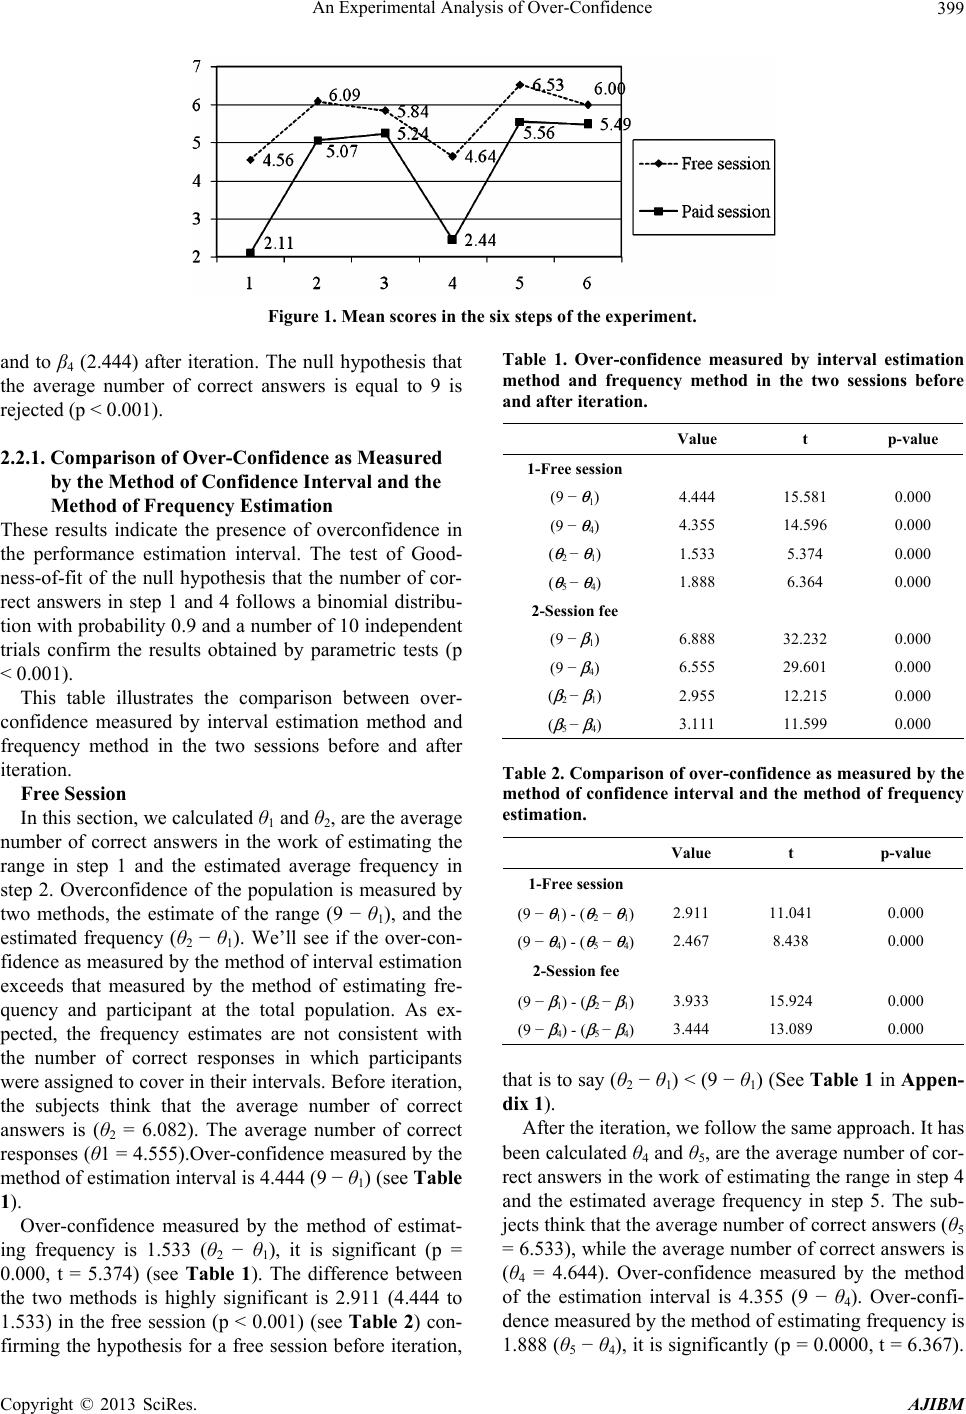 An Experimental Analysis of Over-Confidence Copyright © 2013 SciRes. AJIBM 399 Figure 1. Mean scores in the six steps of the experiment. and to β4 (2.444) after iteration. The null hypothesis that the average number of correct answers is equal to 9 is rejected (p < 0.001). 2.2.1. Comparison of Over-Confidence as Measured by the Method of Confidence Interval and the Method of Frequency Estimation These results indicate the presence of overconfidence in the performance estimation interval. The test of Good- ness-of-fit of the null hypothesis that the number of cor- rect answers in step 1 and 4 follows a binomial distribu- tion with probability 0.9 and a number of 10 independent trials confirm the results obtained by parametric tests (p < 0.001). This table illustrates the comparison between over- confidence measured by interval estimation method and frequency method in the two sessions before and after iteration. Free Session In this section, we calculated θ1 and θ2, are the average number of correct answers in the work of estimating the range in step 1 and the estimated average frequency in step 2. Overconfidence of the population is measured by two methods, the estimate of the range (9 − θ1), and the estimated frequency (θ2 − θ1). We’ll see if the over-con- fidence as measured by the method of interval estimation exceeds that measured by the method of estimating fre- quency and participant at the total population. As ex- pected, the frequency estimates are not consistent with the number of correct responses in which participants were assigned to cover in their intervals. Before iteration, the subjects think that the average number of correct answers is (θ2 = 6.082). The average number of correct responses (θ1 = 4.555).Over-confidence measured by the method of estimation interval is 4.444 (9 − θ1) (see Table 1). Over-confidence measured by the method of estimat- ing frequency is 1.533 (θ2 − θ1), it is significant (p = 0.000, t = 5.374) (see Table 1). The difference between the two methods is highly significant is 2.911 (4.444 to 1.533) in the free session (p < 0.001) (see Table 2) con- firming the hypothesis for a free session before iteration, Table 1. Over-confidence measured by interval estimation method and frequency method in the two sessions before and after iteration. Value t p-value 1-Free session (9 − θ 1) 4.444 15.581 0.000 (9 − θ 4) 4.355 14.596 0.000 ( θ 2 − θ 1) 1.533 5.374 0.000 ( θ 5 − θ 4) 1.888 6.364 0.000 2-Session fee (9 − β 1) 6.888 32.232 0.000 (9 − β 4) 6.555 29.601 0.000 ( β 2 − β 1) 2.955 12.215 0.000 ( β 5 − β 4) 3.111 11.599 0.000 Table 2. Comparison of over-confidence as measured by the method of confidence interval and the method of frequency estimation. Value t p-value 1-Free session (9 − θ 1) - ( θ 2 − θ 1)2.911 11.041 0.000 (9 − θ 4) - ( θ 5 − θ 4)2.467 8.438 0.000 2-Session fee (9 − β 1) - ( β 2 − β 1)3.933 15.924 0.000 (9 − β 4) - ( β 5 − β 4)3.444 13.089 0.000 that is to say (θ2 − θ1) < (9 − θ1) (See Table 1 in Appen- dix 1). After the iteration, we follow the same approach. It has been calculated θ4 and θ5, are the average number of cor- rect answers in the work of estimating the range in step 4 and the estimated average frequency in step 5. The sub- jects think that the average number of correct answers (θ5 = 6.533), while the average number of correct answers is (θ4 = 4.644). Over-confidence measured by the method of the estimation interval is 4.355 (9 − θ4). Over-confi- dence measured by the method of estimating frequency is 1.888 (θ5 − θ4), it is significantly (p = 0.0000, t = 6.367).  An Experimental Analysis of Over-Confidence Copyright © 2013 SciRes. AJIBM 400 The difference between the two methods is highly sig- nificant is 2.467 in the free session (p < 0.001) (see Ta- ble 2) confirming the hypothesis for a free session after iteration (θ5 − θ4) < (9 − θ4) (See Table 2 in Appendix 1). Session fee We will repeat the same work to verify if the results obtained for the free session are confirmed for the ses- sion fee. It has been calculated β1 and β2 which represent the average number of correct answers in step 1 and the estimated average frequency in step 2 (See Table 3 in Appendix 1). Frequency estimates are not consistent with the num- ber of correct responses in which participants were as- signed to cover in their intervals. The subjects think that the average number of correct answers β2 is 5.066. The average number of correct answers β1 amounts to 2.111. Over-confidence measured by the method of the estima- tion interval is 6.888 (9 − β1). On the confidence meas- ured by the method of estimating frequency is 2.955 (β2 − β1), it is significant is 3.933 (p < 0.001) confirming the hypothesis for a session fee prior iteration (β2 − β1) < (9 − β1) (See Table 3 in Appendix 1). After iteration, we calculated that β5 and β4 represent the average number of correct answers in step 4 and the estimated mean frequency in step 5 (See Table 4 in Ap- pendix 1). Frequency estimates are not consistent with the num- ber of correct responses in which participants were as- signed to cover in their intervals. Participants felt that the average number of correct answers β5 is 5.555. The av- erage number of correct answers β4 equals 2.444. On the confidence measured by the method of interval estima- tion (9 − β4) is 6.555. Over-confidence measured by the method of estimating frequency (β5 − β4), amounts on average to 3.111 and is significant (p = 0.0000, t = 11.599). The mean difference between the two methods, which is equal to 3.444, is highly significant either (p < 0.001) confirming the hypothesis after iteration 1. 2.2.2. Frequency Estimates of Others In the free session, the estimated average frequency of others (θ3 = 5.844) and (θ6 = 6) respectively before and after iteration. In the session fee, the estimated average frequency of others before β3 iteration is 5.244 (see Ta- ble 3). After the iteration, the estimated average frequency of other β6 amounts to 5.488 (See Figure 1). In addition, these estimates differ significantly from 9 (p < 0.001) confirming hypothesis 2 (See Table 5 in Appendix 1). 2.2.3. Iteration The opportunity to review the subjective confidence in- tervals in step 4 was operated by 91% of participants in the free session, and 93% of participants in the session fee. The effect of using the iteration defined as the dif- ference between the number of correct answers in steps 4 and 1 is 0.089 (θ1 = 4.555; θ4 = 4.644) in the free session and 0.333 (β1 = 2.111; β4 = 2.444) in the session fee. The over-confidence interval decreases with the iteration (see Table 4), but this decrease is not significant for the free session (p = 0.253, t = 1.151). By cons, it is significant for the session fee (p = 0.01, t = 2.708) which is consis- tent with the hypothesis 3. (9 − β1) > (9 − β4) for the paid session. 2.2.4. Monetary Incentives The effect of monetary incentives will be considered at each step before and after iteration, since the pricing is different from one stage to another. Recall that in step 1, the compensation system is R = 0.5 + 5/(b − a). In step 2, if the participant correctly estimates the number of cor- rect responses it has made in the first stage, he won 0.5 TND. In step 3, if the participant correctly estimates the average number of correct responses made by his col- leagues, he earns 0.5 TND. The same principle is adopted for the iteration. Participants in overconfidence resulted intervals are too narrow to maximize their gain, so (β1 = 2.111), which represents the average number of correct answers is sig- nificantly lower (θ1 = 4.555). So, over-confidence as measured by the interval estimation in the session fee is higher than that measured in the free session. Overconfi- dence measured by the method of the estimation interval is 6.888 in the session fee prior iteration, and 4.444 in the free session before iteration. The difference is significant (p = 0, t = 7.558). After iteration (β4 = 2.444) is signifi- cantly lower (θ4 = 4.644). Table 3. Estimated average frequency of others in the two sessions before and after iteration. Value t p-value 1-Free session (9 − θ 3) 3.156 17.845 0.000 (9 − θ 6) 3.000 15.732 0.000 2-Session fee (9 − β 3) 3.756 17.783 0.000 (9 − β 6) 3.511 16.009 0.000 Table 4. Impact of iteration on overconfidence measured by the interval estimation method in the two sessions. Value T p-value 1-Free session (9 − θ 1) - (9 − θ 4)0.089 1.151 0.253 2-Session fee (9 − β 1) - (9 − β 4)0.333 2.708 0.010  An Experimental Analysis of Over-Confidence Copyright © 2013 SciRes. AJIBM 401 Therefore, the overconfidence as measured by the in- terval estimation in the paid session (6.555) is higher than that measured in the free session (4.355). The dif- ference is significant (p = 0.000). These results confirm the hypothesis 4-a: (9 − β1) > (9 − θ1) before iteration (9 − β4) > (9 − θ4) after iteration. In addition, we measured overconfidence per partici- pant for this psychological bias varies from person to person. For example, we see over-confidence is highest among participants 13, 24, 28, 31, 32 and 34 and lowest among participants 3, 21 and 17 in the session fee prior iteration. Those for which it is discovered through a broad over-confidence intervals are given too narrow to maximize their gains, many of them were too close to the answer that is to say if they have just expanded their ranges they would have answered correctly, and that's what we are trying to demonstrate. People overestimate the precision of their knowledge by giving intervals too narrow. Monetary motivation, which involves the accu- racy of the interval, caused the bias in over-confident participants (see Table 5). They are fans of the risk and want to maximize their gains. Plus this bias decreases as the data is less close intervals. In step 2, self-validation is paid, so (β2 = 5.066) and (θ2 = 6.088). The difference is significant (p = 0.00, t = 3.804). Results in Table 6 show that monetary incentives encourage participants to think before giving their esti- mates and reduce the exaggeration of the estimates. After iteration (β5 = 5.555) is less than (θ5 = 6.533). The dif- ference is significant (p = 0.002, t = 3.367). Before itera- tion, over-confidence measured by the method of esti- mating frequency is 1.533 in the free session, and 2.955 in the session fee (see Table 1). After iteration, overcon- fidence is 1.888 in the free session, and 3.111 in the ses- sion fee (see Table 1). It is clear that the hypothesis is rejected 4-b. That is to say, over-confidence as measured by the estimated frequency is not reduced by monetary incentives (see Table 6). On the contrary, it increased by iteration of 1.422 (p = 0.007, t = 3.660), and after itera- tion of 1.223 (p = 0.060, t = 2.908). This increase is due to the fact that the average number of correct responses in the session fee (β1 = 2.111) was significantly lower than the average number of correct answers in the free session (θ1 = 4.555) before iteration. The same results are confirmed after iteration (β4 = 2.444) is significantly lower (θ4 = 4.644). This is due to monetary incentives that led to the existence of the intervals are too narrow for lack of precision, thus the increase in number of wrong answers. We can conclude that monetary incentives have caused an increase in overconfidence as measured by the inter- val estimate and the estimate of frequency. In step 3, the estimated frequency of the other is paid. Before iteration, the effect “above average” is 0.244 (p = 0.36) for the free session, and −0.177 (p = 0.460) for the session fee. Effect “above average” is not significant in the session free of charge and pay before iteration. This effect decreased with monetary incentives, but this de- crease was not significant (p = 0.11) (See Table 6 in Appendix 1). After iteration, the effect of “above aver- age” is 0.533 (p = 0.058) for the free session and 0.066 (p = 0.79) for the session fee. Effect “above average” is significant at 10% in the free session, but not significant in the session fee after iteration. This effect also de- creased after iteration (p = 0.098). This decrease is sig- nificant at 10% (See Table 7 in Appendix 1). 3. Method of Question with Two Answer Choices The objective of this experiment is to measure overcon- fidence by a third method, called method of question with two answer choices. Subjects were two response alternatives, they must choose one to answer each ques- tion by giving a certain percentage of the response cho- sen on the scale [50% 100%]. We then studied the effects of monetary incentives on outcomes. This will be achieved by comparing the results of the free session and the session fee. The main objective of this third method is to compare the over-confidence as measured by three methods and see if the choice of scale measure may ag- gravate or alleviate this bias. Table 5. Impact of monetary incentives on overconfidence measured by the interval estimation method before and after iteration. Value t p-value (9 − β 1) - (9 − θ 1)2.444 7.558 0.000 (9 − β 4) - (9 − θ 4)2.200 6.383 0.000 Table 6. Impact of monetary incentives on overconfidence measured by frequency estimation method before and after iteration. Value t p-value Interpretation θ 2 − β 2 1.0223.804 0.000 θ 5 − β 5 0.9783.367 0.002 The monetary incentives incite participants to reflect before giving the estimation and reduce exaggeration of estimation ( β 2 − β 1) - ( θ 2 − θ 1)1.4223.660 0.001 ( β 5 − β 4) - ( θ 5 − θ 4)1.2232.908 0.006 Over-confidence measured by frequency estimation do not reduce with monetary incentives Reject of hypothesis 5  An Experimental Analysis of Over-Confidence Copyright © 2013 SciRes. AJIBM 402 3.1. Models of the Experience and Assumptions 3.1.1. Participants and Procedures The experiment will involve 45 students at the ISG of Tunis. In fact, the same students who participated in the first experiment participated also in the second and for having an adequate basis for comparison between the three methods. This experience is also composed of two sessions, one is free the other is paying. In the session fee, participants will be paid in propor- tion of correct responses they made. We follow the com- pensation system as follows: • In step 1, a correct answer is remunerated by 1 TND. • In step 2, a self-validation is properly remunerated by 0.5 TND. • In step 3, the estimated frequency of correct answer of others is paid by 0.5 TND. The experiment has three steps described below (no iteration): Step 1 Participants must answer ten questions, choosing an alternative among the two alternatives proposed. Then they give a certain percentage of this response on the scale [50% 100%]. The percentage cannot be less than 50% because it implies the choice of alternative. Step 2 We asked each subject to estimate the number of cor- rect answers that he made in the ten questions. This is the stage of self-validation. Step 3 We asked each subject to estimate the average number of correct answers that these colleagues have conducted on the ten questions. As mentioned earlier, this experience also includes two sessions: the first is free and the second is paid off. Each session consists of three steps described above. The questions in both sessions are different but the same type that is to say that the sample is heterogeneous and is not selected for the difficulty. The purpose of this change is to avoid the effect of learning that can bias the analysis. It should be noted that the questions asked in the session free of the first experiment are identical to those raised in the free session of the second experiment. The questions asked in the session fee of the first experiment are iden- tical to those asked in the session fee in the second ex- periment. 3.1.2. Assumptions and Tests Let αi the population mean in step i (i = 1, 2 and 3) for the free session, and λi the population mean in step i (i = 1, 2 and 3) for the session fee. So α1 [λ1] refers to the average number of correct an- swers in step 1 for the free session [paid]. α2 [λ2] refers to the estimated average frequency in Step 2 for the free session [pay]. α3 [λ3] refers to the estimate of the average frequency of the other session for free [pay]. α4 is me- dium confidence of participants in step 1 for the entire issue of the free session, λ4 is medium confidence of par- ticipants in step 1 for the entire question of the session fee. Comparison of over-confidence as measured by the method of confidence interval and the method of ques- tion two answer choices: 1) Comparison of over-confidence as measured by the method of confidence interval and the method of question with two answer choices In our experiment, we measured the over-confidence by the method of question two answer choices per par- ticipant for the entire population (see Tables 1 and 2 in Appendix 2) to compare it with that measured by the method of confidence interval used in step 1 and 4 of the first experiment. Hypothesis 1: over-confidence as measured by the method of the confidence interval is greater than that measured by the method of question two answer choices: For the free session, this hypothesis implies that (9 − θ1) > (α4 − α1) and (9 − θ4) > (α4 − α1). For paid session, this hypothesis implies that (9 − β1) > (λ4 − λ1) and (9 − β4) > (λ4 − λ1). In the first case, we will see if the over-confidence measured by the method of estimating the interval is greater than that measured by the method of question two answer choices in both free and paid sessions. 2) Frequency estimation of others By examining the frequency estimation of others through step 3, it is expected that participants expect the over-confidence of others. Hypothesis 2: Participants anticipate the confi- dence of others: α3 < α4 for free session λ3 < λ4 for the paid session. 3) Monetary incentives Our experiment consists of two sessions, the first is free and the second is paid off. It should be noted that the sample of questions is not the same for both sessions so as not to bias the results by the effect of learning. How- ever, both samples include questions of general knowl- edge in much the same type. In the session fee, participants are paid for each correct answer of a dinar. So we expected to exert more effort and thought to respond appropriately. Therefore, the overconfidence as measured by the method of question two answer choices will usually be reduced by monetary incentives. In step 2, self-validation is paid to 0.5 dinar. It is ex- pected that overconfidence as measured by the estimated frequency is reduced in this experiment. In step 3, the estimated frequency of the other is paid 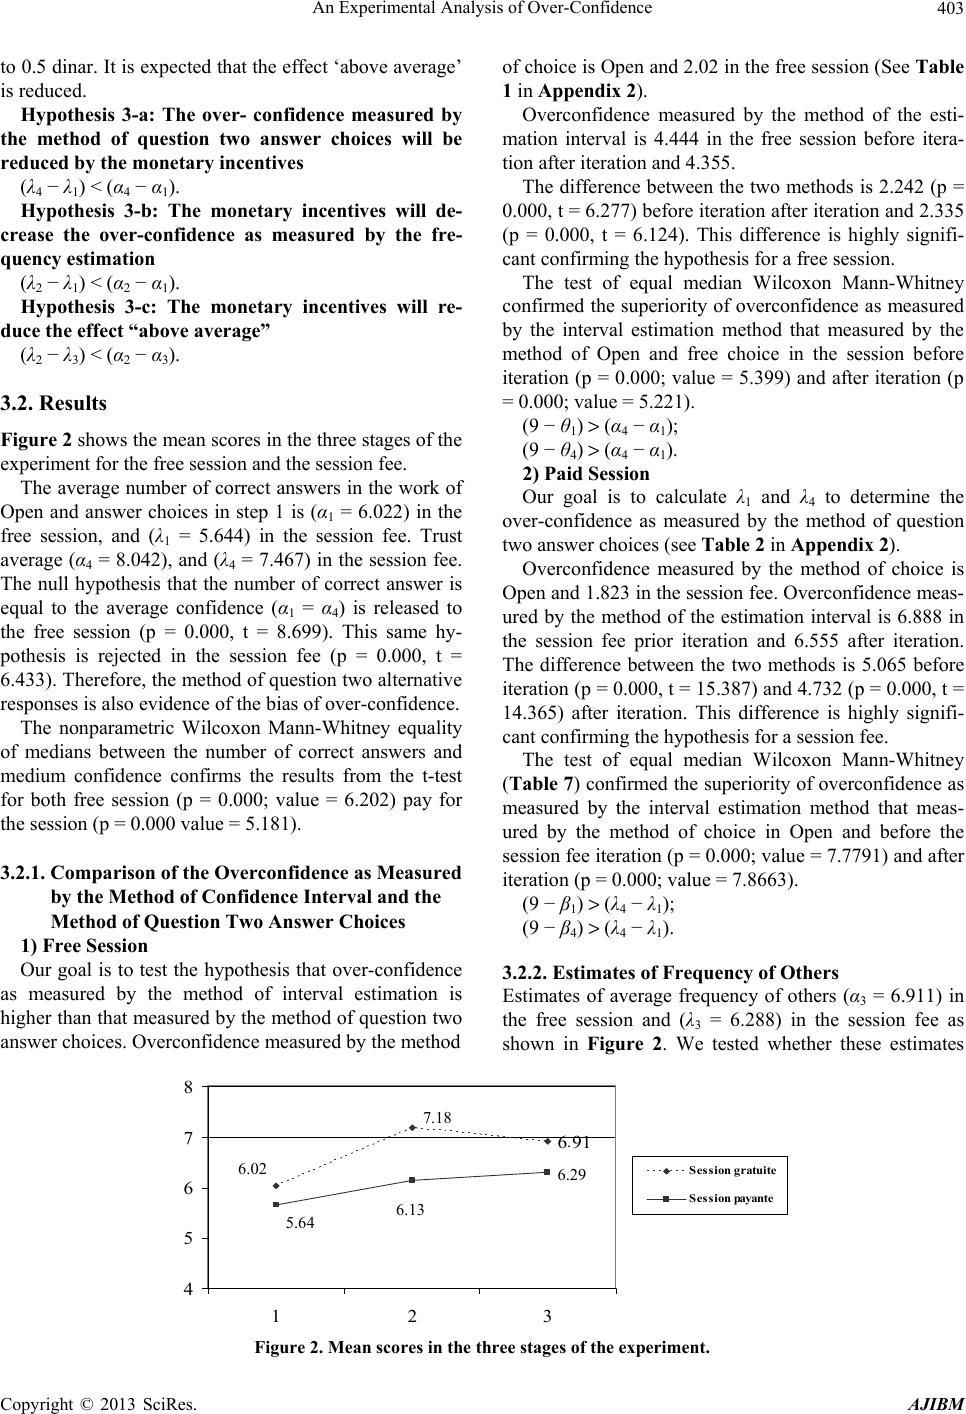 An Experimental Analysis of Over-Confidence Copyright © 2013 SciRes. AJIBM 403 to 0.5 dinar. It is expected that the effect ‘above average’ is reduced. Hypothesis 3-a: The over- confidence measured by the method of question two answer choices will be reduced by the monetary incentives (λ4 − λ1) < (α4 − α1). Hypothesis 3-b: The monetary incentives will de- crease the over-confidence as measured by the fre- quency estimation (λ2 − λ1) < (α2 − α1). Hypothesis 3-c: The monetary incentives will re- duce the effect “above average” (λ2 − λ3) < (α2 − α3). 3.2. Results Figure 2 shows the mean scores in the three stages of the experiment for the free session and the session fee. The average number of correct answers in the work of Open and answer choices in step 1 is (α1 = 6.022) in the free session, and (λ1 = 5.644) in the session fee. Trust average (α4 = 8.042), and (λ4 = 7.467) in the session fee. The null hypothesis that the number of correct answer is equal to the average confidence (α1 = α4) is released to the free session (p = 0.000, t = 8.699). This same hy- pothesis is rejected in the session fee (p = 0.000, t = 6.433). Therefore, the method of question two alternative responses is also evidence of the bias of over-confidence. The nonparametric Wilcoxon Mann-Whitney equality of medians between the number of correct answers and medium confidence confirms the results from the t-test for both free session (p = 0.000; value = 6.202) pay for the session (p = 0.000 value = 5.181). 3.2.1. Comparison of the Overconfidence as Measured by the Method of Confidence Interval and the Method of Question Two Answer Choices 1) Free Session Our goal is to test the hypothesis that over-confidence as measured by the method of interval estimation is higher than that measured by the method of question two answer choices. Overconfidence measured by the method of choice is Open and 2.02 in the free session (See Table 1 in Appendix 2). Overconfidence measured by the method of the esti- mation interval is 4.444 in the free session before itera- tion after iteration and 4.355. The difference between the two methods is 2.242 (p = 0.000, t = 6.277) before iteration after iteration and 2.335 (p = 0.000, t = 6.124). This difference is highly signifi- cant confirming the hypothesis for a free session. The test of equal median Wilcoxon Mann-Whitney confirmed the superiority of overconfidence as measured by the interval estimation method that measured by the method of Open and free choice in the session before iteration (p = 0.000; value = 5.399) and after iteration (p = 0.000; value = 5.221). (9 − θ1) > (α4 − α1); (9 − θ4) > (α4 − α1). 2) Paid Session Our goal is to calculate λ1 and λ4 to determine the over-confidence as measured by the method of question two answer choices (see Table 2 in Appendix 2). Overconfidence measured by the method of choice is Open and 1.823 in the session fee. Overconfidence meas- ured by the method of the estimation interval is 6.888 in the session fee prior iteration and 6.555 after iteration. The difference between the two methods is 5.065 before iteration (p = 0.000, t = 15.387) and 4.732 (p = 0.000, t = 14.365) after iteration. This difference is highly signifi- cant confirming the hypothesis for a session fee. The test of equal median Wilcoxon Mann-Whitney (Table 7) confirmed the superiority of overconfidence as measured by the interval estimation method that meas- ured by the method of choice in Open and before the session fee iteration (p = 0.000; value = 7.7791) and after iteration (p = 0.000; value = 7.8663). (9 − β1) > (λ4 − λ1); (9 − β4) > (λ4 − λ1). 3.2.2. Estimates of Frequency of Others Estimates of average frequency of others (α3 = 6.911) in the free session and (λ3 = 6.288) in the session fee as shown in Figure 2. We tested whether these estimates 6,91 6,29 7,18 6,02 6,13 5,64 4 5 6 7 8 123 Session gratuite Session payante 7.18 6.02 5.64 6.13 6.29 . Figure 2. Mean scores in the three stages of the experiment.  An Experimental Analysis of Over-Confidence Copyright © 2013 SciRes. AJIBM 404 Table 7. Comparison of the overconfidence as measured by the method of confidence interval and the method of ques- tion two answer choices. Value t p-value Wilcoxon Mann-Whitney (9 − θ 1) - ( α 4 − α 1) 2.424 6.2770.000 5.399 (9 − θ 4) - ( α 4 − α 1) 2.335 6.1240.000 5.221 (9 − β 1) - ( λ 4 − λ 1) 5.065 15.3870.000 7.7791 (9 − β 4) - ( λ 4 − λ 1) 4.732 14.3650.000 7.866 differ significantly from the α4 or medium confidence in the free session, and λ4 in the session fee. α4 = 8.042 and λ4 = 7.467 (see Tables 3 and 4 in Appendix 2). α3 < α4 and (p = 0.000, t = 5.717), the difference is sig- nificant. The hypothesis is confirmed in the free session. λ3 < λ4 and (p = 0.000, t = 5.799) the difference is sig- nificant. So the hypothesis is confirmed in the session fee. The test of equal median Wilcoxon Mann-Whitney confirmed these results both for the free session (p = 0.000; value = 4.027) than pay for the session (p = 0.000; value = 4.580). Therefore, we can conclude that the par- ticipants expect the over-confidence of others. 3.2.3. Monetary Incentives Overconfidence measured by the method of choice is Open and 2.02 in the free session and 1.823 in the ses- sion fee. We tested whether overconfidence decreases by monetary incentives. The difference is 0.197 (p = 0.577) (Table 8). It is no longer significant, 3-a hypothesis is rejected. In addition, the test of equal median shows that overconfidence is not reduced by the monetary incentives (p = 0.358). The estimated frequency is α2 = 7.177 for the free ses- sion, and λ2 = 6.133 for the session fee. Overconfidence measured by estimated frequency is 1.155 in the free session, and 0.489 in the session fee. It was verified that overconfidence decreases by monetary incentives but this decrease was not significant (p = 0.137 for the t-test, p = 0.089) led to the dismissal of the case 3-b. The rejection of hypotheses 3-a and 3-b reflects the persistence of overconfidence. Indeed, this bias is not weakened by monetary incentives. The estimate of the average frequency of others is α3 = 6.911 in the free session and λ3 = 6.288 in the session fee. Effect “above average” is 0.266 (α2 − α3) in the free ses- sion and −0.155 (λ2 − λ3) in the session fee. This effect decreased with monetary incentives (p = 0.053). The decrease is significant at 10% assuming 3-c is checked (See Tables 3 and 4 in Appendix 2). Table 8. Impact of monetary incentives on overconfidence measured by the method of question with two answer choices. Value t p-value Wilcoxon Mann-Whitney ( α 4 − α 1) - ( λ 4 − λ 1)0.1970.562 0.577 0.919946 4. Conclusions We tried to measure and test the existence of the bias of over-confidence and to examine the sensitivity of this bias with respect to several factors. These factors are the method of measurement, monetary incentives and itera- tion. The review of the literature tells us that overconfi- dence can be measured by three methods namely; the interval estimation method, the method of estimating frequency and method of question two choices. We have conducted an experiment involving students from the ISG Tunis in order to measure overconfidence through these three methods. The results of this experiment show the existence of this bias for the three methods and thus support the empirical evidence of Russo and Schoemaker [17], Justin et al. [20], Cesarini et al. [21] and Klyaman et al. [22]. At the sensitivity analysis of this bias, the tests show that the method of interval leads to higher steps in com- parison with other methods. These results confirm the empirical evidence observed by Cesarini et al. [21]. The study of the effect of monetary incentives on the level of overconfidence revealed conflicting results. First, monetary incentives boost the level of overcon- fidence for the method of estimating the range as well as the estimation method of frequency. On the other hand, overconfidence is not significantly sensitive to monetary incentives when measured by the method of question two choices. In our view, this discrepancy is explained by the form of compensation issues. Indeed, the level of ex- perience with the first two methods, the existence of a variable component of compensation depending on the accuracy of answers prompted the subjects to take more risk by opting for more precise answers and less accurate in the session fee in the free session. So the number of correct responses decreased, and therefore, over-confi- dence has increased. As regards the method of question two choices, the form of total compensation fixed and independent of the accuracy of answers does not lead subjects to make a trade-off between accuracy and preci- sion of the responses to the extent that it does not matter. As a result, the number of correct answers, and overcon- fidence was not significantly affected by monetary in- centives. Regarding the impact of iteration on overconfi- dence, the tests indicate the significance of it depends on  An Experimental Analysis of Over-Confidence Copyright © 2013 SciRes. AJIBM 405 the motivation of money. In the session fee, one observes that the subjects offered by reviewing their responses, wider intervals reflect better understanding of the con- cept of the range of 90%. So with the iteration, the num- ber of intervals containing the correct answer has in- creased and overconfidence is significantly reduced. In the absence of monetary incentives, these mechanisms did not function properly and over-confidence is not af- fected by the iteration. REFERENCES [1] O. Svenson, “Are We All Less Risky and More Skillful than Our Fellow Driver,” Acta Psychologia, Vol. 47, No. 2, 1981, pp. 143-148. doi:10.1016/0001-6918(81)90005-6 [2] M. Alpert and H. Raiffa, “A Progress Report on the Training of Probability Assessors,” In D. Kahneman, P. Slovic and A. Tversky, Ed., Judgment Under Uncertainty: Heuristics and Biases, Cambridge University Press, Cambridge, 1982, pp. 294-305. doi:10.1017/CBO9780511809477.022 [3] J. B. De Long, A. Shleifer, S. Lawrence and R. J. Waldmann, “The Survival of Noise Traders in Financial Markets,” Journal of Business, Vol. 64, No. 1, 1991, pp. 1-19. doi:10.1086/296523 [4] A. Kyle and F. A. Wang, “Speculation Duopoly with Agreement to Disagree: Can Overconfidence Survive the Market Test?” Journal of Finance, Vol. 52, No. 5, 1997, pp. 2073-2090. doi:10.1111/j.1540-6261.1997.tb02751.x [5] T. Odean, “Volume, Volatility, Price and Profit when all Traders are above Average,” Journal of Finance, Vol. 53, No.6, 1998, pp. 1887-1934. doi:10.1111/0022-1082.00078 [6] K. D. Daniel, D. Hirshleifer and A. Subrahmanyam, “In- vestor Psychology and Security Market Under- and Over- reactions,” Journal of Finance, Vol. 53, No. 6, 1998, pp. 1839-1885. doi:10.1111/0022-1082.00077 [7] A. Admati and P. Pfleiderer, “A Theory of Intraday Pat- terns: Volume and Price Variability,” Review of Financial Studies, Vol. 1, No. 1, 1988, pp. 3-40. doi:10.1093/rfs/1.1.3 [8] F. D. Foster and S. Viswanathan, “A Theory of Interday Variations in Volumes, Variances and Trading Costs,” Review of Financial Studies, Vol. 3, No. 4, 1990, pp. 593-624. doi:10.1093/rfs/3.4.593 [9] A. Kyle, “Continuous Auctions and Insider Trading,” Econometrica, Vol. 53, No. 6, 1985, pp. 1315-1336. doi:10.2307/1913210 [10] G. Llorente, R. Michaely, G. Saar and J. Wang, “Dy- namic Volume-Return Relation of Individual Stocks,” Review of Financial Studies, Vol. 15, No. 4, 2002, pp. 1005-1047. doi:10.1093/rfs/15.4.1005 [11] J. Wang, “A Model of Competitive Stock Trading Vol- ume,” Journal of Political Economy, Vol. 102, 1994, No. 1, pp. 127-168. [12] B. Biais, D. Hilton, K. Mazurier and S. Pouget, “Judg- mental Overconfidence, Self-Monitoring and Trading Performance in an Experimental Financial Market,” Re- view of Economic Studies, Vol. 72, No. 2, 2005, pp. 287-312. doi:10.1111/j.1467-937X.2005.00333.x [13] M. Glaser and M. Weber, “Overconfidence and Trading Volume,” Geneva Risk and Insurance Review, Vol. 32, No. 1, 2007, pp. 1-36. doi:10.1007/s10713-007-0003-3 [14] S. Gervais and T. Odean, “Learning to be Overconfident,” Review of Financial Studies, Vol. 14, No. 1, 2001, pp. 1-27. doi:10.1093/rfs/14.1.1 [15] W. Chuang and B. Lee, “An Empirical Evaluation of the Overconfidence Hypothesis,” Journal of Banking and Finance, Vol. 30, No. 9, 2006, pp. 2489-2515. doi:10.1016/j.jbankfin.2005.08.007 [16] S. Lichtenstein, B. Fischhoff and L. D. Phillips, “Calibra- tion of Probabilities: The State of the Art to 1980,” In: D. Kahneman, P. Solvic and A. Tversky, Eds., Judgment under Uncertainty: Heuristics and Biases, Cambridge University Press, Cambridge, New York, 1982. doi:10.1017/CBO9780511809477.023 [17] J. E. Russo and P. J. H. Schoemaker, “Managing Over- confidence,” Sloan Management Review, Vol. 33, No. 2, 1992, pp. 7-17 [18] D. Davis and C. Holt, “Experimental Economics,” Princeton University Press, Princeton, 1993. [19] V. Smith and J. Walker, “Monetary Rewards and Deci- sion Cost in Experimental Economics,” Economic Inquiry, Vol. 31, No. 2, 1993, pp. 245-261. doi:10.1111/j.1465-7295.1993.tb00881.x [20] P. Juslin, P. Wennerholm and H. Olsson, “Format De- pendence in Subjective Probability Calibration,” Journal of Experimental Psychology: Learning, Memory, and Cognition, Vol. 25, No. 4, 1999, pp. 1038-1052. doi:10.1037/0278-7393.25.4.1038 [21] D. Cesarini, O. Sandewall and M. Johannesson, “Confi- dence Interval Estimation Tasks and the Economics of Overconfidence,” Journal of Economic Behavior and Organization, Vol. 61, No. 3, 2006, pp. 453-470. doi:10.1016/j.jebo.2004.10.010 [22] J. Klayman, J. B. Soll, C. Gonzalez-Vallejo and C. Barlas, “Overconfidence: It Depends on How, What and Whom You Ask,” Organizational Behavior and Human Decision Processes, Vol. 79, No. 3, 1999, pp. 216-247. doi:10.1006/obhd.1999.2847  An Experimental Analysis of Over-Confidence Copyright © 2013 SciRes. AJIBM 406 Appendix 1 Table 1. Overconfidence measured by interval estimation method and frequency estimation method for every player and for the sample in the free session before iteration. Player Frequency estimation ( θ 2) Number of correct answer ( θ 1) Overconfidence measured by interval estimation (9 − θ 1) Overconfidence measured by frequency estimation ( θ 1 − θ 2) Frequency estimation of others ( θ 3) Player 1 7 5 4 2 6 Player 2 7 6 3 1 6 Player 3 5 4 5 1 Player 4 6 5 4 1 7 Player 5 8 4 5 4 7 Player 6 7 3 6 4 6 Player 7 5 5 4 0 5 Player 8 2 4 5 −2 3 Player 9 6 6 3 0 6 Player 10 9 8 1 1 8 Player 11 7 8 1 −1 5 Player 12 10 2 7 8 6 Player 13 4 3 6 1 7 Player 14 4 4 5 0 6 Player 15 7 3 6 4 4 Player 16 8 4 5 4 7 Player 17 6 5 4 1 5 Player 18 5 3 6 2 4 Player 19 5 5 4 0 6 Player 20 5 4 5 1 7 Player 21 6 4 5 2 5 Player 22 7 7 2 0 5 Player 23 7 6 3 1 7 Player 24 5 2 7 3 4 Player 25 5 8 1 −3 6 Player 26 10 8 1 2 6 Player 27 5 4 5 1 6 Player 28 8 5 4 3 7 Player 29 9 7 2 2 8 Player 30 7 5 4 2 8 Player 31 4 3 6 1 6 Player 32 4 2 7 2 6 Player 33 7 6 3 1 5 Player 34 5 6 3 −1 5 Player 35 4 3 6 1 5 Player 36 6 3 6 3 7 Player 37 8 6 3 2 4 Player 38 3 0 9 3 6 Player 39 7 6 3 1 5 Player 40 7 5 4 2 6 Player 41 5 5 4 0 8 Player 42 5 4 5 1 4 Player 43 6 0 9 6 6 Player 44 4 3 6 1 5 Player 45 7 6 3 1 6 Moyenne 6.088888889 4.555555556 4.444444444 1.533333333 5.844444444 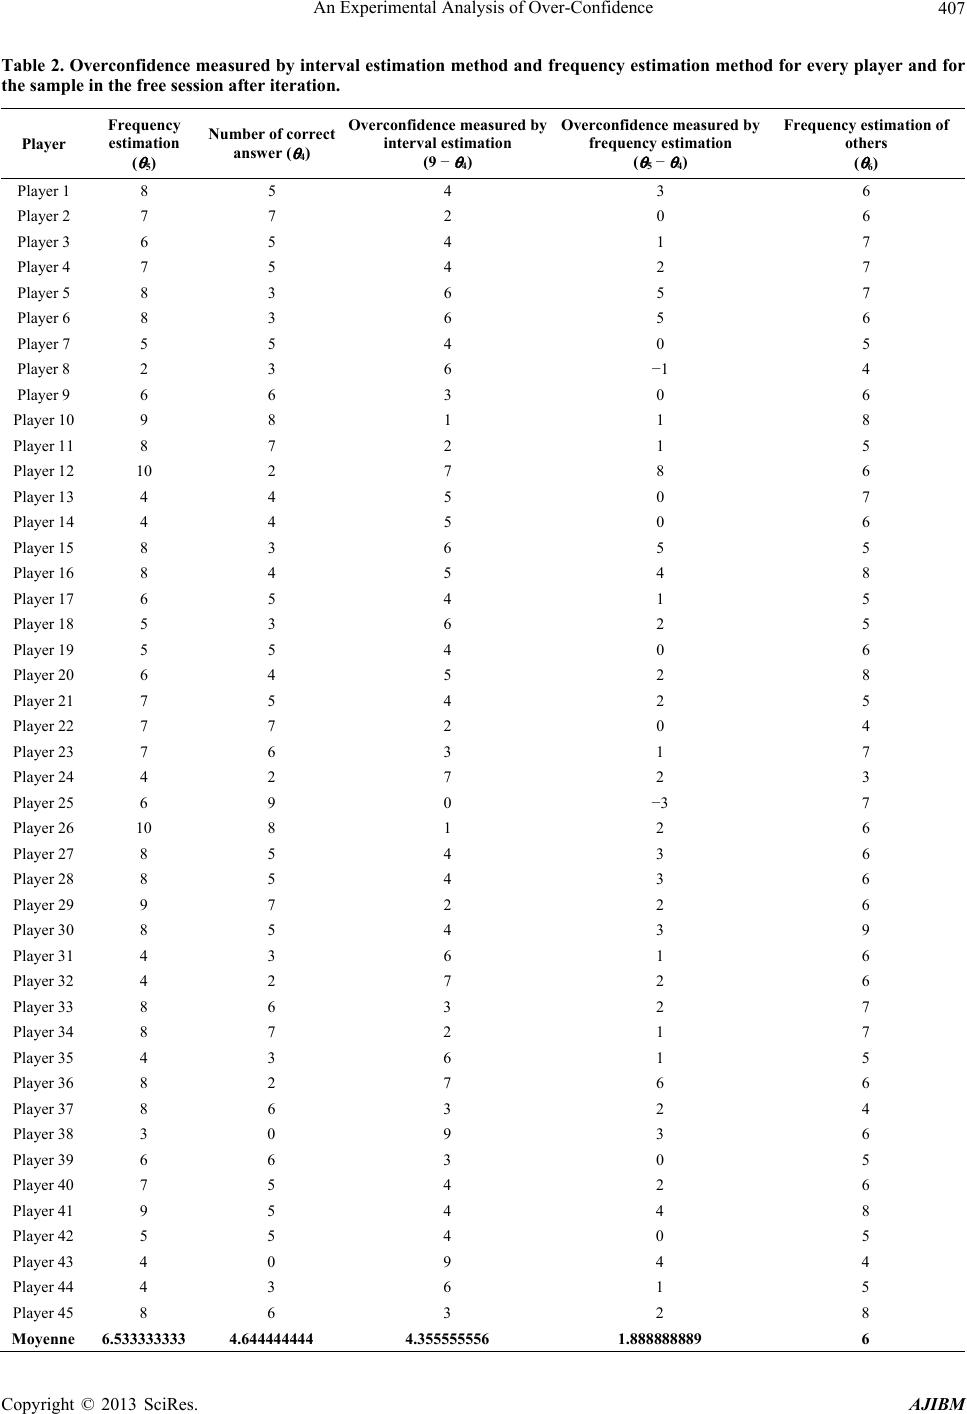 An Experimental Analysis of Over-Confidence Copyright © 2013 SciRes. AJIBM 407 Table 2. Overconfidence measured by interval estimation method and frequency estimation method for every player and for the sample in the free session after iteration. Player Frequency estimation ( θ 5) Number of correct answer ( θ 4) Overconfidence measured by interval estimation (9 − θ 4) Overconfidence measured by frequency estimation ( θ 5 − θ 4) Frequency estimation of others ( θ 6) Player 1 8 5 4 3 6 Player 2 7 7 2 0 6 Player 3 6 5 4 1 7 Player 4 7 5 4 2 7 Player 5 8 3 6 5 7 Player 6 8 3 6 5 6 Player 7 5 5 4 0 5 Player 8 2 3 6 −1 4 Player 9 6 6 3 0 6 Player 10 9 8 1 1 8 Player 11 8 7 2 1 5 Player 12 10 2 7 8 6 Player 13 4 4 5 0 7 Player 14 4 4 5 0 6 Player 15 8 3 6 5 5 Player 16 8 4 5 4 8 Player 17 6 5 4 1 5 Player 18 5 3 6 2 5 Player 19 5 5 4 0 6 Player 20 6 4 5 2 8 Player 21 7 5 4 2 5 Player 22 7 7 2 0 4 Player 23 7 6 3 1 7 Player 24 4 2 7 2 3 Player 25 6 9 0 −3 7 Player 26 10 8 1 2 6 Player 27 8 5 4 3 6 Player 28 8 5 4 3 6 Player 29 9 7 2 2 6 Player 30 8 5 4 3 9 Player 31 4 3 6 1 6 Player 32 4 2 7 2 6 Player 33 8 6 3 2 7 Player 34 8 7 2 1 7 Player 35 4 3 6 1 5 Player 36 8 2 7 6 6 Player 37 8 6 3 2 4 Player 38 3 0 9 3 6 Player 39 6 6 3 0 5 Player 40 7 5 4 2 6 Player 41 9 5 4 4 8 Player 42 5 5 4 0 5 Player 43 4 0 9 4 4 Player 44 4 3 6 1 5 Player 45 8 6 3 2 8 Moyenne 6.533333333 4.644444444 4.355555556 1.888888889 6 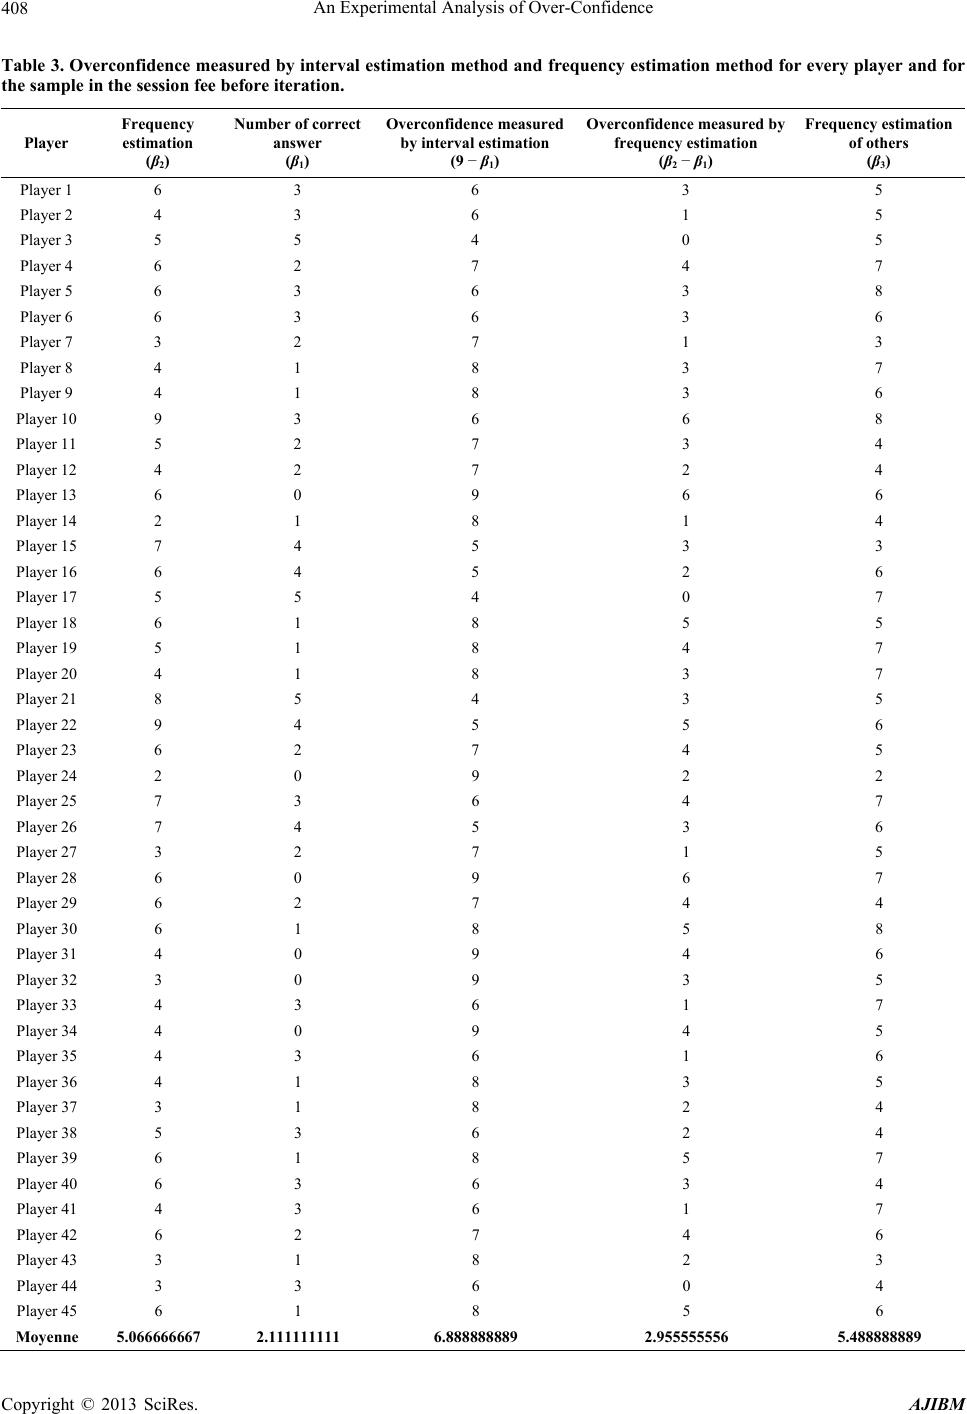 An Experimental Analysis of Over-Confidence Copyright © 2013 SciRes. AJIBM 408 Table 3. Overconfidence measured by interval estimation method and frequency estimation method for every player and for the sample in the session fee before iteration. Player Frequency estimation (β2) Number of correct answer (β1) Overconfidence measured by interval estimation (9 − β1) Overconfidence measured by frequency estimation (β2 − β1) Frequency estimation of others (β3) Player 1 6 3 6 3 5 Player 2 4 3 6 1 5 Player 3 5 5 4 0 5 Player 4 6 2 7 4 7 Player 5 6 3 6 3 8 Player 6 6 3 6 3 6 Player 7 3 2 7 1 3 Player 8 4 1 8 3 7 Player 9 4 1 8 3 6 Player 10 9 3 6 6 8 Player 11 5 2 7 3 4 Player 12 4 2 7 2 4 Player 13 6 0 9 6 6 Player 14 2 1 8 1 4 Player 15 7 4 5 3 3 Player 16 6 4 5 2 6 Player 17 5 5 4 0 7 Player 18 6 1 8 5 5 Player 19 5 1 8 4 7 Player 20 4 1 8 3 7 Player 21 8 5 4 3 5 Player 22 9 4 5 5 6 Player 23 6 2 7 4 5 Player 24 2 0 9 2 2 Player 25 7 3 6 4 7 Player 26 7 4 5 3 6 Player 27 3 2 7 1 5 Player 28 6 0 9 6 7 Player 29 6 2 7 4 4 Player 30 6 1 8 5 8 Player 31 4 0 9 4 6 Player 32 3 0 9 3 5 Player 33 4 3 6 1 7 Player 34 4 0 9 4 5 Player 35 4 3 6 1 6 Player 36 4 1 8 3 5 Player 37 3 1 8 2 4 Player 38 5 3 6 2 4 Player 39 6 1 8 5 7 Player 40 6 3 6 3 4 Player 41 4 3 6 1 7 Player 42 6 2 7 4 6 Player 43 3 1 8 2 3 Player 44 3 3 6 0 4 Player 45 6 1 8 5 6 Moyenne 5.066666667 2.111111111 6.888888889 2.955555556 5.488888889 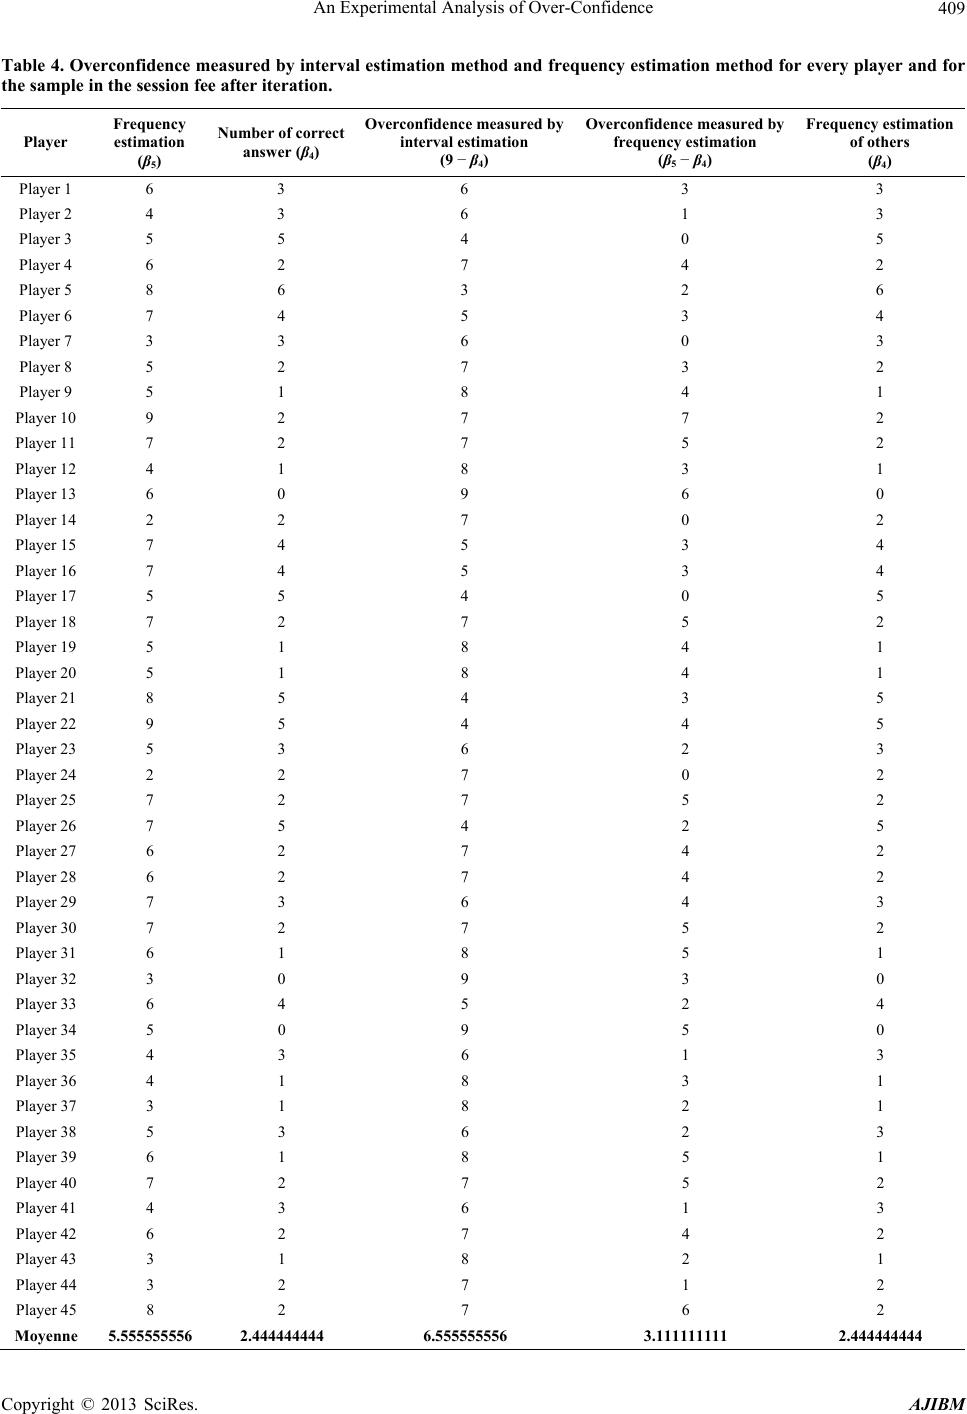 An Experimental Analysis of Over-Confidence Copyright © 2013 SciRes. AJIBM 409 Table 4. Overconfidence measured by interval estimation method and frequency estimation method for every player and for the sample in the session fee after iteration. Player Frequency estimation (β5) Number of correct answer (β4) Overconfidence measured by interval estimation (9 − β4) Overconfidence measured by frequency estimation (β5 − β4) Frequency estimation of others (β4) Player 1 6 3 6 3 3 Player 2 4 3 6 1 3 Player 3 5 5 4 0 5 Player 4 6 2 7 4 2 Player 5 8 6 3 2 6 Player 6 7 4 5 3 4 Player 7 3 3 6 0 3 Player 8 5 2 7 3 2 Player 9 5 1 8 4 1 Player 10 9 2 7 7 2 Player 11 7 2 7 5 2 Player 12 4 1 8 3 1 Player 13 6 0 9 6 0 Player 14 2 2 7 0 2 Player 15 7 4 5 3 4 Player 16 7 4 5 3 4 Player 17 5 5 4 0 5 Player 18 7 2 7 5 2 Player 19 5 1 8 4 1 Player 20 5 1 8 4 1 Player 21 8 5 4 3 5 Player 22 9 5 4 4 5 Player 23 5 3 6 2 3 Player 24 2 2 7 0 2 Player 25 7 2 7 5 2 Player 26 7 5 4 2 5 Player 27 6 2 7 4 2 Player 28 6 2 7 4 2 Player 29 7 3 6 4 3 Player 30 7 2 7 5 2 Player 31 6 1 8 5 1 Player 32 3 0 9 3 0 Player 33 6 4 5 2 4 Player 34 5 0 9 5 0 Player 35 4 3 6 1 3 Player 36 4 1 8 3 1 Player 37 3 1 8 2 1 Player 38 5 3 6 2 3 Player 39 6 1 8 5 1 Player 40 7 2 7 5 2 Player 41 4 3 6 1 3 Player 42 6 2 7 4 2 Player 43 3 1 8 2 1 Player 44 3 2 7 1 2 Player 45 8 2 7 6 2 Moyenne 5.555555556 2.444444444 6.555555556 3.111111111 2.444444444 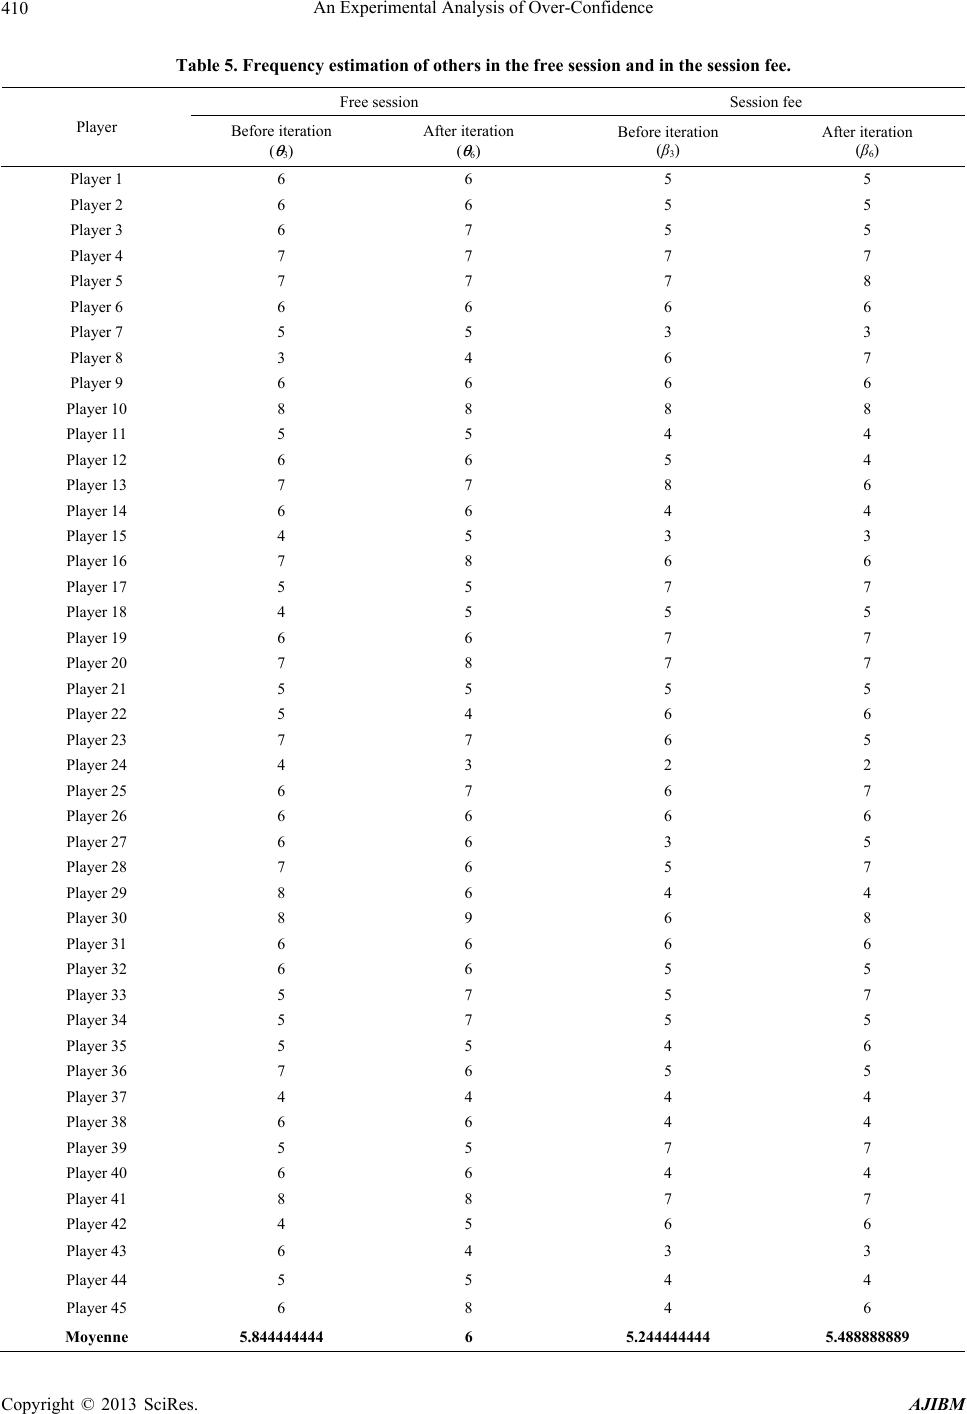 An Experimental Analysis of Over-Confidence Copyright © 2013 SciRes. AJIBM 410 Table 5. Frequency estimation of others in the free session and in the session fee. Free session Session fee Player Before iteration ( θ 3) After iteration ( θ 6) Before iteration (β3) After iteration (β6) Player 1 6 6 5 5 Player 2 6 6 5 5 Player 3 6 7 5 5 Player 4 7 7 7 7 Player 5 7 7 7 8 Player 6 6 6 6 6 Player 7 5 5 3 3 Player 8 3 4 6 7 Player 9 6 6 6 6 Player 10 8 8 8 8 Player 11 5 5 4 4 Player 12 6 6 5 4 Player 13 7 7 8 6 Player 14 6 6 4 4 Player 15 4 5 3 3 Player 16 7 8 6 6 Player 17 5 5 7 7 Player 18 4 5 5 5 Player 19 6 6 7 7 Player 20 7 8 7 7 Player 21 5 5 5 5 Player 22 5 4 6 6 Player 23 7 7 6 5 Player 24 4 3 2 2 Player 25 6 7 6 7 Player 26 6 6 6 6 Player 27 6 6 3 5 Player 28 7 6 5 7 Player 29 8 6 4 4 Player 30 8 9 6 8 Player 31 6 6 6 6 Player 32 6 6 5 5 Player 33 5 7 5 7 Player 34 5 7 5 5 Player 35 5 5 4 6 Player 36 7 6 5 5 Player 37 4 4 4 4 Player 38 6 6 4 4 Player 39 5 5 7 7 Player 40 6 6 4 4 Player 41 8 8 7 7 Player 42 4 5 6 6 Player 43 6 4 3 3 Player 44 5 5 4 4 Player 45 6 8 4 6 Moyenne 5.844444444 6 5.244444444 5.488888889 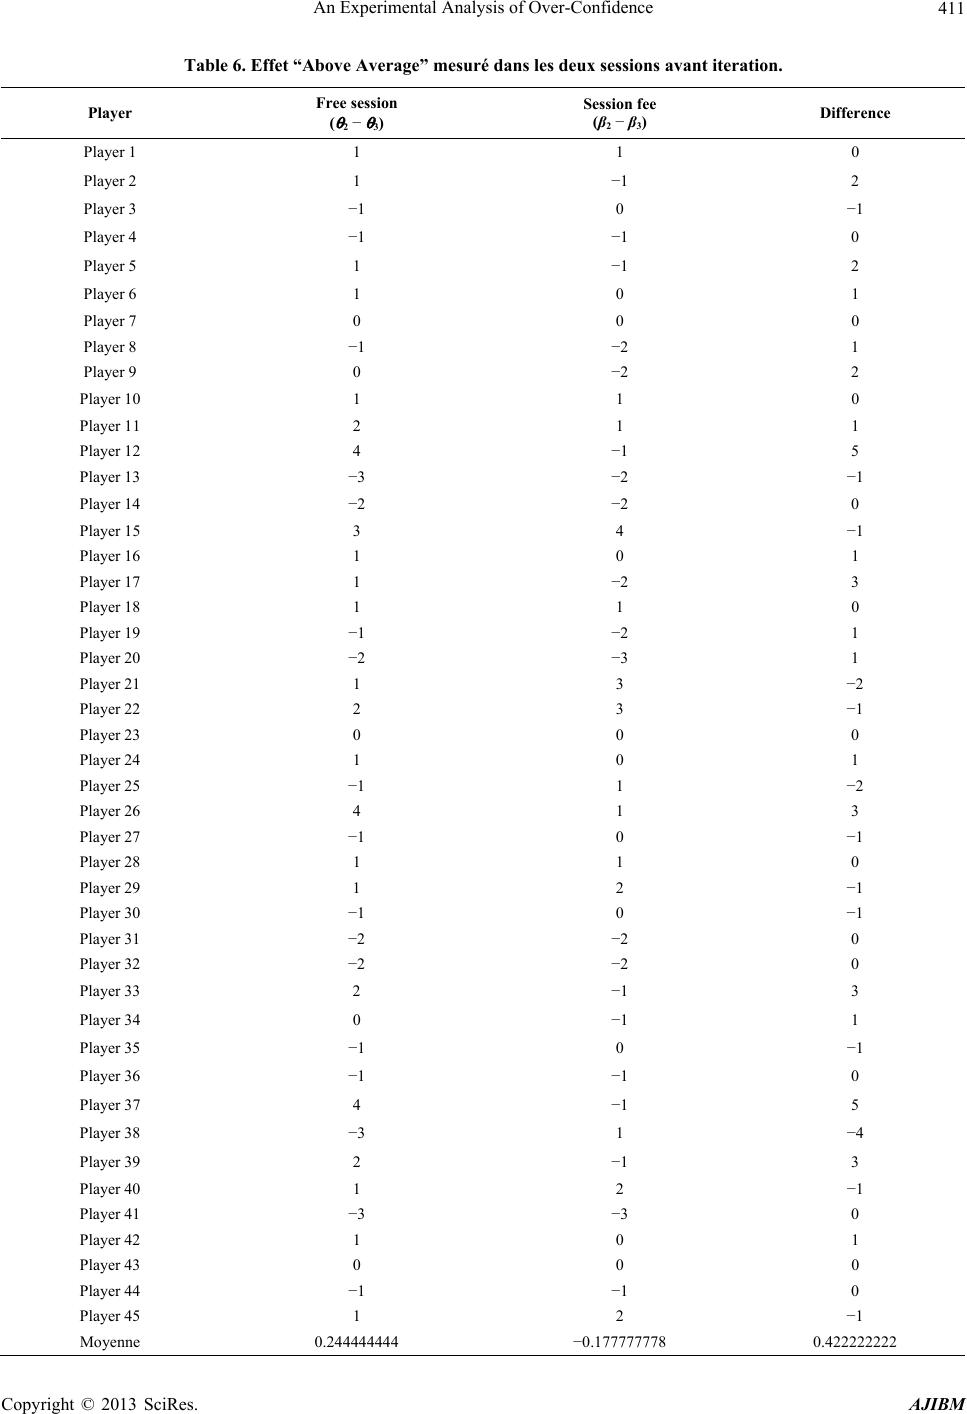 An Experimental Analysis of Over-Confidence Copyright © 2013 SciRes. AJIBM 411 Table 6. Effet “Above Average” mesuré dans les deux sessions avant iteration. Player Free session ( θ 2 − θ 3) Session fee (β2 − β3) Difference Player 1 1 1 0 Player 2 1 −1 2 Player 3 −1 0 −1 Player 4 −1 −1 0 Player 5 1 −1 2 Player 6 1 0 1 Player 7 0 0 0 Player 8 −1 −2 1 Player 9 0 −2 2 Player 10 1 1 0 Player 11 2 1 1 Player 12 4 −1 5 Player 13 −3 −2 −1 Player 14 −2 −2 0 Player 15 3 4 −1 Player 16 1 0 1 Player 17 1 −2 3 Player 18 1 1 0 Player 19 −1 −2 1 Player 20 −2 −3 1 Player 21 1 3 −2 Player 22 2 3 −1 Player 23 0 0 0 Player 24 1 0 1 Player 25 −1 1 −2 Player 26 4 1 3 Player 27 −1 0 −1 Player 28 1 1 0 Player 29 1 2 −1 Player 30 −1 0 −1 Player 31 −2 −2 0 Player 32 −2 −2 0 Player 33 2 −1 3 Player 34 0 −1 1 Player 35 −1 0 −1 Player 36 −1 −1 0 Player 37 4 −1 5 Player 38 −3 1 −4 Player 39 2 −1 3 Player 40 1 2 −1 Player 41 −3 −3 0 Player 42 1 0 1 Player 43 0 0 0 Player 44 −1 −1 0 Player 45 1 2 −1 Moyenne 0.244444444 −0.177777778 0.422222222 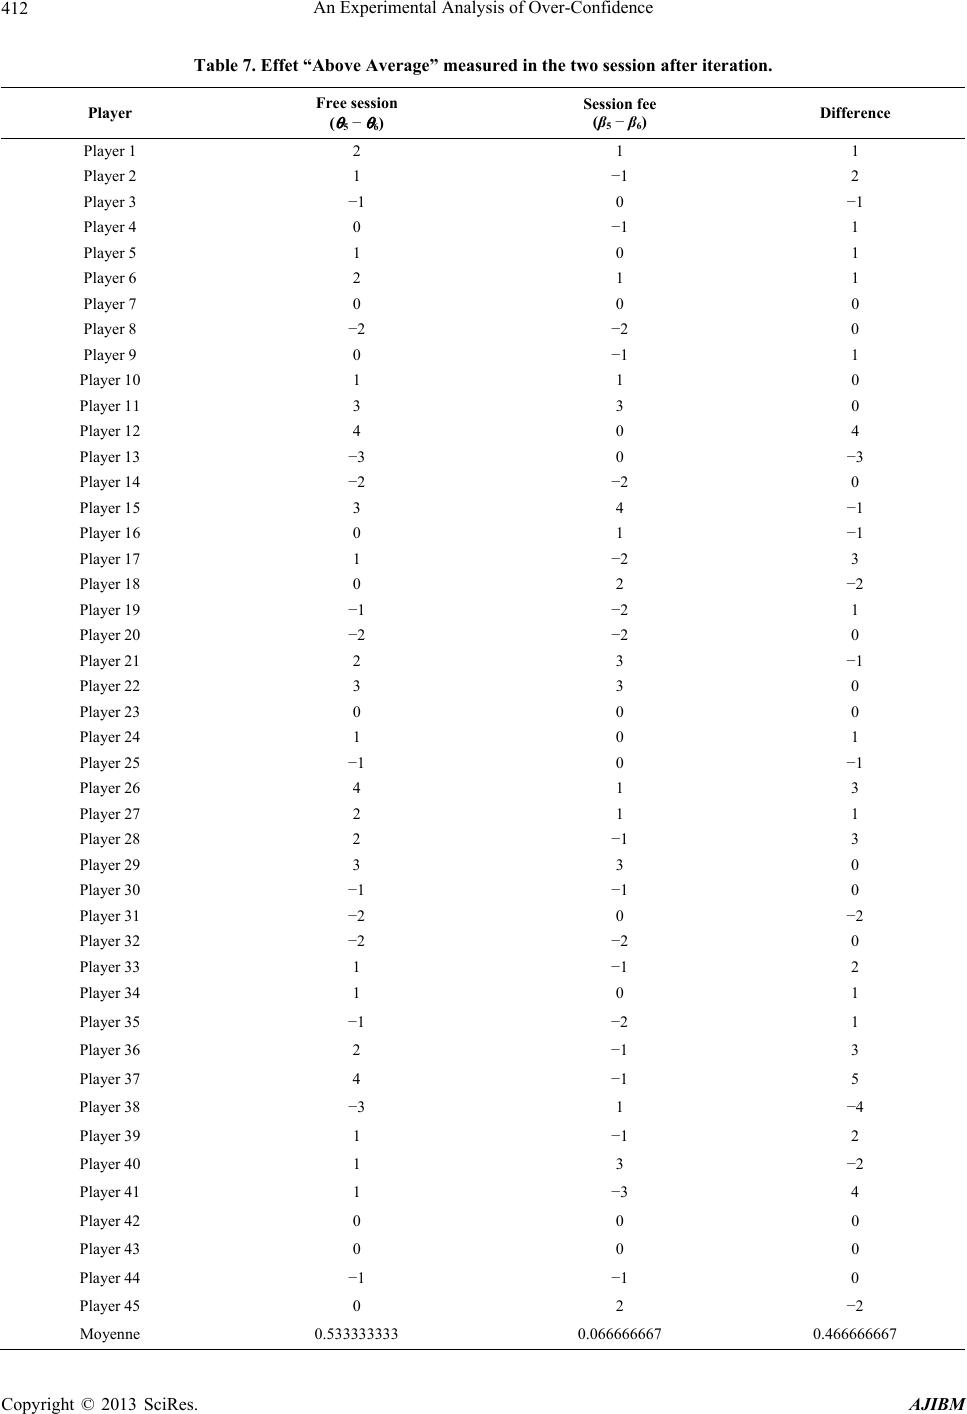 An Experimental Analysis of Over-Confidence Copyright © 2013 SciRes. AJIBM 412 Table 7. Effet “Above Average” measured in the two session after iteration. Player Free session ( θ 5 − θ 6) Session fee (β5 − β6) Difference Player 1 2 1 1 Player 2 1 −1 2 Player 3 −1 0 −1 Player 4 0 −1 1 Player 5 1 0 1 Player 6 2 1 1 Player 7 0 0 0 Player 8 −2 −2 0 Player 9 0 −1 1 Player 10 1 1 0 Player 11 3 3 0 Player 12 4 0 4 Player 13 −3 0 −3 Player 14 −2 −2 0 Player 15 3 4 −1 Player 16 0 1 −1 Player 17 1 −2 3 Player 18 0 2 −2 Player 19 −1 −2 1 Player 20 −2 −2 0 Player 21 2 3 −1 Player 22 3 3 0 Player 23 0 0 0 Player 24 1 0 1 Player 25 −1 0 −1 Player 26 4 1 3 Player 27 2 1 1 Player 28 2 −1 3 Player 29 3 3 0 Player 30 −1 −1 0 Player 31 −2 0 −2 Player 32 −2 −2 0 Player 33 1 −1 2 Player 34 1 0 1 Player 35 −1 −2 1 Player 36 2 −1 3 Player 37 4 −1 5 Player 38 −3 1 −4 Player 39 1 −1 2 Player 40 1 3 −2 Player 41 1 −3 4 Player 42 0 0 0 Player 43 0 0 0 Player 44 −1 −1 0 Player 45 0 2 −2 Moyenne 0.533333333 0.066666667 0.466666667 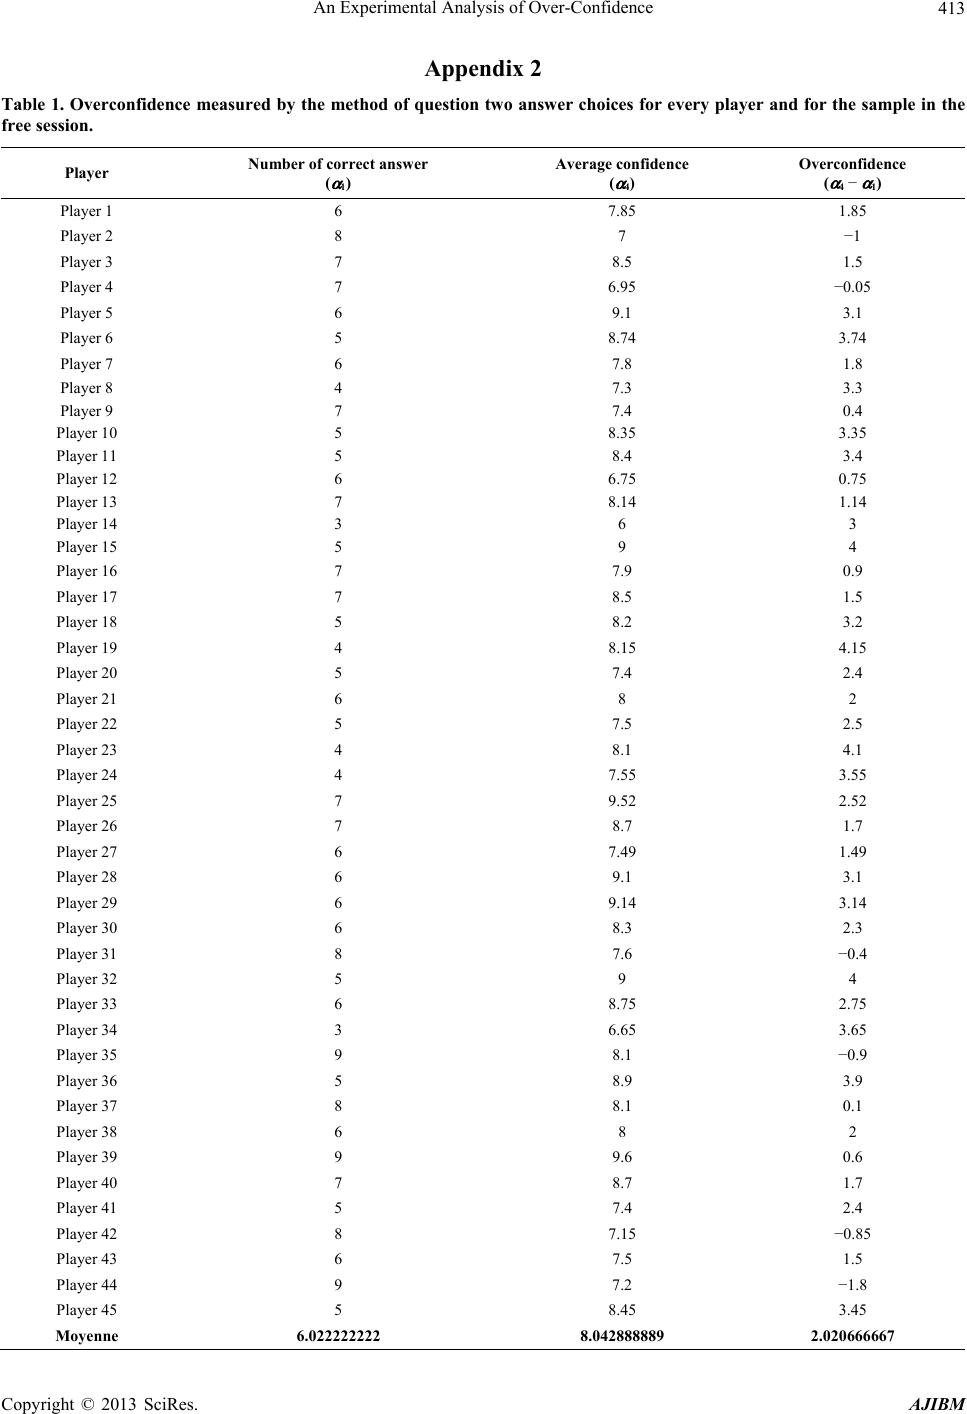 An Experimental Analysis of Over-Confidence Copyright © 2013 SciRes. AJIBM 413 Appendix 2 Table 1. Overconfidence measured by the method of question two answer choices for every player and for the sample in the free session. Player Number of correct answer ( α 1) Average confidence ( α 4) Overconfidence ( α 4 − α 1) Player 1 6 7.85 1.85 Player 2 8 7 −1 Player 3 7 8.5 1.5 Player 4 7 6.95 −0.05 Player 5 6 9.1 3.1 Player 6 5 8.74 3.74 Player 7 6 7.8 1.8 Player 8 4 7.3 3.3 Player 9 7 7.4 0.4 Player 10 5 8.35 3.35 Player 11 5 8.4 3.4 Player 12 6 6.75 0.75 Player 13 7 8.14 1.14 Player 14 3 6 3 Player 15 5 9 4 Player 16 7 7.9 0.9 Player 17 7 8.5 1.5 Player 18 5 8.2 3.2 Player 19 4 8.15 4.15 Player 20 5 7.4 2.4 Player 21 6 8 2 Player 22 5 7.5 2.5 Player 23 4 8.1 4.1 Player 24 4 7.55 3.55 Player 25 7 9.52 2.52 Player 26 7 8.7 1.7 Player 27 6 7.49 1.49 Player 28 6 9.1 3.1 Player 29 6 9.14 3.14 Player 30 6 8.3 2.3 Player 31 8 7.6 −0.4 Player 32 5 9 4 Player 33 6 8.75 2.75 Player 34 3 6.65 3.65 Player 35 9 8.1 −0.9 Player 36 5 8.9 3.9 Player 37 8 8.1 0.1 Player 38 6 8 2 Player 39 9 9.6 0.6 Player 40 7 8.7 1.7 Player 41 5 7.4 2.4 Player 42 8 7.15 −0.85 Player 43 6 7.5 1.5 Player 44 9 7.2 −1.8 Player 45 5 8.45 3.45 Moyenne 6.022222222 8.042888889 2.020666667 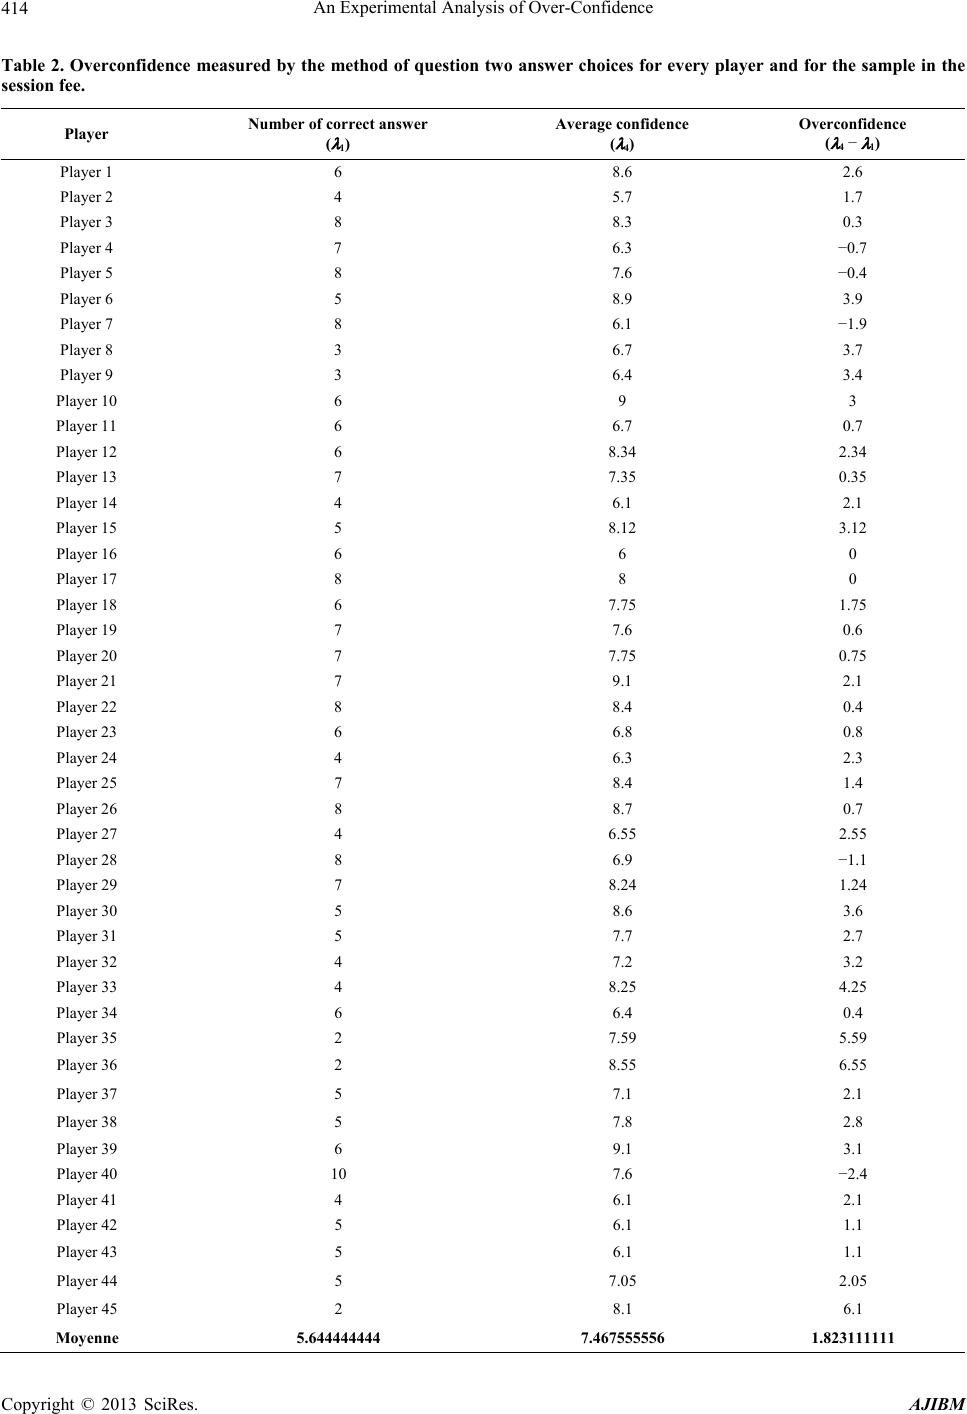 An Experimental Analysis of Over-Confidence Copyright © 2013 SciRes. AJIBM 414 Table 2. Overconfidence measured by the method of question two answer choices for every player and for the sample in the session fee. Player Number of correct answer ( λ 1) Average confidence ( λ 4) Overconfidence ( λ 4 − λ 1) Player 1 6 8.6 2.6 Player 2 4 5.7 1.7 Player 3 8 8.3 0.3 Player 4 7 6.3 −0.7 Player 5 8 7.6 −0.4 Player 6 5 8.9 3.9 Player 7 8 6.1 −1.9 Player 8 3 6.7 3.7 Player 9 3 6.4 3.4 Player 10 6 9 3 Player 11 6 6.7 0.7 Player 12 6 8.34 2.34 Player 13 7 7.35 0.35 Player 14 4 6.1 2.1 Player 15 5 8.12 3.12 Player 16 6 6 0 Player 17 8 8 0 Player 18 6 7.75 1.75 Player 19 7 7.6 0.6 Player 20 7 7.75 0.75 Player 21 7 9.1 2.1 Player 22 8 8.4 0.4 Player 23 6 6.8 0.8 Player 24 4 6.3 2.3 Player 25 7 8.4 1.4 Player 26 8 8.7 0.7 Player 27 4 6.55 2.55 Player 28 8 6.9 −1.1 Player 29 7 8.24 1.24 Player 30 5 8.6 3.6 Player 31 5 7.7 2.7 Player 32 4 7.2 3.2 Player 33 4 8.25 4.25 Player 34 6 6.4 0.4 Player 35 2 7.59 5.59 Player 36 2 8.55 6.55 Player 37 5 7.1 2.1 Player 38 5 7.8 2.8 Player 39 6 9.1 3.1 Player 40 10 7.6 −2.4 Player 41 4 6.1 2.1 Player 42 5 6.1 1.1 Player 43 5 6.1 1.1 Player 44 5 7.05 2.05 Player 45 2 8.1 6.1 Moyenne 5.644444444 7.467555556 1.823111111 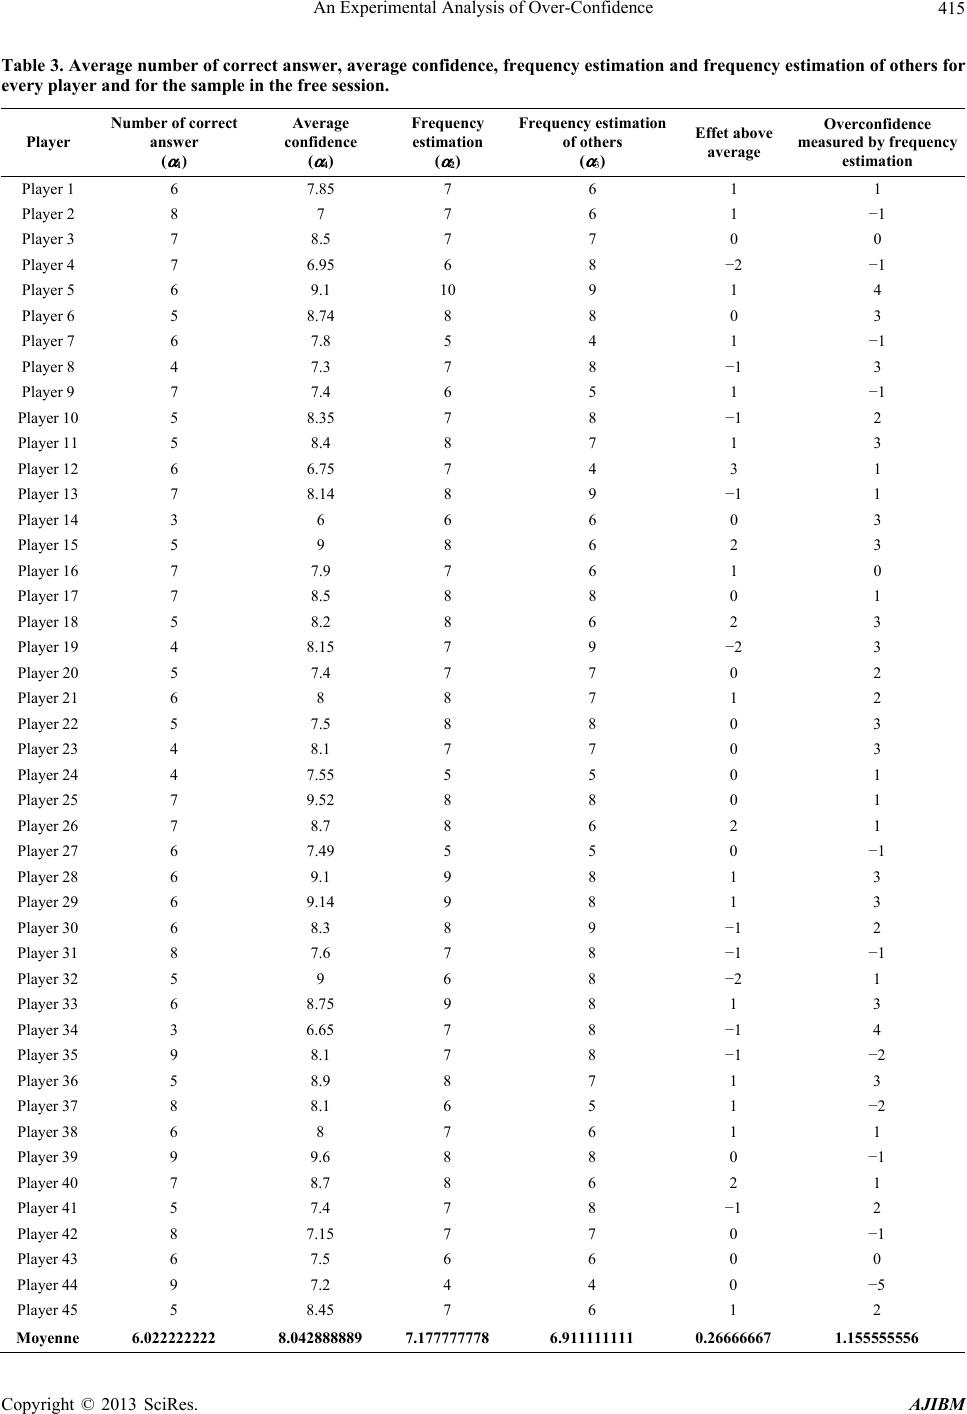 An Experimental Analysis of Over-Confidence Copyright © 2013 SciRes. AJIBM 415 Table 3. Average number of correct answer, average confidence, frequency estimation and frequency estimation of others for every player and for the sample in the free session. Player Number of correct answer ( α 1) Average confidence ( α 4) Frequency estimation ( α 2) Frequency estimation of others ( α 3) Effet above average Overconfidence measured by frequency estimation Player 1 6 7.85 7 6 1 1 Player 2 8 7 7 6 1 −1 Player 3 7 8.5 7 7 0 0 Player 4 7 6.95 6 8 −2 −1 Player 5 6 9.1 10 9 1 4 Player 6 5 8.74 8 8 0 3 Player 7 6 7.8 5 4 1 −1 Player 8 4 7.3 7 8 −1 3 Player 9 7 7.4 6 5 1 −1 Player 10 5 8.35 7 8 −1 2 Player 11 5 8.4 8 7 1 3 Player 12 6 6.75 7 4 3 1 Player 13 7 8.14 8 9 −1 1 Player 14 3 6 6 6 0 3 Player 15 5 9 8 6 2 3 Player 16 7 7.9 7 6 1 0 Player 17 7 8.5 8 8 0 1 Player 18 5 8.2 8 6 2 3 Player 19 4 8.15 7 9 −2 3 Player 20 5 7.4 7 7 0 2 Player 21 6 8 8 7 1 2 Player 22 5 7.5 8 8 0 3 Player 23 4 8.1 7 7 0 3 Player 24 4 7.55 5 5 0 1 Player 25 7 9.52 8 8 0 1 Player 26 7 8.7 8 6 2 1 Player 27 6 7.49 5 5 0 −1 Player 28 6 9.1 9 8 1 3 Player 29 6 9.14 9 8 1 3 Player 30 6 8.3 8 9 −1 2 Player 31 8 7.6 7 8 −1 −1 Player 32 5 9 6 8 −2 1 Player 33 6 8.75 9 8 1 3 Player 34 3 6.65 7 8 −1 4 Player 35 9 8.1 7 8 −1 −2 Player 36 5 8.9 8 7 1 3 Player 37 8 8.1 6 5 1 −2 Player 38 6 8 7 6 1 1 Player 39 9 9.6 8 8 0 −1 Player 40 7 8.7 8 6 2 1 Player 41 5 7.4 7 8 −1 2 Player 42 8 7.15 7 7 0 −1 Player 43 6 7.5 6 6 0 0 Player 44 9 7.2 4 4 0 −5 Player 45 5 8.45 7 6 1 2 Moyenne 6.022222222 8.042888889 7.177777778 6.911111111 0.26666667 1.155555556 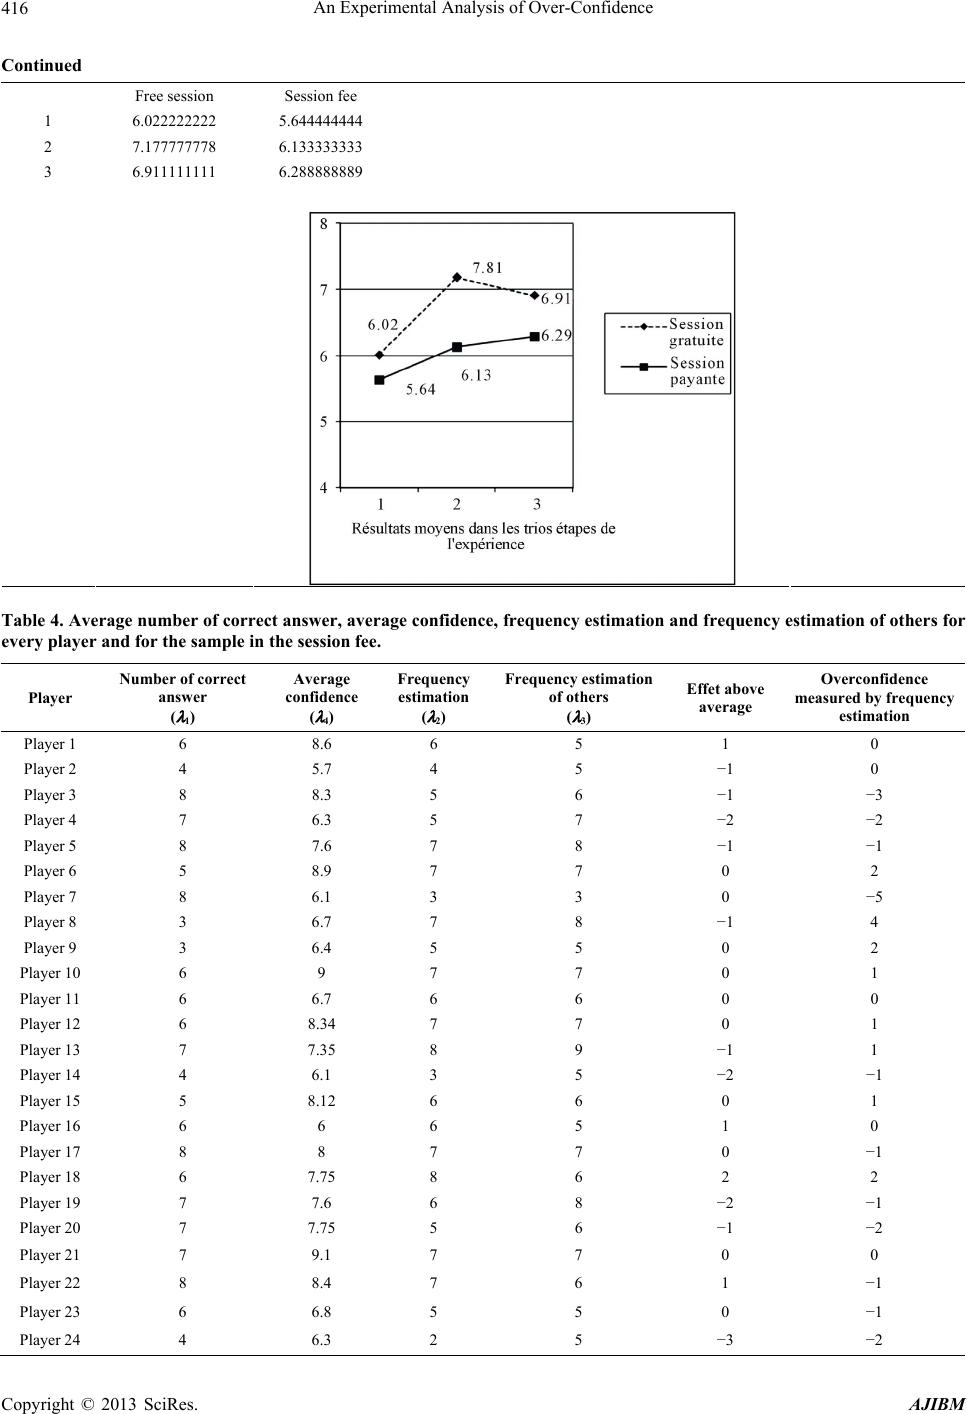 An Experimental Analysis of Over-Confidence Copyright © 2013 SciRes. AJIBM 416 Continued Free session Session fee 1 6.022222222 5.644444444 2 7.177777778 6.133333333 3 6.911111111 6.288888889 Table 4. Average number of correct answer, average confidence, frequency estimation and frequency estimation of others for every player and for the sample in the session fee. Player Number of correct answer ( λ 1) Average confidence ( λ 4) Frequency estimation ( λ 2) Frequency estimation of others ( λ 3) Effet above average Overconfidence measured by frequency estimation Player 1 6 8.6 6 5 1 0 Player 2 4 5.7 4 5 −1 0 Player 3 8 8.3 5 6 −1 −3 Player 4 7 6.3 5 7 −2 −2 Player 5 8 7.6 7 8 −1 −1 Player 6 5 8.9 7 7 0 2 Player 7 8 6.1 3 3 0 −5 Player 8 3 6.7 7 8 −1 4 Player 9 3 6.4 5 5 0 2 Player 10 6 9 7 7 0 1 Player 11 6 6.7 6 6 0 0 Player 12 6 8.34 7 7 0 1 Player 13 7 7.35 8 9 −1 1 Player 14 4 6.1 3 5 −2 −1 Player 15 5 8.12 6 6 0 1 Player 16 6 6 6 5 1 0 Player 17 8 8 7 7 0 −1 Player 18 6 7.75 8 6 2 2 Player 19 7 7.6 6 8 −2 −1 Player 20 7 7.75 5 6 −1 −2 Player 21 7 9.1 7 7 0 0 Player 22 8 8.4 7 6 1 −1 Player 23 6 6.8 5 5 0 −1 Player 24 4 6.3 2 5 −3 −2 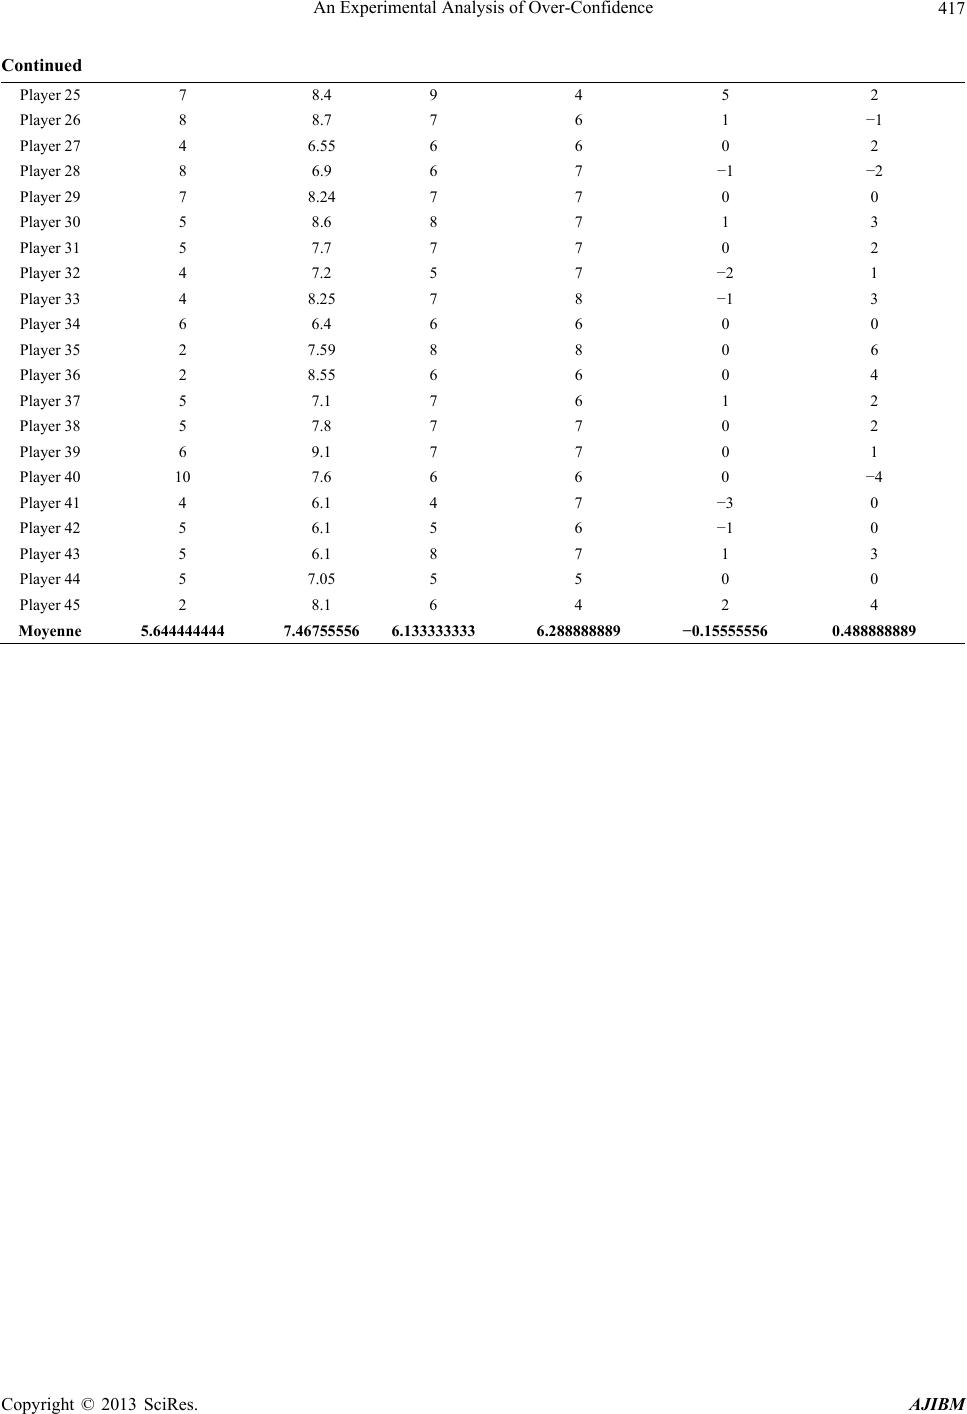 An Experimental Analysis of Over-Confidence Copyright © 2013 SciRes. AJIBM 417 Continued Player 25 7 8.4 9 4 5 2 Player 26 8 8.7 7 6 1 −1 Player 27 4 6.55 6 6 0 2 Player 28 8 6.9 6 7 −1 −2 Player 29 7 8.24 7 7 0 0 Player 30 5 8.6 8 7 1 3 Player 31 5 7.7 7 7 0 2 Player 32 4 7.2 5 7 −2 1 Player 33 4 8.25 7 8 −1 3 Player 34 6 6.4 6 6 0 0 Player 35 2 7.59 8 8 0 6 Player 36 2 8.55 6 6 0 4 Player 37 5 7.1 7 6 1 2 Player 38 5 7.8 7 7 0 2 Player 39 6 9.1 7 7 0 1 Player 40 10 7.6 6 6 0 −4 Player 41 4 6.1 4 7 −3 0 Player 42 5 6.1 5 6 −1 0 Player 43 5 6.1 8 7 1 3 Player 44 5 7.05 5 5 0 0 Player 45 2 8.1 6 4 2 4 Moyenne 5.644444444 7.46755556 6.1333333336.288888889 −0.15555556 0.488888889
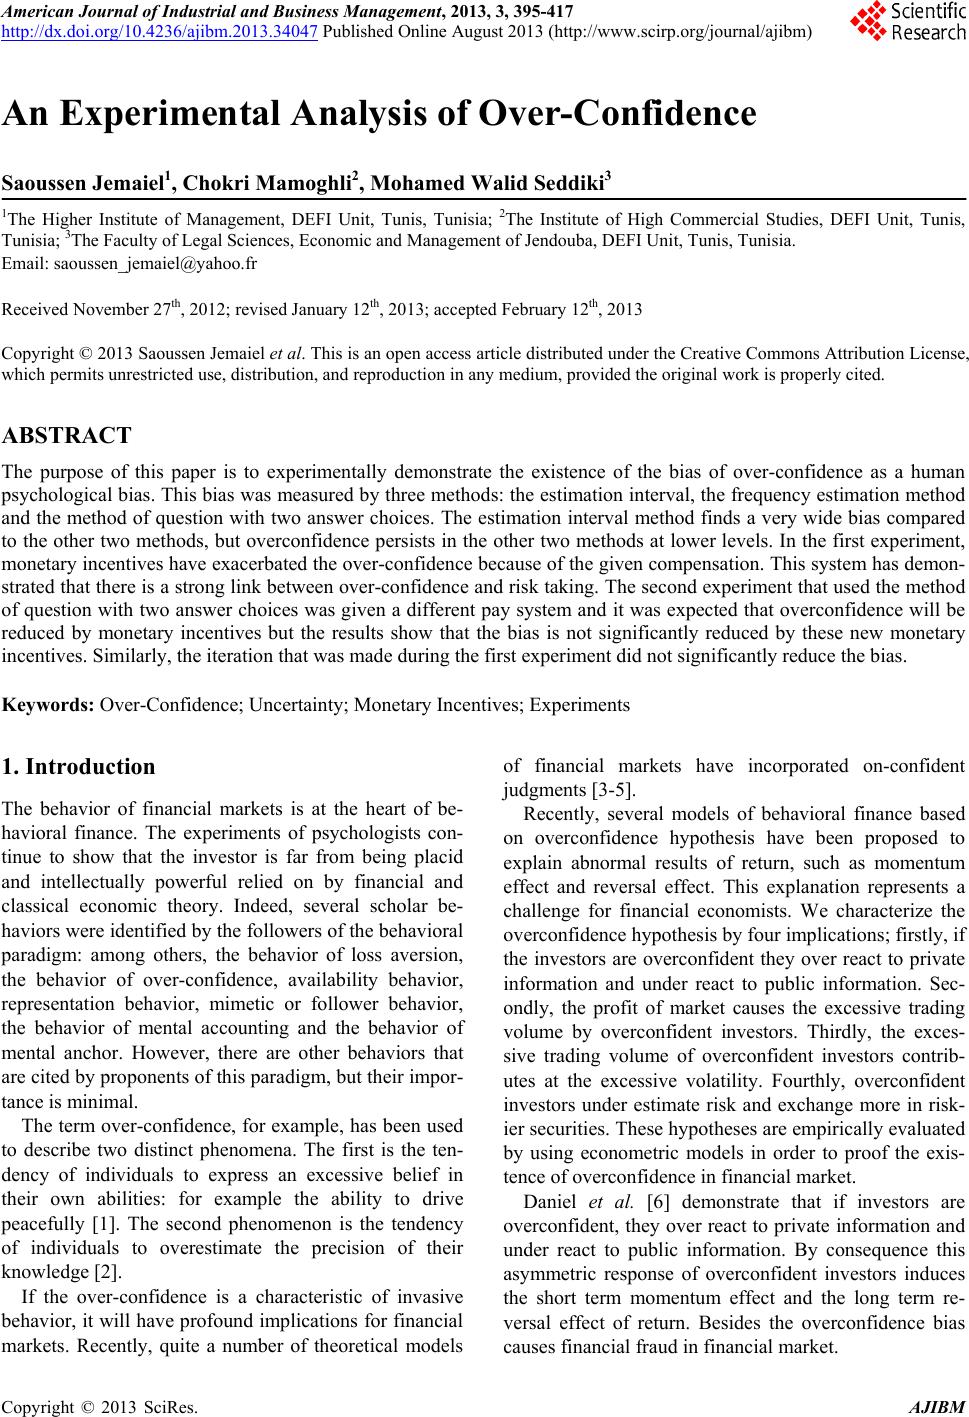
|