 Open Journal of Endocrine and Metabolic Diseases, 2013, 3, 1-8 doi:10.4236/ojemd.2013.34A1001 Published Online August 2013 (http://www.scirp.org/journal/ojemd) Trivalent Chromium Modulates Hexosamine Biosynthesis Pathway Transcriptional Activation of Cholesterol Synthesis and Insulin Resistance Brent A. Penque, Lixuan Tackett, Jeffrey S. Elmendorf Departments of Cellular and Integrative Physiology and Biochemistry and Molecular Biology, Centers for Diabetes Research, and Membrane Biosciences, Indiana University School of Medicine, Indianapolis, USA Email: jelmendo@iupui.edu Received April 23, 2013; revised May 25, 2013; accepted June 26, 2013 Copyright © 2013 Brent A. Penque et al. This is an open access article distributed under the Creative Commons Attribution License, which permits unrestricted use, distribution, and reproduction in any medium, provided the original work is properly cited. ABSTRACT Trivalent chromium has long been recognized to benefit carbohydrate and lipid metabolism. Given emerging evidence that suggests chromium improves insulin sensitivity through the maintenance of an optimal level of plasma membrane (PM) cholesterol, we delineated the role of this micronutrient in attenuating hyperinsulinemia-induced cholesterol bio- synthesis and insulin resistance. Exposing 3T3-L1 adipocytes to physiological hyperinsulinemia (500 pM 12 h), re- sulted in a marked impairment in insulin-stimulated glucose transport. Concurrent treatment with chromium in the pi- colinate form (CrPic, 10 nM 16 h) prevented against glucose transport dysfunction. Insulin signaling was neither im- paired by hyperinsulinemia nor amplified by chromium to promote this protective action. Instead, it was found that hy- perinsulinemia promoted an increase in PM cholesterol content that was observed to impair the acute ability of insulin to stimulate GLUT4 redistribution to the PM. Chromium prevented against the accumulation of PM cholesterol. Mecha- nistically, hyperinsulinemia promoted increases in O-GlcNAc modification of specificity protein 1 (Sp1), known to engage a cholesterolgenic response. Subsequent chromatin immunoprecipitation and luciferase assays revealed that hy- perinsulinemia increased the binding affinity of Sp1 to the promoter region of Hmgcr, encoding 3-hydroxy 3-me- thyl-glutaryl-CoA reductase (HMGR), as well as HMGR promoter activity. This resulted in gains in mRNA and protein content of HMGR, with resulting elevations in PM cholesterol content. Moreover, treatment with chromium prevented this transcriptional response. Together, these data suggest a mechanism whereby CrPic affords glycemic health through inhibition of a transcriptional cholesterolgenic program detrimental to insulin action. Keywords: 3T3-L1 Adipocytes; GLUT4; HMG-CoA Reductase; Hyperinsulinemia; Sp1 1. Introduction Clinical trials have revealed beneficial actions of triva- lent chromium (Cr3+) on glycemic control [1-3], yet a mechanism of action remains unknown. In this regard, data collected in our lab as well as others revealed that Cr3+ exerts its influence on PM parameters [4-6]. Inter- estingly, these studies suggested that regulation of glu- cose transport by Cr3+ may be independent of amplifica- tion of insulin signaling, as previously described [7]. Ra- ther, it was found that Cr3+ normalized elevated PM cho- lesterol levels that impaired glucose transport in 3T3-L1 adipocytes cultured under the diabetic milieu. Exogenous add back of cholesterol, for instance, blunted the effects of Cr3+ observed in these insulin-resistant cells. Despite this association in clonal cells, a basis for alterations in PM cholesterol content in promoting the development of insulin resistance remained unclear. Parallel experiments have since established that nutria- ent overabundance promotes elevations in membrane cho- lesterol content in 3T3-L1 adipocytes and L6 myotubes, as well as in skeletal muscle of C57Bl/6J mice and Zuc- ker rats [8-12]. These membrane perturbations were ob- served concomitant with a loss of cortical filamentous- actin (F-actin) necessary for proper incorporation of the insulin sensitive glucose transporter GLUT4 into the PM. Furthermore, increased membrane cholesterol content was also correlated with diminished glucose disposal rates in humans [10]. Mechanistically, data revealed increased glucose flux through the hexosamine biosynthesis path- way (HBP) promoted elevated O-linked N-acetylgluco- samine (O-GlcNAc) modification of specificity protein 1 (Sp1), leading to transcriptional activation of HMG-CoA Copyright © 2013 SciRes. OJEMD 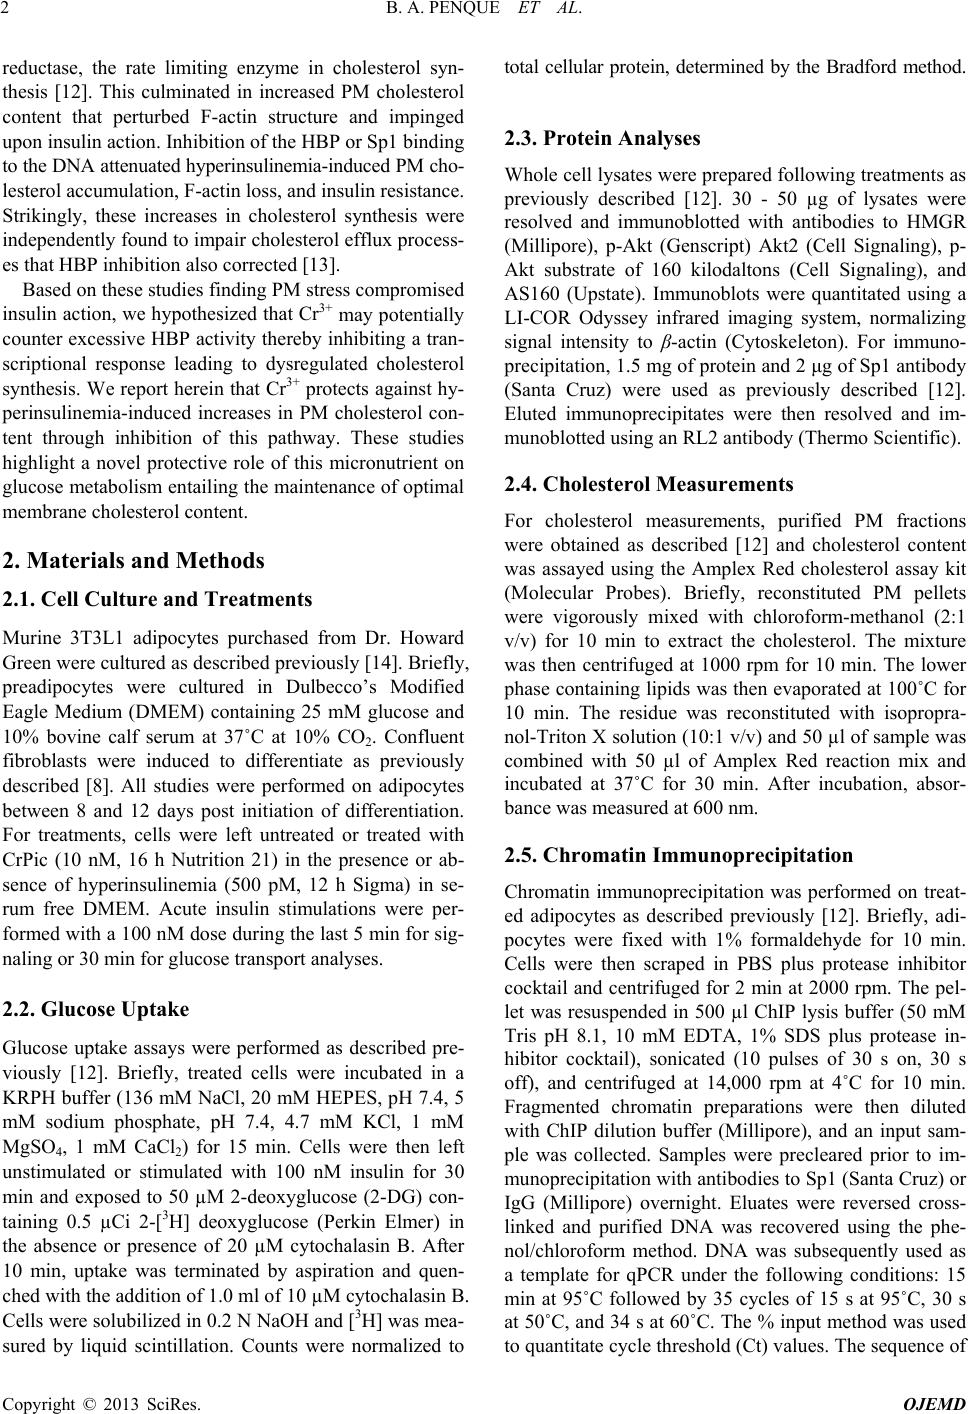 B. A. PENQUE ET AL. 2 reductase, the rate limiting enzyme in cholesterol syn- thesis [12]. This culminated in increased PM cholesterol content that perturbed F-actin structure and impinged upon insulin action. Inhibition of the HBP or Sp1 binding to the DNA attenuated hyperinsulinemia-induced PM cho- lesterol accumulation, F-actin loss, and insulin resistance. Strikingly, these increases in cholesterol synthesis were independently found to impair cholesterol efflux process- es that HBP inhibition also corrected [13]. Based on these studies finding PM stress compromised insulin action, we hypothesized that Cr3+ may potentially counter excessive HBP activity thereby inhibiting a tran- scriptional response leading to dysregulated cholesterol synthesis. We report herein that Cr3+ protects against hy- perinsulinemia-induced increases in PM cholesterol con- tent through inhibition of this pathway. These studies highlight a novel protective role of this micronutrient on glucose metabolism entailing the maintenance of optimal membrane cholesterol content. 2. Materials and Methods 2.1. Cell Culture and Treatments Murine 3T3L1 adipocytes purchased from Dr. Howard Green were cultured as described previously [14]. Briefly, preadipocytes were cultured in Dulbecco’s Modified Eagle Medium (DMEM) containing 25 mM glucose and 10% bovine calf serum at 37˚C at 10% CO2. Confluent fibroblasts were induced to differentiate as previously described [8]. All studies were performed on adipocytes between 8 and 12 days post initiation of differentiation. For treatments, cells were left untreated or treated with CrPic (10 nM, 16 h Nutrition 21) in the presence or ab- sence of hyperinsulinemia (500 pM, 12 h Sigma) in se- rum free DMEM. Acute insulin stimulations were per- formed with a 100 nM dose during the last 5 min for sig- naling or 30 min for glucose transport analyses. 2.2. Glucose Uptake Glucose uptake assays were performed as described pre- viously [12]. Briefly, treated cells were incubated in a KRPH buffer (136 mM NaCl, 20 mM HEPES, pH 7.4, 5 mM sodium phosphate, pH 7.4, 4.7 mM KCl, 1 mM MgSO4, 1 mM CaCl2) for 15 min. Cells were then left unstimulated or stimulated with 100 nM insulin for 30 min and exposed to 50 µM 2-deoxyglucose (2-DG) con- taining 0.5 µCi 2-[3H] deoxyglucose (Perkin Elmer) in the absence or presence of 20 µM cytochalasin B. After 10 min, uptake was terminated by aspiration and quen- ched with the addition of 1.0 ml of 10 µM cytochalasin B. Cells were solubilized in 0.2 N NaOH and [3H] was mea- sured by liquid scintillation. Counts were normalized to total cellular protein, determined by the Bradford method. 2.3. Protein Analyses Whole cell lysates were prepared following treatments as previously described [12]. 30 - 50 µg of lysates were resolved and immunoblotted with antibodies to HMGR (Millipore), p-Akt (Genscript) Akt2 (Cell Signaling), p- Akt substrate of 160 kilodaltons (Cell Signaling), and AS160 (Upstate). Immunoblots were quantitated using a LI-COR Odyssey infrared imaging system, normalizing signal intensity to β-actin (Cytoskeleton). For immuno- precipitation, 1.5 mg of protein and 2 μg of Sp1 antibody (Santa Cruz) were used as previously described [12]. Eluted immunoprecipitates were then resolved and im- munoblotted using an RL2 antibody (Thermo Scientific). 2.4. Cholesterol Measurements For cholesterol measurements, purified PM fractions were obtained as described [12] and cholesterol content was assayed using the Amplex Red cholesterol assay kit (Molecular Probes). Briefly, reconstituted PM pellets were vigorously mixed with chloroform-methanol (2:1 v/v) for 10 min to extract the cholesterol. The mixture was then centrifuged at 1000 rpm for 10 min. The lower phase containing lipids was then evaporated at 100˚C for 10 min. The residue was reconstituted with isopropra- nol-Triton X solution (10:1 v/v) and 50 µl of sample was combined with 50 µl of Amplex Red reaction mix and incubated at 37˚C for 30 min. After incubation, absor- bance was measured at 600 nm. 2.5. Chromatin Immunoprecipitation Chromatin immunoprecipitation was performed on treat- ed adipocytes as described previously [12]. Briefly, adi- pocytes were fixed with 1% formaldehyde for 10 min. Cells were then scraped in PBS plus protease inhibitor cocktail and centrifuged for 2 min at 2000 rpm. The pel- let was resuspended in 500 µl ChIP lysis buffer (50 mM Tris pH 8.1, 10 mM EDTA, 1% SDS plus protease in- hibitor cocktail), sonicated (10 pulses of 30 s on, 30 s off), and centrifuged at 14,000 rpm at 4˚C for 10 min. Fragmented chromatin preparations were then diluted with ChIP dilution buffer (Millipore), and an input sam- ple was collected. Samples were precleared prior to im- munoprecipitation with antibodies to Sp1 (Santa Cruz) or IgG (Millipore) overnight. Eluates were reversed cross- linked and purified DNA was recovered using the phe- nol/chloroform method. DNA was subsequently used as a template for qPCR under the following conditions: 15 min at 95˚C followed by 35 cycles of 15 s at 95˚C, 30 s at 50˚C, and 34 s at 60˚C. The % input method was used to quantitate cycle threshold (Ct) values. The sequence of Copyright © 2013 SciRes. OJEMD 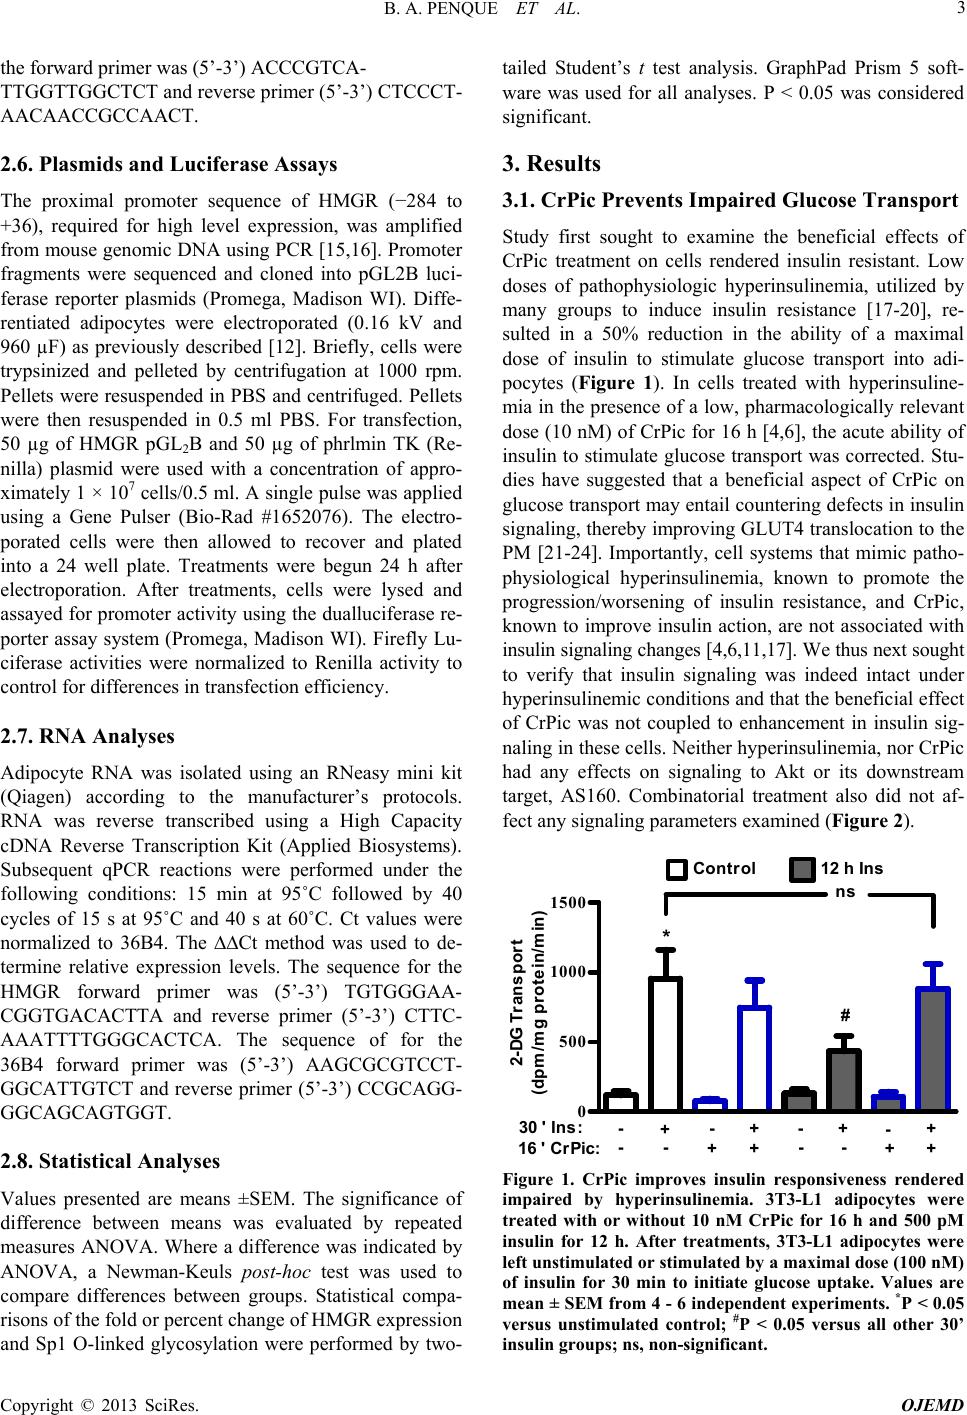 B. A. PENQUE ET AL. 3 the forward primer was (5’-3’) ACCCGTCA- TTGGTTGGCTCT and reverse primer (5’-3’) CTCCCT- AACAACCGCCAACT. 2.6. Plasmids and Luciferase Assays The proximal promoter sequence of HMGR (−284 to +36), required for high level expression, was amplified from mouse genomic DNA using PCR [15,16]. Promoter fragments were sequenced and cloned into pGL2B luci- ferase reporter plasmids (Promega, Madison WI). Diffe- rentiated adipocytes were electroporated (0.16 kV and 960 µF) as previously described [12]. Briefly, cells were trypsinized and pelleted by centrifugation at 1000 rpm. Pellets were resuspended in PBS and centrifuged. Pellets were then resuspended in 0.5 ml PBS. For transfection, 50 µg of HMGR pGL2B and 50 µg of phrlmin TK (Re- nilla) plasmid were used with a concentration of appro- ximately 1 × 10⁷ cells/0.5 ml. A single pulse was applied using a Gene Pulser (Bio-Rad #1652076). The electro- porated cells were then allowed to recover and plated into a 24 well plate. Treatments were begun 24 h after electroporation. After treatments, cells were lysed and assayed for promoter activity using the dualluciferase re- porter assay system (Promega, Madison WI). Firefly Lu- ciferase activities were normalized to Renilla activity to control for differences in transfection efficiency. 2.7. RNA Analyses Adipocyte RNA was isolated using an RNeasy mini kit (Qiagen) according to the manufacturer’s protocols. RNA was reverse transcribed using a High Capacity cDNA Reverse Transcription Kit (Applied Biosystems). Subsequent qPCR reactions were performed under the following conditions: 15 min at 95˚C followed by 40 cycles of 15 s at 95˚C and 40 s at 60˚C. Ct values were normalized to 36B4. The ∆∆Ct method was used to de- termine relative expression levels. The sequence for the HMGR forward primer was (5’-3’) TGTGGGAA- CGGTGACACTTA and reverse primer (5’-3’) CTTC- AAATTTTGGGCACTCA. The sequence of for the 36B4 forward primer was (5’-3’) AAGCGCGTCCT- GGCATTGTCT and reverse primer (5’-3’) CCGCAGG- GGCAGCAGTGGT. 2.8. Statistical Analyses Values presented are means ±SEM. The significance of difference between means was evaluated by repeated measures ANOVA. Where a difference was indicated by ANOVA, a Newman-Keuls post-hoc test was used to compare differences between groups. Statistical compa- risons of the fold or percent change of HMGR expression and Sp1 O-linked glycosylation were performed by two- tailed Student’s t test analysis. GraphPad Prism 5 soft- ware was used for all analyses. P < 0.05 was considered significant. 3. Results 3.1. CrPic Prevents Impaired Glucose Transport Study first sought to examine the beneficial effects of CrPic treatment on cells rendered insulin resistant. Low doses of pathophysiologic hyperinsulinemia, utilized by many groups to induce insulin resistance [17-20], re- sulted in a 50% reduction in the ability of a maximal dose of insulin to stimulate glucose transport into adi- pocytes (Figure 1). In cells treated with hyperinsuline- mia in the presence of a low, pharmacologically relevant dose (10 nM) of CrPic for 16 h [4,6], the acute ability of insulin to stimulate glucose transport was corrected. Stu- dies have suggested that a beneficial aspect of CrPic on glucose transport may entail countering defects in insulin signaling, thereby improving GLUT4 translocation to the PM [21-24]. Importantly, cell systems that mimic patho- physiological hyperinsulinemia, known to promote the progression/worsening of insulin resistance, and CrPic, known to improve insulin action, are not associated with insulin signaling changes [4,6,11,17]. We thus next sought to verify that insulin signaling was indeed intact under hyperinsulinemic conditions and that the beneficial effect of CrPic was not coupled to enhancement in insulin sig- naling in these cells. Neither hyperinsulinemia, nor CrPic had any effects on signaling to Akt or its downstream target, AS160. Combinatorial treatment also did not af- fect any signaling parameters examined (Figure 2). 0 500 1000 1500 2-DG Transport (dpm/mg protein/min) 30 ' Ins:-+-+ -+-+ Control 12 h Ins ns * # 16 ' CrPic:-- -- ++++ Figure 1. CrPic improves insulin responsiveness rendered impaired by hyperinsulinemia. 3T3-L1 adipocytes were treated with or without 10 nM CrPic for 16 h and 500 pM insulin for 12 h. After treatments, 3T3-L1 adipocytes were left unstimulated or stimulated by a maximal dose (100 nM) of insulin for 30 min to initiate glucose uptake. Values are mean ± SEM from 4 - 6 independent experiments. *P < 0.05 versus unstimulated control; #P < 0.05 versus all other 30’ insulin groups; ns, non-significant. Copyright © 2013 SciRes. OJEMD  B. A. PENQUE ET AL. 4 p-Akt2 Akt2 0.0 0.5 1.0 1.5 A. U. Fluorescense p-Akt2 / Akt2 30 ' Ins:-+-+-+-+ 16 ' CrPic:-- -- ++ Control ++ 12 h Ins ns **** (a) B 0.00 0.05 0.10 0.15 0.20 Control 12 h Ins ns **** A. U. Fluorescense p-AS160 / AS160 30 ' Ins:-+-+-+ -+ 16 ' CrPic:--- - ++++ (b) Figure 2. CrPic does not enhance nor does hyperinsuline- mia impair insulin signaling. After treatments, 3T3-L1 adi- pocytes were left unstimulated or stimulated by a maximal dose (100 nM) of insulin for 5 minutes to induce phospho- rylation of insulin signaling proteins. A, Phosphorylation of Akt2 (Ser 474) normalized to total Akt2. B, Phosphoryla- tion of AS160 normalized to total AS160. Values are mean ± SEM from 4 independent experiments. *P < 0.05 versus res- pective unstimulated cells; ns, non-significant. 3.2. CrPic Inhibits PM Cholesterol Accumulation Studies have demonstrated that hyperinsulinemia pro- motes increased PM cholesterol, in turn perturbing corti- cal F-actin necessary for proper GLUT4 incorporation into the PM [8,9]. Ex vivo examination of skeletal muscle from insulin-resistant Zucker rats demonstrated that cor- rection of membrane cholesterol restores actin structure and insulin sensitivity [9]. It was examined whether CrPic treatment had beneficial effects on PM cholesterol levels. PM cholesterol content was elevated by approxi- mately 50% in adipocytes exposed to hyperinsulinemia (Figure 3). Importantly, concurrent treatment with CrPic prevented this gain in cholesterol content. 3.3. CrPic Prevents O-GlcNAcylation of Sp1 Recent findings have established excessive glucose flux 0 100 200 300 CrPic PM Cholesterol (g / mg protein) Control 12 h Ins. CrPic -- * Figure 3. CrPic protects against PM cholesterol accumula- tion induced by hyperinsulinemia. After treatments, 3T3-L1 adipocytes were lysed and fractionated to prepare purified PM fractions. Cholesterol content in PM fractions was as- sessed via Amplex Red, normalized to PM protein content. Values are mean ± SEM from 5 independent experiments. *P < 0.05 versus all other groups. through the HBP in provoking a cholesterolgenic re- sponse through modification of Sp1 [12]. To test whether CrPic could be potentiating HBP activity, thereby reduc- ing a transcriptional response leading to increased PM cholesterol, the glycosylation status of Sp1 was next exa- mined. These analyses revealed both a gain in global O- GlcNAc levels (data not shown) as well as increased O- GlcNAc of Sp1 induced by hyperinsulinemia (Figure 4). While CrPic treatment did not alter HBP activity in con- trol cells, it blunted the effects of hyperinsulinemia in en- gaging the HBP. 3.4. CrPic Attenuates Sp1 Affinity to and Activity of the HMGR Promoter Study next sought to analyze whether CrPic may pro- mote optimal glucose transport by inhibiting a HBP-in- duced cholesterolgenic transcriptional response entailing Sp1. In untreated cells cultured in low or high glucose, a majority of Sp1 is localized to the nucleus [25], although some studies suggest O-GlcNAc mediates its nuclear lo- calization [26,27]. Other data, including our own, suggest that O-GlcNAc modification may serve to increase Sp1 binding to the promoter region of target genes or prevent its degradation [12,28,29]. Chromatin immuno-precipi- tation revealed a significant increase in Sp1 binding affi- nity to the HMGR promoter induced by hyperinsulinemia, whereas treatment with CrPic blunted this association (Figure 5). To discern if CrPic could inhibit activation the promoter, plasmids containing the coding sequence (−284 to +36) of HMGR, including 3 Sp1 binding moi- eties, coupled to luciferase, were electroporated into 3T3- L1 adipocytes (Figure 6(a)). Luciferase activity was ele- vated approximately 2 fold by hyperinsulinemia (Figure 6(b)). Consistent with CrPic inhibiting this response, Copyright © 2013 SciRes. OJEMD 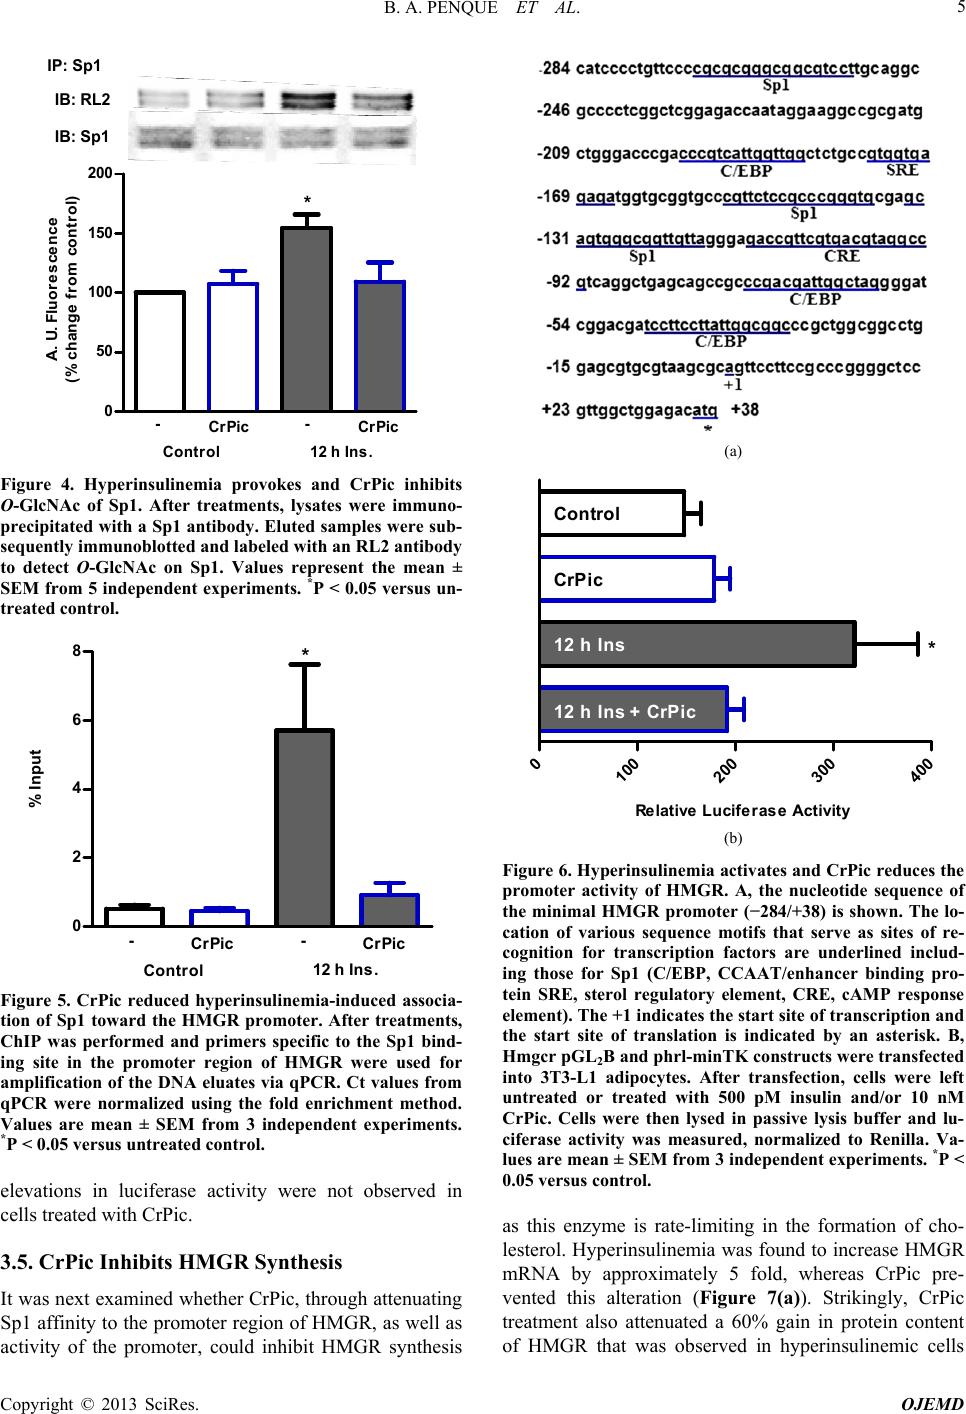 B. A. PENQUE ET AL. 5 0 50 100 150 200 A. U. Fluor e scen ce (% change from control) CrPic Control 12 h Ins. CrPic -- * IB: RL2 IB: S p 1 IP: S p 1 Figure 4. Hyperinsulinemia provokes and CrPic inhibits O-GlcNAc of Sp1. After treatments, lysates were immuno- precipitated with a Sp1 antibody. Eluted samples were sub- sequently immunoblotted and labeled with an RL2 antibody to detect O-GlcNAc on Sp1. Values represent the mean ± SEM from 5 independent experiments. *P < 0.05 versus un- treated control. 0 2 4 6 8 % Input CrPic Control 12 h Ins. CrPic -- * Figure 5. CrPic reduced hyperinsulinemia-induced associa- tion of Sp1 toward the HMGR promoter. After treatments, ChIP was performed and primers specific to the Sp1 bind- ing site in the promoter region of HMGR were used for amplification of the DNA eluates via qPCR. Ct values from qPCR were normalized using the fold enrichment method. Values are mean ± SEM from 3 independent experiments. *P < 0.05 versus untreated control. elevations in luciferase activity were not observed in cells treated with CrPic. 3.5. CrPic Inhibits HMGR Synthesis It was next examined whether CrPic, through attenuating Sp1 affinity to the promoter region of HMGR, as well as (a) 0 100 200 300 400 Relative Luciferase Activity Control CrPic 12 h In s 12 h In s + CrPic * (b) Figure 6. Hyperinsulinemia ates and CrPic reduces the s this enzyme is rate-limiting in the formation of cho- activ promoter activity of HMGR. A, the nucleotide sequence of the minimal HMGR promoter (−284/+38) is shown. The lo- cation of various sequence motifs that serve as sites of re- cognition for transcription factors are underlined includ- ing those for Sp1 (C/EBP, CCAAT/enhancer binding pro- tein SRE, sterol regulatory element, CRE, cAMP response element). The +1 indicates the start site of transcription and the start site of translation is indicated by an asterisk. B, Hmgcr pGL2B and phrl-minTK constructs were transfected into 3T3-L1 adipocytes. After transfection, cells were left untreated or treated with 500 pM insulin and/or 10 nM CrPic. Cells were then lysed in passive lysis buffer and lu- ciferase activity was measured, normalized to Renilla. Va- lues are mean ± SEM from 3 independent experiments. *P < 0.05 versus control. a lesterol. Hyperinsulinemia was found to increase HMGR mRNA by approximately 5 fold, whereas CrPic pre- vented this alteration (Figure 7(a)). Strikingly, CrPic treatment also attenuated a 60% gain in protein content of HMGR that was observed in hyperinsulinemic cells activity of the promoter, could inhibit HMGR synthesis Copyright © 2013 SciRes. OJEMD 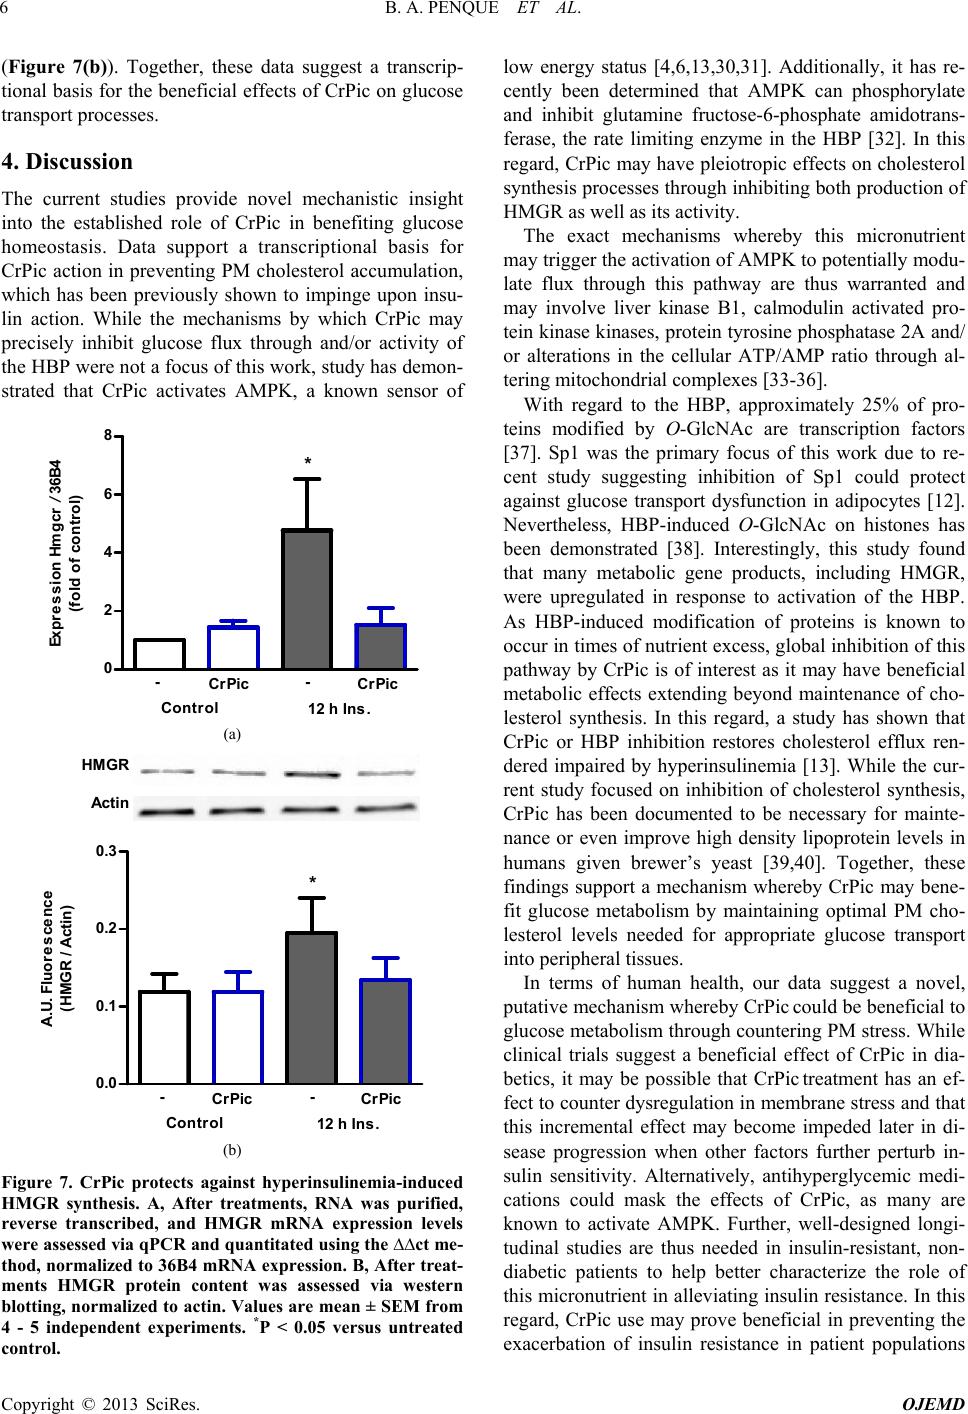 B. A. PENQUE ET AL. 6 (Figure 7(b)). Together, these data suggest a transcrip- tional basis for the beneficial effects of CrPic on glucose transport processes. 4. Discussion ies provide novel mechanistic insight The current stud into the established role of CrPic in benefiting glucose homeostasis. Data support a transcriptional basis for CrPic action in preventing PM cholesterol accumulation, which has been previously shown to impinge upon insu- lin action. While the mechanisms by which CrPic may precisely inhibit glucose flux through and/or activity of the HBP were not a focus of this work, study has demon- strated that CrPic activates AMPK, a known sensor of 0 2 4 6 8 Expression Hmgcr /36B4 (fold of control) CrPic Control 12 h Ins. CrPic -- * (a) 0.0 0.1 0.2 0.3 A.U. Fluorescence (HMG R / Actin) CrPic Control 12 h Ins. CrPic -- * HMG R Ac t in (b) Figure 7. CrPic protects agt hyperinsulinemia-induced ains HMGR synthesis. A, After treatments, RNA was purified, reverse transcribed, and HMGR mRNA expression levels were assessed via qPCR and quantitated using the ∆∆ct me- thod, normalized to 36B4 mRNA expression. B, After treat- ments HMGR protein content was assessed via western blotting, normalized to actin. Values are mean ± SEM from 4 - 5 independent experiments. *P < 0.05 versus untreated control. low energy status [4,6,13,30,31]. Additionally, it has re- cently been determined that AMPK can phosphorylate and inhibit glutamine fructose-6-phosphate amidotrans- ferase, the rate limiting enzyme in the HBP [32]. In this regard, CrPic may have pleiotropic effects on cholesterol synthesis processes through inhibiting both production of HMGR as well as its activity. The exact mechanisms whereby this micronutrient may trigger the activation of AMPK to potentially modu- late flux through this pathway are thus warranted and may involve liver kinase B1, calmodulin activated pro- tein kinase kinases, protein tyrosine phosphatase 2A and/ or alterations in the cellular ATP/AMP ratio through al- tering mitochondrial complexes [33-36]. With regard to the HBP, approximately 25% of pro- teins modified by O-GlcNAc are transcription factors [37]. Sp1 was the primary focus of this work due to re- cent study suggesting inhibition of Sp1 could protect against glucose transport dysfunction in adipocytes [12]. Nevertheless, HBP-induced O-GlcNAc on histones has been demonstrated [38]. Interestingly, this study found that many metabolic gene products, including HMGR, were upregulated in response to activation of the HBP. As HBP-induced modification of proteins is known to occur in times of nutrient excess, global inhibition of this pathway by CrPic is of interest as it may have beneficial metabolic effects extending beyond maintenance of cho- lesterol synthesis. In this regard, a study has shown that CrPic or HBP inhibition restores cholesterol efflux ren- dered impaired by hyperinsulinemia [13]. While the cur- rent study focused on inhibition of cholesterol synthesis, CrPic has been documented to be necessary for mainte- nance or even improve high density lipoprotein levels in humans given brewer’s yeast [39,40]. Together, these findings support a mechanism whereby CrPic may bene- fit glucose metabolism by maintaining optimal PM cho- lesterol levels needed for appropriate glucose transport into peripheral tissues. In terms of human health, our data suggest a novel, putative mechanism whereby CrPiccould be beneficial to glucose metabolism through countering PM stress. While clinical trials suggest a beneficial effect of CrPic in dia- betics, it may be possible that CrPic treatment has an ef- fect to counter dysregulation in membrane stress and that this incremental effect may become impeded later in di- sease progression when other factors further perturb in- sulin sensitivity. Alternatively, antihyperglycemic medi- cations could mask the effects of CrPic, as many are known to activate AMPK. Further, well-designed longi- tudinal studies are thus needed in insulin-resistant, non- diabetic patients to help better characterize the role of this micronutrient in alleviating insulin resistance. In this regard, CrPic use may prove beneficial in preventing the exacerbation of insulin resistance in patient populations Copyright © 2013 SciRes. OJEMD 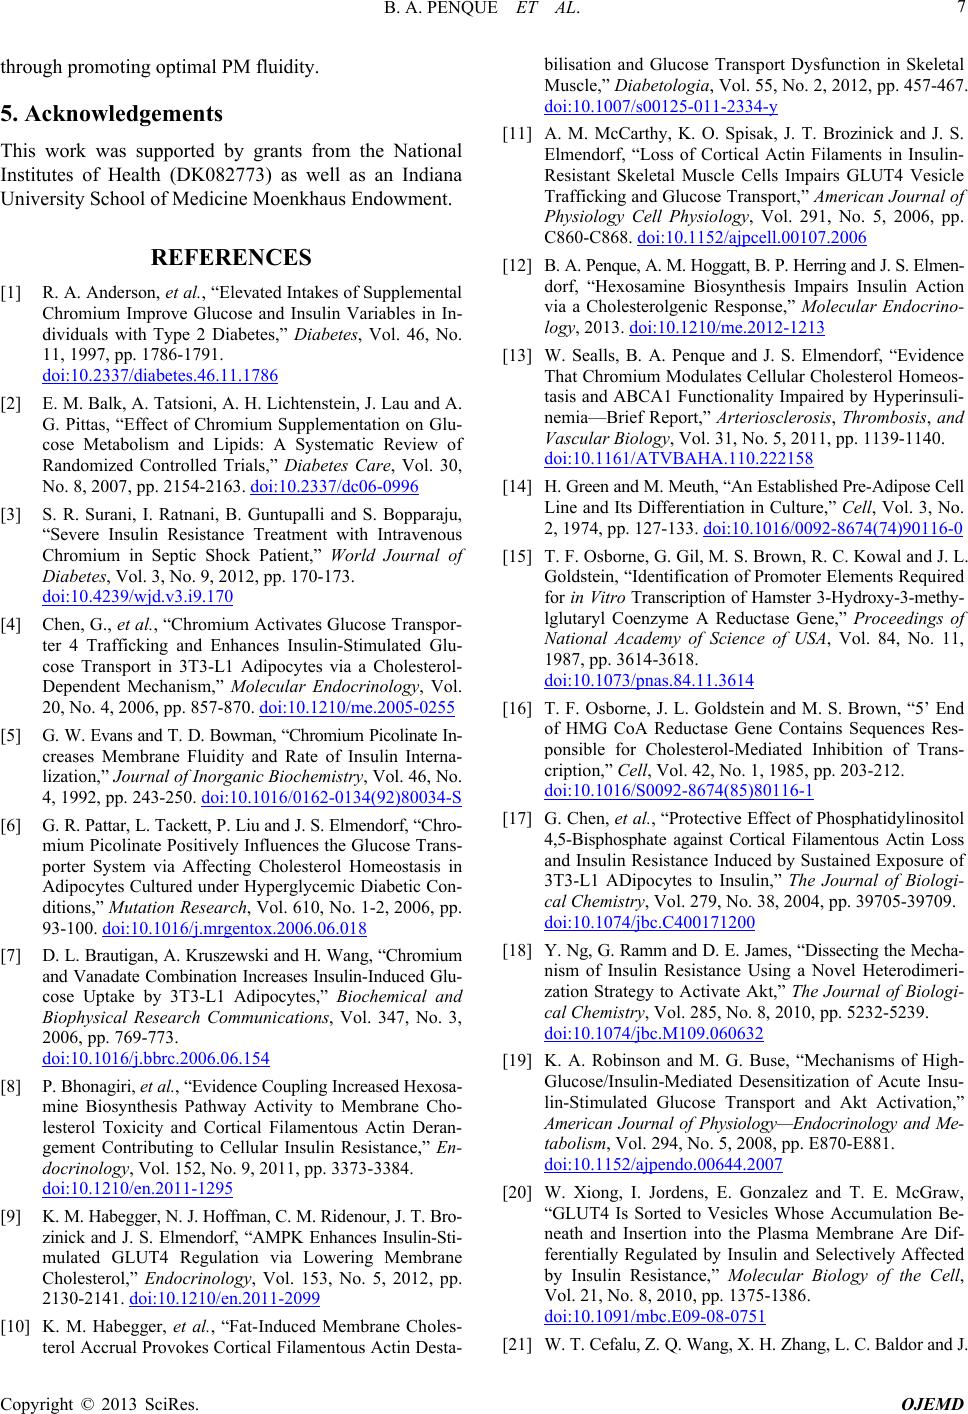 B. A. PENQUE ET AL. 7 through promoting optimal PM fluidity. 5. Acknowledgements This work was supported b Institutes of Health (DK082 y grants from the National 773) as well as an In [1] R. A. Andersoes of Supplemental Chromium Imlin Variables in In diana University School of Medicine Moenkhaus Endowment. REFERENCES n, et al., “Elevated Intak prove Glucose and Insu- dividuals with Type 2 Diabetes,” Diabetes, Vol. 46, No. 11, 1997, pp. 1786-1791. doi:10.2337/diabetes.46.11.1786 [2] E. M. Balk, A. Tatsioni, A. H G. Pittas, “Effect of Chromium S . Lichtenstein, J. Lau and upplementation on Glu- A. cose Metabolism and Lipids: A Systematic Review of Randomized Controlled Trials,” Diabetes Care, Vol. 30, No. 8, 2007, pp. 2154-2163. doi:10.2337/dc06-0996 [3] S. R. Surani, I. Ratnani, B. Guntupalli and S. Bopparaju, “Severe Insulin Resistance Treatment with Intravenous Chromium in Septic Shock Patient,” World Journal of Diabetes, Vol. 3, No. 9, 2012, pp. 170-173. doi:10.4239/wjd.v3.i9.170 [4] Chen, G., et al., “Chromium Activates Gluco ter 4 Trafficking and Enha se Transpor- nces Insulin-Stimulated Glu- cose Transport in 3T3-L1 Adipocytes via a Cholesterol- Dependent Mechanism,” Molecular Endocrinology, Vol. 20, No. 4, 2006, pp. 857-870. doi:10.1210/me.2005-0255 [5] G. W. Evans and T. D. Bowman, “Chromium Picolinate In- creases Membrane Fluidity and Rate of Insulin Interna- lization,” Journal of Inorganic Biochemistry, Vol. 46, No. 4, 1992, pp. 243-250. doi:10.1016/0162-0134(92)80034-S [6] G. R. Pattar, L. Tackett, P. Liu and J. S. Elmendorf, “Chro- mium Picolinate Positively Influences the Glucose Trans- porter System via Affecting Cholesterol Homeostasis in Adipocytes Cultured under Hyperglycemic Diabetic Con- ditions,” Mutation Research, Vol. 610, No. 1-2, 2006, pp. 93-100. doi:10.1016/j.mrgentox.2006.06.018 [7] D. L. Brautigan, A. Kruszewski and H. Wang, “Chromium and Vanadate Combination Increases Insulin-Induced Glu- cose Uptake by 3T3-L1 Adipocytes,” Biochemical and Biophysical Research Communications, Vol. 347, No. 3, 2006, pp. 769-773. doi:10.1016/j.bbrc.2006.06.154 [8] P. Bhonagiri, et al., “E mine Biosynthesis Pathway Activity vidence Coupling Increased Hexosa- to Membrane Cho- lesterol Toxicity and Cortical Filamentous Actin Deran- gement Contributing to Cellular Insulin Resistance,” En- docrinology, Vol. 152, No. 9, 2011, pp. 3373-3384. doi:10.1210/en.2011-1295 [9] K. M. Habegger, N. J. Hoffman, C. M. Ridenour, J. T. B zinick and J. S. Elmendorf, ro- -“AMPK Enhances Insulin Sti- mulated GLUT4 Regulation via Lowering Membrane Cholesterol,” Endocrinology, Vol. 153, No. 5, 2012, pp. 2130-2141. doi:10.1210/en.2011-2099 [10] K. M. Habegger, et al., “Fat-Induced Membrane Choles- terol Accrual Provokes Cortical Filamentous Actin Desta- bilisation and Glucose Transport Dysfunction in Skeletal Muscle,” Diabetologia, Vol. 55, No. 2, 2012, pp. 457-467. doi:10.1007/s00125-011-2334-y [11] A. M. McCarthy, K. O. Spisak, J. T. Brozinick and J. S. Elmendorf, “Loss of Cortical Actin Filaments in Insulin- Resistant Skeletal Muscle Cells Impairs GLUT4 Vesicle Trafficking and Glucose Transport,” American Journal of Physiology Cell Physiology, Vol. 291, No. 5, 2006, pp. C860-C868. doi:10.1152/ajpcell.00107.2006 [12] B. A. Penque, A. M. Hoggatt, B. P. Herring and J. S. Elmen- dorf, “Hexosamine Biosynthesis Impairs Insulin Action via a Cholesterolgenic Response,” Molecular Endocrino- logy, 2013. doi:10.1210/me.2012-1213 [13] W. Sealls, B. A. Penque and J. S. Elmendorf, “Evidence That Chromium Modulates Cellular Cholesterol Homeos- tasis and ABCA1 Functionality Impaired by Hyperinsuli- nemia—Brief Report,” Arteriosclerosis, Thrombosis, and Vascular Biology, Vol. 31, No. 5, 2011, pp. 1139-1140. doi:10.1161/ATVBAHA.110.222158 [14] H. Green and M. Meuth, “An Established Pre-Adipose Cell Line and Its Differentiation in Culture ,” Cell, Vol. 3, No. 2, 1974, pp. 127-133. doi:10.1016/0092-8674(74)90116-0 [15] T. F. Osborne, G. Gil, M. S. Brown, R. C. Kowal and J. L. Goldstein, “Identification of Promoter Elements Required for in Vitro Transcription of Hamster 3-Hydroxy-3-methy- lglutaryl Coenzyme A Reductase Gene,” Proceedings of National Academy of Science of USA, Vol. 84, No. 11, 1987, pp. 3614-3618. doi:10.1073/pnas.84.11.3614 [16] T. F. Osborne, J. L. Goldstein of HMG CoA Reductase Gen and M. S. Brown, “5’ End e Contains Sequences Res- ponsible for Cholesterol-Mediated Inhibition of Trans- cription,” Cell, Vol. 42, No. 1, 1985, pp. 203-212. doi:10.1016/S0092-8674(85)80116-1 [17] G. Chen, et al., “Protective Effect of Phosphatidylin 4,5-Bisphosphate against Cortical Filam ositol entous Actin Loss and Insulin Resistance Induced by Sustained Exposure of 3T3-L1 ADipocytes to Insulin,” The Journal of Biologi- cal Chemistry, Vol. 279, No. 38, 2004, pp. 39705-39709. doi:10.1074/jbc.C400171200 [18] Y. Ng, G. Ramm and D. E. James, “Dissecting the Mecha- nism of Insulin Resistance Using a Novel Heterodimeri- zation Strategy to Activate Akt,” The Journal of Biologi- cal Chemistry, Vol. 285, No. 8, 2010, pp. 5232-5239. doi:10.1074/jbc.M109.060632 [19] K. A. Robinson and M. G. Buse, “Mechanisms of Hig Glucose/Insulin-Mediated Dese h- nsitization of Acute Insu- lin-Stimulated Glucose Transport and Akt Activation,” American Journal of Physiology—Endocrinology and Me- tabolism, Vol. 294, No. 5, 2008, pp. E870-E881. doi:10.1152/ajpendo.00644.2007 [20] W. Xiong, I. Jordens, E. Gonzalez and T. E. M “GLUT4 Is Sorted to Vesicles W cGraw, hose Accumulation Be- neath and Insertion into the Plasma Membrane Are Dif- ferentially Regulated by Insulin and Selectively Affected by Insulin Resistance,” Molecular Biology of the Cell, Vol. 21, No. 8, 2010, pp. 1375-1386. doi:10.1091/mbc.E09-08-0751 [21] W. T. Cefalu, Z. Q. Wang, X. H. Zhang, L. C. Baldor and J. Copyright © 2013 SciRes. OJEMD 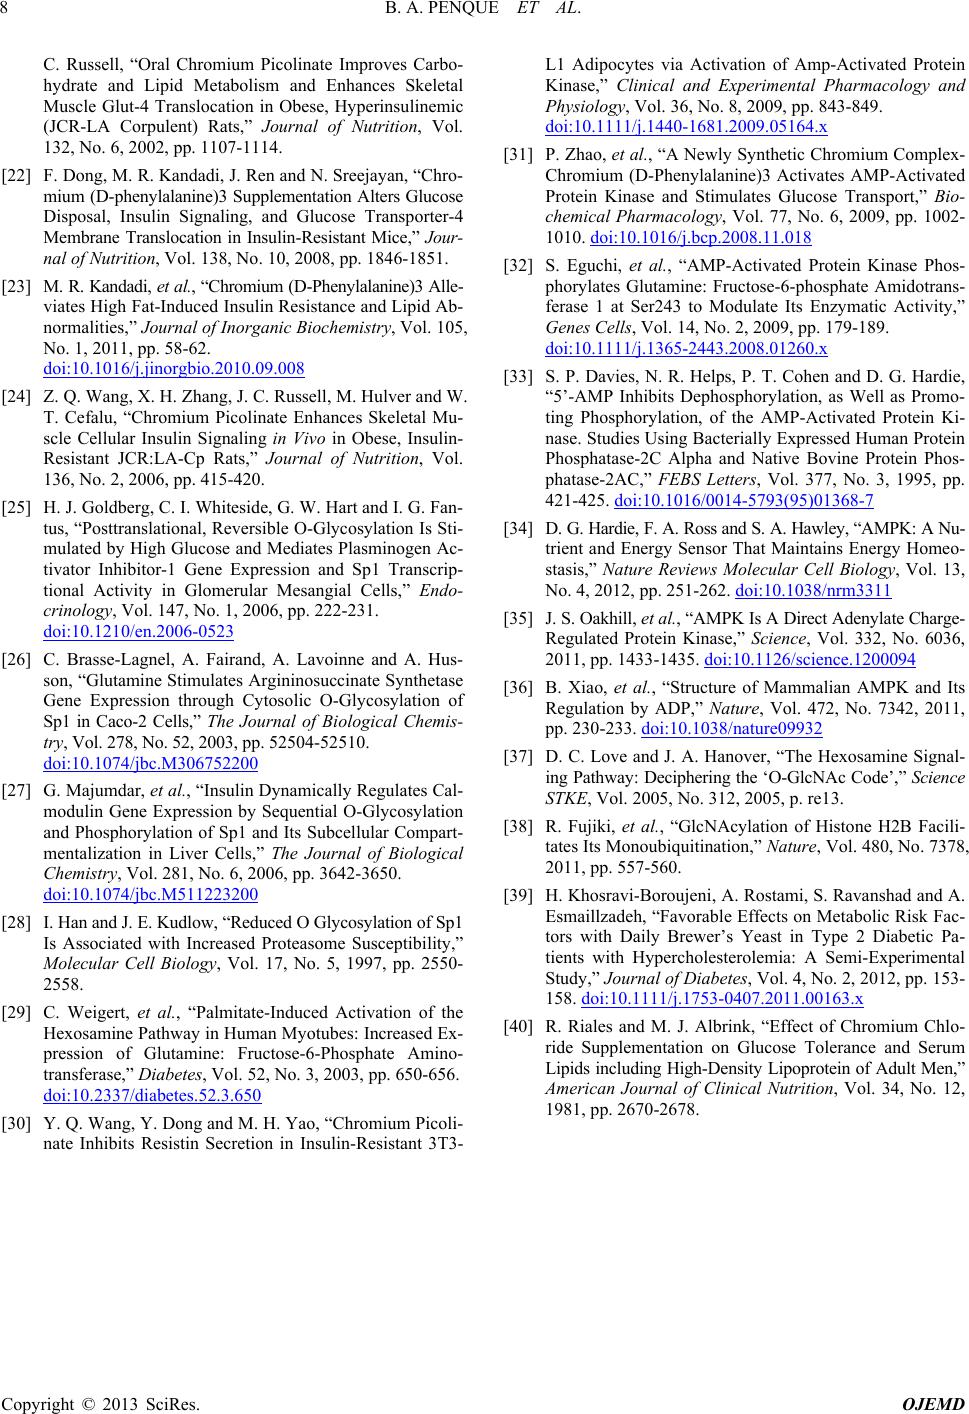 B. A. PENQUE ET AL. Copyright © 2013 SciRes. OJEMD 8 colinate Improves Carbo- entation Alters Glucose - C. Russell, “Oral Chromium Pi hydrate and Lipid Metabolism and Enhances Skeletal Muscle Glut-4 Translocation in Obese, Hyperinsulinemic (JCR-LA Corpulent) Rats,” Journal of Nutrition, Vol. 132, No. 6, 2002, pp. 1107-1114. [22] F. Dong, M. R. Kandadi, J. Ren and N. Sreejayan, “Chro- mium (D-phenylalanine)3 Supplem Disposal, Insulin Signaling, and Glucose Transporter-4 Membrane Translocation in Insulin-Resistant Mice,” Jour- nal of Nutrition, Vol. 138, No. 10, 2008, pp. 1846-1851. [23] M. R. Kandadi, et al., “Chromium (D-Phenylalanine)3 Alle- viates High Fat-Induced Insulin Resistance and Lipid Ab normalities,” Journal of Inorganic Biochemistry, Vol. 105, No. 1, 2011, pp. 58-62. doi:10.1016/j.jinorgbio.2010.09.008 [24] Z. Q. Wang, X. H. Zhang, T. Cefalu, “Chromium Picolinate En J. C. Russell, M. Hulver a hances Skeletal Mu- le O-Glycosylation Is Sti- nd W. scle Cellular Insulin Signaling in Vivo in Obese, Insulin- Resistant JCR:LA-Cp Rats,” Journal of Nutrition, Vol. 136, No. 2, 2006, pp. 415-420. [25] H. J. Goldberg, C. I. Whiteside, G. W. Hart and I. G. Fan- tus, “Posttranslational, Reversib mulated by High Glucose and Mediates Plasminogen Ac- tivator Inhibitor-1 Gene Expression and Sp1 Transcrip- tional Activity in Glomerular Mesangial Cells,” Endo- crinology, Vol. 147, No. 1, 2006, pp. 222-231. doi:10.1210/en.2006-0523 [26] C. Brasse-Lagnel, A. Fairand, A. Lavoinne and son, “Glutamine Stimulates A. Hus- Argininosuccinate Synthetase Gene Expression through Cytosolic O-Glycosylation of Sp1 in Caco-2 Cells,” The Journal of Biological Chemis- try, Vol. 278, No. 52, 2003, pp. 52504-52510. doi:10.1074/jbc.M306752200 [27] G. Majumdar, et al., “Insulin Dynamically Regu modulin Gene Expression by Sequential O-Gly late cosylation s Cal- and Phosphorylation of Sp1 and Its Subcellular Compart- mentalization in Liver Cells,” The Journal of Biological Chemistry, Vol. 281, No. 6, 2006, pp. 3642-3650. doi:10.1074/jbc.M511223200 [28] I. Han and J. E. Kudlow, “Reduced O Glycosylation o Is Associated with Increased P f Sp1 roteasome Susceptibility,” ine Pathway in Human Myotubes: Increased Ex- Molecular Cell Biology, Vol. 17, No. 5, 1997, pp. 2550- 2558. [29] C. Weigert, et al., “Palmitate-Induced Activation of the Hexosam pression of Glutamine: Fructose-6-Phosphate Amino- transferase,” Diabetes, Vol. 52, No. 3, 2003, pp. 650-656. doi:10.2337/diabetes.52.3.650 [30] Y. Q. Wang, Y. Dong and M. H. Yao, “Chromium Picoli- nate Inhibits Resistin Secretion in Insulin-Resistant 3T3- L1 Adipocytes via Activation of Amp-Activated Protein Kinase,” Clinical and Experimental Pharmacology and Physiology, Vol. 36, No. 8, 2009, pp. 843-849. doi:10.1111/j.1440-1681.2009.05164.x [31] P. Zhao, et al., “A Newly Synthetic Chromium Complex- Chromium (D-Phenylalanine)3 Activates AMP-Activated Protein Kinase and Stimulates Glucose Transport,” Bio- chemical Pharmacology, Vol. 77, No. 6, 2009, pp. 1002- 1010. doi:10.1016/j.bcp.2008.11.018 [32] S. Eguchi, et al., “AMP-Activated Protein Kinase Phos- phorylates Glutamine: Fructose-6-phosphate Amidotrans- ferase 1 at Ser243 to Modulate Its Enzymatic Activity,” Genes Cells, Vol. 14, No. 2, 2009, pp. 179-189. doi:10.1111/j.1365-2443.2008.01260.x [33] S. P. Davies, N. R. Helps, P. T. Cohen and D. G. Hardie, “5’-AMP Inhibits Dephosphorylation, as Well as Promo- ting Phosphorylation, of the AMP-Activated Protein Ki- nase. Studies Using Bacterially Expressed Human Protein Phosphatase-2C Alpha and Native Bovine Protein Phos- phatase-2AC,” FEBS Letters, Vol. 377, No. 3, 1995, pp. 421-425. doi:10.1016/0014-5793(95)01368-7 [34] D. G. Hardie, F. A. Ross and S. A. Hawley, “AMPK: A Nu- trient and Energy Sensor That Maintains Energy Homeo- stasis,” Nature Reviews Molecular Cell Biology, Vol. 13, No. 4, 2012, pp. 251-262. doi:10.1038/nrm3311 [35] J. S. Oakhill, et al., “AMPK Is A Direct Adenylate Charge- Regulated Protein Kinase,” Science, Vol. 332, No. 6036, 2011, pp. 1433-1435. doi:10.1126/science.1200094 [36] B. Xiao, et al., “Structure of Mammalian AMPK and Its Regulation by ADP,” Nature, Vol. 472, No. 7342, 2011, pp. 230-233. doi:10.1038/nature09932 [37] D. C. Love and J. A. Hanover, “The Hexosamine Signal- ne H2B Facili- ni, A. Rostami, S. Ravanshad and A. ing Pathway: Deciphering the ‘O-GlcNAc Code’,” Science STKE, Vol. 2005, No. 312, 2005, p. re13. [38] R. Fujiki, et al., “GlcNAcylation of Histo tates Its Monoubiquitination,” Nature, Vol. 480, No. 7378, 2011, pp. 557-560. [39] H. Khosravi-Borouje Esmaillzadeh, “Favorable Effects on Metabolic Risk Fac- tors with Daily Brewer’s Yeast in Type 2 Diabetic Pa- tients with Hypercholesterolemia: A Semi-Experimental Study,” Journal of Diabetes, Vol. 4, No. 2, 2012, pp. 153- 158. doi:10.1111/j.1753-0407.2011.00163.x [40] R. Riales and M. J. Albrink, “Effect of Chromium Chlo- ride Supplementation on Glucose Tolerance and Serum Lipids including High-Density Lipoprotein of Adult Men,” American Journal of Clinical Nutrition, Vol. 34, No. 12, 1981, pp. 2670-2678.
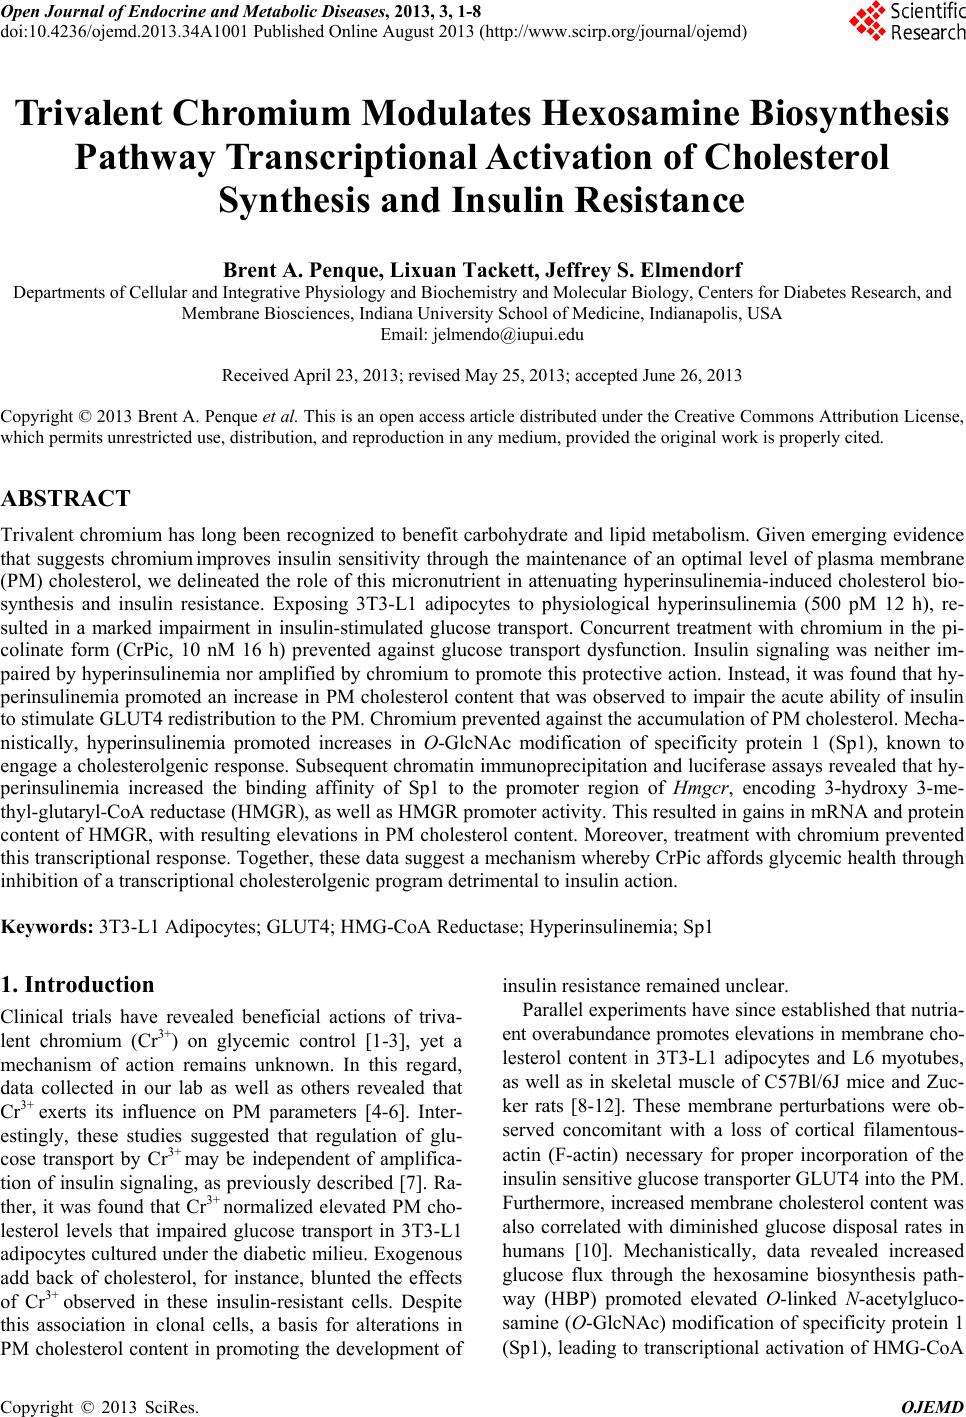
|