Optics and Photonics Journal, 2013, 3, 268-271
doi:10.4236/opj.2013.32B063 Published Online June 2013 (http://www.scirp.org/journal/opj)
Characteristics Analysis of Chemical Concentration Sensor
Based on Three-layer FBG
Zhaoxia Wu, Xinyan Yu, Erdan Gu, Zhi Kong, Wenchao Li
College of Control Engineering, Northeastern University at Qinhuangdao, Qinhuangdao Hebei 066004, China
Email: ysuwzx@126.com
Received 2013
ABSTRACT
The three-layer structure model of the fiber Bragg grating is proposed in this paper. And through experimental study
and reasoning calculation to verify the three layer structure of the optical waveguide model, so the sensitivity character-
istic of the Bragg wavelength to the refractive index of chemical solution is obtained. And the relationships between the
concentration and the shift of Bragg wavelength of sucrose, ethanol, and Nacl solution are achieved. Finally the shifts of
the Bragg wavelength with the external concentration are obtained by experiments. A kind of simple structure, small
size, good stability, high sensitivity chemical concentration sensor is obtained.
Keywords: Fiber Bragg grating(FBG); Three-layer Structure; Refractive Index; Concentration of Solution; Chemical
Sensor
1. Introduction
The concentration of solution is considered as one of the
integrated indicators of medium solution. The concentra-
tion measurement and control of solution is widely used
on papermaking, chemical, sugar production, food indus-
try, environmental monitoring, etc. It is the important
technical means guarantee product quality and improve
the quality of products. Fiber Bragg grating (FBG) has
many virtues such as resistant to electromagnetic inter-
ference, high insulating, corrosion resistance small bulk,
low weight, high sensitivity, absolute code of wavelength,
compare with fiber, easy to reuse into network, etc. The
liquid concentration sensor takes FBG as its sensitive
element has positive research significance and potential
application prospect [1, 2]. The fiber Bragg grating sen-
sor plays an important role in the measurement of liquid
substance. It can distinguish the content of measured
substance by measuring wavelength change of reflection
center [3]. Therefore, improve the sensitivity of the fiber
Bragg grating on the refractive index of the surrounding
medium in the existing technical is the key [4]. At pre-
sent there are mainly two kinds of fiber grating sensors
used for measuring the refractive index change, fiber Bragg
grating (FBG) and long period fiber grating (LPFG) [5].
As a result of the coupling based on the core mode and
cladding mode, the external refractive index change will
have a greater impact on fiber cladding mode transmis-
sion properties; therefore the long period fiber grating
has a larger sensitivity. But the long period fiber grating
being very sensitive to optical fiber bending and laying
state, the high order cladding mode transmission proper-
ties being unstable, and its multi-Peak Value, large
bandwidth and the working mode of using the transmis-
sion spectrum only to detect limit its measuring precision
and multiplexing capability[6]. Currently, the refractive
index sensor based on fiber Bragg grating has been re-
ported [7, 8], but there are no in-depth theoretical analy-
sis, numerical calculations and experiment contrast re-
sults. This paper focuses on the FBG chemical sensor’s
theoretical analysis and establishes the three-layer struc-
ture model, while the three solutions of different concen-
trations were experimentally, and realize the high sensi-
tivity measurement of chemical solution concentration.
The sensor doesn’t need coating intermediate sensitive
material, can measure various chemical solution concen-
trations. The sensor has the advantages of simple struc-
ture, high precision, low cost, eases of reuse, can realize
on-line measurement and so on. Also it has broad appli-
cation prospects.
2. Theoretical Mode
Based on the fiber grating coupled mode theory and the
phase matching condition, the wavelength
B
of FBG
is:
2
B
eff
n
(1)
where, neff is the effective refractive index of core region
of the fiber, Λ is the grating period.
Copyright © 2013 SciRes. OPJ
Z. X. WU ET AL. 269
As the cladding thickness decreases (usually a few
microns), evanescent waves project through the cladding
layer. Under the effect of the evanescent wave, the effec-
tive refractive index of fibers and solution index have a
dependency relation [9]. The refractive index of solution
changes with the change of the concentration of solution.
Bragg wavelength changes with the change of the effec-
tive refractive index. So the response to the concentration
of chemical solution can realize by measuring the Bragg
wavelength to reflect the change of the concentration of
chemical solution.
First, discussed the changes of the external refractive
index SRI ranged from 1.32 riu to 1.46 riu and its effect
on FBG effective refractive index: suppose, λ is the op-
erating wavelength of LP01, neff is the refractive index of
LP01. And it is shown in Figure 1. The LP01 model’s
characteristic equation can be expressed as:
 
 
 
0
00 0
0
00 0
11 11
'
'/ '
''/''
Ju KvcKv Iv
Kv KvJuIvc
IvcKv IvKvc











'/
(2)


12
22
1
2eff
uann

 (3)


12
22
2eff RI
vbnS

 (4)


12
22
2
'2 eff
vbnn

 (5)
cab (6)
where, a is the fiber radius, b is the cladding radius after
etching, n1 and n2 is respectively the core and the clad-
ding refractive index, J is the Bessel function of the first
kind, I is the variant Bessel function of the first kind, K is
the variant Bessel function of the second kind.
The reflectivity and transmissivity expression of the
Fiber Bragg grating are deduced through coupled mode
equation and boundary condition of Fibber Bragg grating,
in the phase matching condition, corresponding to the
maximum reflectivity and transmissivity:

22
max tanh tanh
B
n
RSL



L
(7)
1
n
2
n
R
I
S
abr
core
cladding
S urrounding
medium
Figure1. Optical waveguide model of three-layer structure.

max coshTar SL (8)
Where

2
2
Sk

, k is the coupling coefficient,
Δβ is phase-mismatching condition.
So, the reflectance spectrum between Bragg reflection
wavelength and change of SRI offset size is obtained
through the reflective index change of solution. It can be
more clearly viewed how the external solutions influence
the Fiber Bragg grating center wavelength.
3. The Simulation Results
For the specific fiber grating, solutions meeting equation
(1) - (6) can be found if given the SRI range. And the
solutions are just the FBG switch resonant wavelength of
corrosion layer and the effective refractive index of neff.
The simulation experiment use the optical fiber type of
SMF-28TM which is used more commonly in communi-
cation, some specific parameters: n1 = 1.46810, n2 = 1.46281,
a = 4.15 μm. Set the main structure parameters of corro-
sion FBG: the grating period: Λ = 528.93nm; corrosion
zone diameters are respectively: DTH = 9.3 μm, 10.3
μm, 12.3 μm, 14.3 μm, 16.3 μm; the range of SRI: 1.32 -
1.46, then assuming that temperature is a constant. For a
given optical parameters, solve the characteristic equa-
tion (2) when the wavelength
= 1550 nm, and then get
the effective refractive index of neff. As shown in Figure
2 uniform corrosion of FBG in different cladding radius,
there is a nonlinear relationship between the Fiber Bragg
grating effective refractive index and changes of the ex-
ternal solution refractive index SRI.
The refractive index spectral shows that the sensitivity
of corrosion area grating is associated with SRI directly.
There exists a red—shift compared to the Bragg wave-
length, when the external solution refractive index in-
creases. Due to its fundamental guide model has a better
restriction in this fiber core range, and resulting in a
slight evanescent wave, when SRI is about 1.34, the ex-
ternal refractive index has little effect on wavelength
offset. When the external refractive index is close to the
1.321.34 1.36 1.381.4 1.42 1.441.46
1.463
1.4635
1.464
1.4645
1.465
1.4655
S
RI
n
eff
b=4.65m
b=5.15m
b=6.15m
b=7.15m
b=8.15m
b=62.5m
Figure 2. Different cladding radius effective index of fun-
damental mode with cladding refractive index changing.
Copyright © 2013 SciRes. OPJ
Z. X. WU ET AL.
270
cladding refractive index (SRI = 1.46), the offset reaches
a maximum, at the same time the sensor reaches the
maximum sensitivity; secondly, from (a) - (d) we can
know that the smaller the thickness of the cladding layer,
the higher the sensitivity of the sensor. So the relation-
ship between the FBG wavelength and the change of the
solution refractive index is obtained.(Figure 3)
15481548.4 1548.8 1549.2 1549.61550
0
0.2
0.4
0.6
0.8
1
/nm
P/Reflectivity
SRI=1.32
=1548.10
SRI=1.34
=1548.14
SRI=1.36
=1548.20
SRI=1.38
=1548.28
SRI=1.4
=1548.39
SRI=1.42
=1548.55
SRI=1.44
=1548.84
SRI=1.46
=1549.71
b=4.65um
(a) b=4.65μm, Δλ=1.587nm
1548.2 1548.615491549.4 1549.8 1550.2
0
0.2
0.4
0.6
0.8
1
/n m
P/Re fl ectivi ty
SRI=1.32
SRI=1.34
SRI=1.36
SRI=1.38
SRI=1.4
SRI=1.42
SRI=1.44
SRI=1.46
b=5.15um
(b) b = 5.15 μm, Δλ = 1.05786 nm
1549.2 1549.4 1549.6 1549.8 1550 1550.2
0
0.2
0.4
0.6
0.8
1
/nm
P/Reflectivity
SRI=1.32
SRI=1.34
SRI=1.36
SRI=1.38
SRI=1.4
SRI=1.42
SRI=1.44
SRI=1.46
b=6.15um
(c) b = 6.15 μm, Δλ = 0.4231 nm
1549.8 1549.85 1549.9 1549.95 15501550.05 1550.1 1550.15 1550.2
0
0.2
0.4
0.6
0.8
1
/n m
P /Refl e ctivi ty
SRI=1.32
SRI=1.34
SRI=1.36
SRI=1.38
SRI=1.4
SRI=1.42
SRI=1.44
SRI=1.46
b=8.15um
(d) b = 8.15 μm, Δλ = 0.10579 nm
Figure 3. The refractive index spectrum of FBG in different
cladding radius.
4. Experimental Analysis
The measurement experiment structure diagram of the
concentration sensor based on Fiber Bragg grating as
follows: (Figure 4)
In order to study the sensitivity of the sensor, we select
sucrose, Nacl, ethanol three solution for experiment, analy-
sis the effects of different solutions at different concen-
trations (C less than 80%) to the fiber grating wavelength,
eventually complete the high precision measurement of
the chemical concentration sensor based on Fiber Bragg
grating.
The experimental data of three kinds of solution con-
centration C and refractive index can be measured by
WAY-type Abbe refract meter, and combine the partial
least squares, the linear expressions of the three kinds of
solution are established. The expressions are as follows:
Sucrose n = 1.3285 + 0.00184c
Nacl n = 1.3331 + 0.00185c
Ethanol n = 1.3404 + 0.00033c
where, C is the solution quality percentage concentration,
n is the refractive index. So the diagrams of the three
kinds of solution concentration and refractive index are
obtained. And it is shown in Figure 5. It can be seen
from the figure, there are no significant differences be-
tween the values calculated and the true value of the re-
fractive index of the three kinds of solution.
So when we take a fixed cladding radius, the diagram
of the wavelength of FBG with the change of concentra-
tion of external solution obtained, through the relation-
ship between external solution refractive index SRI and
the effective refractive index of Fiber Bragg grating neff,
Figure 4. The experimental structure diagram.
Figure 5. The correlation between concentration and refractive
index for different solutions.
Copyright © 2013 SciRes. OPJ
Z. X. WU ET AL.
Copyright © 2013 SciRes. OPJ
271
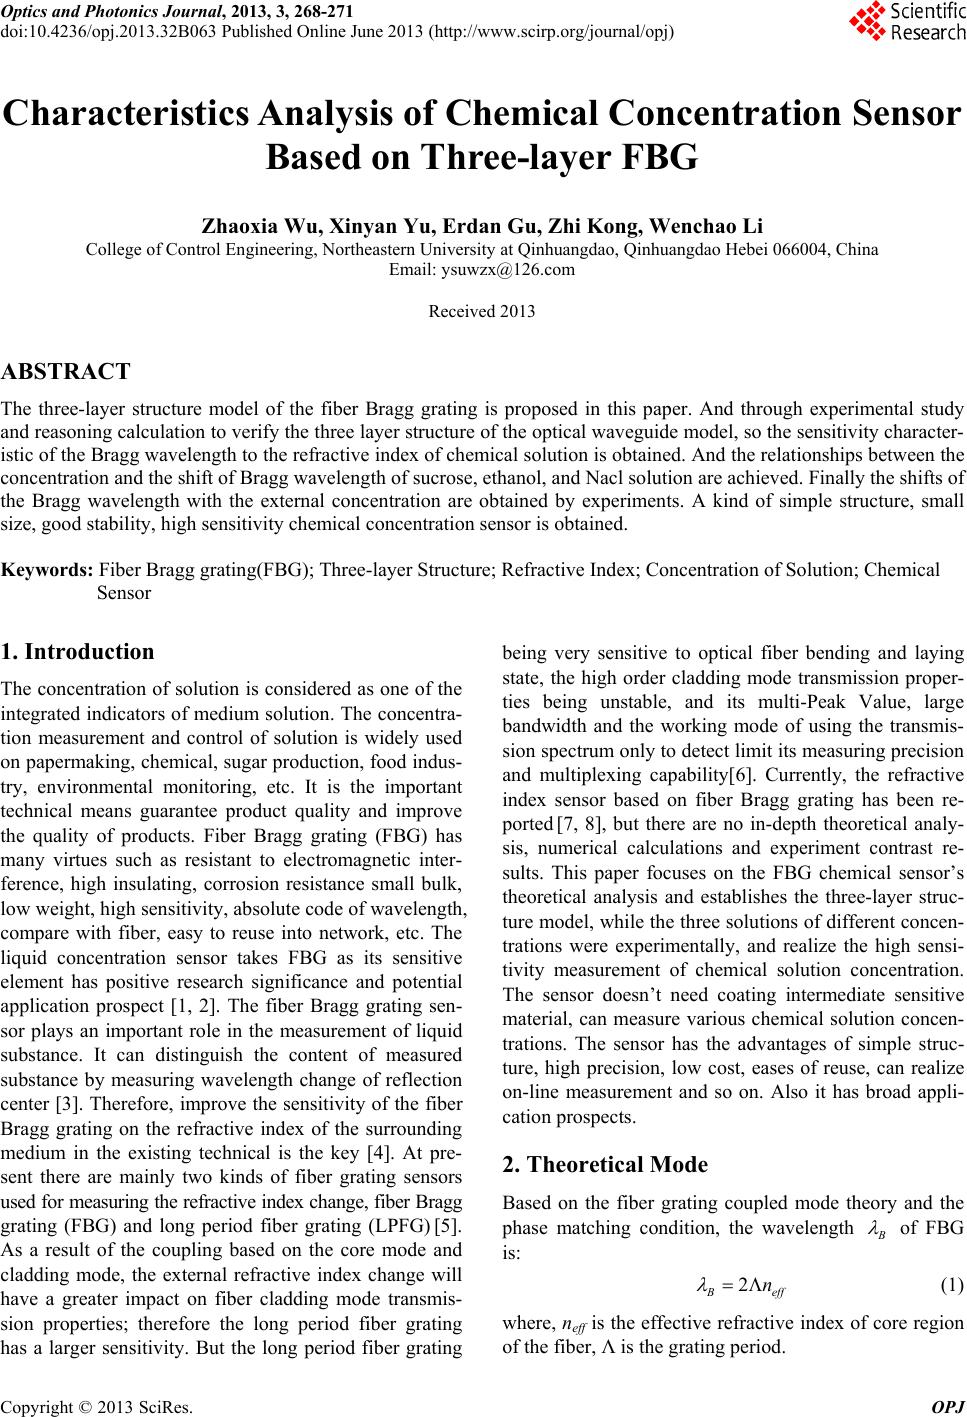
Figure 6. Relationshio between wavelength and sucrose
solution concentration.
the relationship between the effective refractive index neff
and resonant wavelength λB, and the relationship between
concentration of solution c and its refractive index SRI.
Figure 6 shows that, when measuring the 0 - 80% con-
centration alcohol solution, the center wavelength of fi-
ber grating changes a little with the change of the con-
centration of solution, and there has an approximate lin-
ear relation; when measuring Nacl and sucrose solution,
the change of wavelength with solution concentration
changing is obviously and show monotonically increas-
ing nonlinear relation. The wavelength of the fiber grat-
ing sensor changes obviously when the concentration of
Nacl changes. Therefore through the simulation we can
know that the sensitivity of the sensor is the largest and
the maximum sensitivity of the sensor is up to 185.59
pm/c%.
Therefore the sensitivity of the sensor is the largest,
from simulation we know that the maximum sensitivity
of the sensor is up to 185.59 pm/c%.
4. Conclusions
The paper combines the optical waveguide theory, fiber
grating coupling theory and evanescent field and partial
least squares method theory. Though characteristics
analysis and experimental of three-layer structure of the
Fiber Bragg grating sensor accomplished. An experiment
on the external solution concentration (c = 80%) is com-
pleted with the chemical sensors based on Fiber Bragg
grating, the spectrum and sensitivity of different concen-
tration of solution obtained. The sensor can be used to
measure the liquid environment chemical or biological
compositional changes, and can realize multi-point de-
tection at the same time, thus possessing good applica-
tion prospect in the filed of medical, pharmacy, petro-
chemical industry, catering trade, etc.
5. Acknowledgements
This work is supported by the Fundamental Research
Funds for The Northeastern University at Qinhuangdao.
(XNK201308).
REFERENCES
[1] U. S. Raikar, A. S. Lalasangi, V. K. Kulkarni and J. F.
Akki, “Concentration and Refractive Index Sensor for
Methanol Using Short Period Grating Fiber,” Interna-
tional Journal for Light and Electron Optics, Vol. 122,
No. 1, 2011, pp. 89-91.
doi:10.1016/j.ijleo.2009 .11.012
[2] Y. Zhan, J. Luo, H. Wu and M.H. Yu, “An All-Fiber
High Resolution Fiber Grating Concentration Sensor,”
International Journal for Light and Electron Optics, Vol.
123, No.7, pp. 637-640
[3] Dionisio A. Pereira Orlando Fraza˜o. “Fiber Bragg Grat-
ing Sensing System for Simultaneous Measurement of
Salinity and Temperature,” Society of Photo-Optical In-
strumentation Engineers, Vol. 43, No.2, 2004, pp.
299-304.
[4] M. F. Zhao, D.-Y. Huang, B. B. Luo, et al., “Evanescent
Wave Sensors Based on Fiber Bragg Grating,” Journal of
Chongqing University of Technology, Natural Science,
2010, Vol. 24, No.10, pp. 46-50.
[5] T. M. Libish, J. Linesh, P. Biswas, S. Bandopadhyay, K.
Dasgupta and P. Radhakrishnan. “Fiber Optic Long Pe-
riod Grating Based Sensor for Coconut Oil Adulteration
Detection,” Sensors & Transducers, 2010, Vol. 114,
pp.102-111.
[6] U. S. Raikar, A. S. Lalasangi, Jyoti F. Akki, P. Raikar, et
al. “Concentration Sensor Based on Fiber Grating Tech-
nology,” Sensors and Actuators B: Chemical, Vol. 161,
No.1,2012,pp. 818-823.doi:10.1016/j.snb.2011.11.039
[7] Q. Jiang, D. B. Hu and M. Yang, “Simultaneous Meas-
urement of Liquid Level and Surrounding Refractive In-
dex Using Tilted Fiber Bragg Grating,” Sensors and Ac-
tuators A: Physical, 2011, pp. 1-4.
[8] W. S. Liu and Z. G. Guan, “Multiplexing of Fiber Bragg
Grating Pairs for Sensing Based on Optical Low Coher-
ence Technology,” Microwave and Optical Technology
letter, Vol. 50, 2008, pp. 2437-2439.
[9] M. F. Zhao, D. Y. Huang, B. Zhou and L. Z. Jiao,
“Chemical Sensors Based on Fiber Bragg Grating,” Me-
chanics and Materials, Vol. 84-85, 2011, pp. 582-585.
doi:10.4028/www.scientific.net/AMM.84-85.582