 Theoretical Economics Letters, 2013, 3, 233-244 http://dx.doi.org/10.4236/tel.2013.34040 Published Online August 2013 (http://www.scirp.org/journal/tel) Economic and Emotional Rationality: An Application to Wealth Concentration Jose Rigoberto Parada-Daza1, Miguel Ignacio Parada-Contzen2 1Universidad de Concepcion, Concepcion, Chile 2Technische Universität Berlin (TUB), Berlin, Germany Email: rparada@udec.cl, miguelparadacontzen@gmail.com Received May 29, 2013; revised June 29, 2013; accepted July 17, 2013 Copyright © 2013 Jose Rigoberto Parada-Daza, Miguel Ignacio Parada-Contzen. This is an open access article distributed under the Creative Commons Attribution License, which permits unrestricted use, distribution, and reproduction in any medium, provided the original work is properly cited. ABSTRACT This Paper presents a theoretical outline regarding the Emotional Well-being (EW) function as an extension of the eco- nomic utility function. EW includes habitual factors that are always present in everyday decision making. Firstly, an analytical-mathematical conceptualization of EW is carried out, followed by a study of the concept of emotional secu- rity, in order to define a new idea of emotional rationality as a complement to economic rationality. An explanation is put forth, as an application, of the concentration of wealth phenomenon according to the focus on economic and emo- tional rationality. The conclusion is that EW is a theoretical approach which can clarify the understanding of the deci- sion making process in economics activities. Keywords: Utility Function; Emotional Well-Being; Economic Rationality; Emotional Rationality; Concentration of Wealth 1. Introduction The relation between levels of wealth and utility can be explained conceptually, from an exclusively economic point of view, by adopting the economic utility function concept, based on the theory of rational investment deci- sions measured in utilitarian units. This is the foundation of the argument for financial and economic decision making theory. However, this vision can change if vari- ables are incorporated that are not completely explained by rationality of economic man when the interpretation of a particular economic fact is attempted. Sometimes it is not completely convincing that the person or persons behave solely as economic agents when making eco- nomic decisions. As such, following the economic utility function, new variables can be incorporated into the analysis in order to explain the relation between wealth and utility. In this perspective, Parada-Daza [1], a function is developed that incorporates the economic rationale adding an ele- ment to interpret other variables that influence in making decisions during an economic act. This new factor in- cludes factors such as: ethics, social responsibility and other characteristics related to people. This function has been titled the Emotional Well-being Function. The EW function has been used in literature to evaluate corporate social responsibility Parada-Daza [2], the sustainable development of small and medium enterprises, Brilius [3] and to evaluate the economic and non-economic behavior of various countries, Parada-Daza [4]. In this paper analytically distinct characteristics of the EW function are developed. Emphasis is placed on two new concepts; emotional rationality and emotional secu- rity to propose an application of the Emotional Well Be- ing function that allows understanding, from a different perspective, what motivates the concentration of wealth and the perception that the actions of rich and poor citi- zens must be separated. 2. Prior Definitions and Literary Analysis To substantiate the propositions of this paper, some con- cepts must be defined. These are extrapolated from con- sulted literature and new concepts incorporated here. 2.1. Emotional Well-Being Personal Emotional Well-being (EW) is understood as the level of satisfaction that is felt when undertaking any act of daily life. This includes economic and global emo- tional satisfaction. This is evaluated by emotional pleas- C opyright © 2013 SciRes. TEL  J. R. PARADA-DAZA, M. I. PARADA-CONTZEN 234 ure. Higher the level of emotional pleasure, higher the level of emotional wellbeing. It is considered here that EW is a variable that is dependent on an individuals’ wealth. 2.2. Relative Wealth Let wa,i be the wealth of individual i, valued in absolute monetary units a, in an economy comprised of n indi- viduals and W the total wealth in the economy in the fol- lowing form: , 1 n ai i wW Thus, a variable is defined as ,0,1 ri w which re- presents the relative wealth of an individual i as: , , ai ri w wW , such that , 1 1 n ri i w . The relative wealth of the individual i permits the grouping of people as more wealthy and less wealthy. Therefore if an individual i has a wealth relative to 0.9 it indicates that, of the entire wealth of a society of n indi- viduals, this individual i has accumulated 90% and the rest of the n 1 individuals, possess 10% of the total wealth. 2.3. Utility Function and Its Literary Discussion 2.3.1. Economic Utility In economic decision making theory, the utility function is used as the basis of analysis for explanation under risky conditions. A set of axioms has been developed to explain the choice or decision theory, Copeland and Weston [5] established a quadratic utility function as well as the logarithmic utility function that has been widely used in literature. Theories have been developed based on this type of function that reflect the behavior of people from an economic rationality standpoint, giving understanding as to why people are essentially maximiz- ers and only move through this type of function. Using the concept of relative wealth, for the purposes of this paper a utility function is defined as: :0,1U and . rr wUUw Thus, U is differentiable up to at least second grade and is strictly increasing. i.e. d0, 0,1 dr r Uw w In this approach, mathematically, utility is a function of wealth and it is supposed that the greater the wealth, the greater the utility. Each point shows the value that corresponds to each level of wealth. Economic man moves over the combination of these points. In regards to the previously mentioned it is assumed that the utility function is both increasing and limited. This implies that the greater the wealth, the greater the degree of economic satisfaction. The fact that it is limited means that certain levels exist where people consider a certain amount of satisfaction is acceptable. Another characteristic of this function is that there is a diminishing marginal utility. That is, compared to an increase of wealth, an augment in utility will be gradu- ally decreasing. Mathematically this is represented by a negative value of the second derivative of the utility function of which corresponds graphically to a convex function: 2 2 d0, 0,1 dr r Uw w Some utility functions commonly used in economic and financial literature are: logarithmic function, quad- ratic function, exponential negative function and poten- tial function, Marin & Rubio [6]. In continuation, the two most common functions used in the economic literature are detailed. 2.3.2. Logarithmic Function ln1, with,0, rr Uwa wcac (1) D. Bernoulli (1730-1731) applied the logarithmic util- ity function, i.e. U(w) = ln(w). Given that this paper util- izes relative wealth, which is defined between zero and one, the use of a logarithmic function is not possible be- cause the function would take negative values. To avoid this problem, the argument of the logarithmic function is augmented in one unity as shown in Equation (1). The logarithmic function is used because it is increasing throughout its domain, is convex and has no relative maximum point or inflection. Figure 1 shows the graph of this function. The dotted line represents the utility function value when wr = 1. 2.3.3. Quadrat i c Function 2 1,with rr Uwawaa0 (2) Figure 1. Function U(wr) = ln(wr + 1) + c. Copyright © 2013 SciRes. TEL  J. R. PARADA-DAZA, M. I. PARADA-CONTZEN 235 The quadratic function has been used by several au- thors such as R. Merton [7], Copeland-Weston [5], R. Jarrow [8]. W. Sharpe [9], Also represents the utility function by a quadratic function. The main feature of this is that it presents a maximum point of utility for a level of wealth. Beyond this point the function graph decreases and, therefore, the utility decreases with increasing wealth. Regarding this, W. Sharpe [9] said: this is clearly unacceptable. This is explained following the concept of economic rationality which is an intersection between a normative and a positive approach, as there are people in real life who behave according to this standard however others will not. Thus their everyday economic actions are not fully explained by the assumption of economic ra- tionality and the ethic that this standard implies. Figure 2 shows the graph of this function. 2.3.4. Discussion Thus, personal economic performance reduces when maximum utility is obtained. This is methodologically explained through the mathematic maximization of the desired utility of an event various alternative propositions. The expected utility implies that, faced with two possi- bilities of obtaining compensation for a decision that is made, that which has a higher expected utility is appro- priate. The aforementioned is that which is defined as the expected utility hypothesis which represents the “rational behavior” of a person faced with uncertainty. With re- spect to this, Lafont [10] poses the following: a) The definition of the utility function with these nor- mative assumptions is a working hypothesis and there- fore it is necessary to deduce verifiable empirical impli- cations. If the empirical study doesn’t dismiss, it can be concluded that people act as if they will maximize the expected utility. b) The utility function is a normative interpretation that consists of demonstrating that rational agents “should maximize” their expected utility. The concept of rational behavior rests within the pre- viously mentioned postulations and is defined as the abil- Figure 2. Function U(wr) = a(wr + 1)2 – a. ity to choose as if it were a lottery characterized by vari- ous paths of retribution. This interpretation is an eco- nomic definition and the rational concept should not be understood as a synonym for terms such as: reasonable, prudent, just and fair amongst others. Thus, a being is “rational” only if they behave according to the economic rule or standard, which from a Theory of Knowledge point of view, is based on a rational and empirical model. These two aspects of regulation and maximization are essential for understanding and reasoning what, under these suppositions, implies the concept of rational eco- nomic man. Carroll [11] follows Max Weber in “The Protestant Ethic and the Spirit of Capitalism”, which explains that people’s search for wealth is for their own use and pos- session, and that this is the main cause of both the system and of individuals. Robinson [12] indicates that the maxi- mization of profit is a metaphorical concept of impene- trable circularity. Debreu [13] shows that there are con- tinuous and non-continuous utility functions. Markowitz [14] based his approach on the utility function. Pratt and Arrow [15] establish ways of measuring risk reward. “Powerful utility functions” have been developed with complex mathematical formulas under the same norma- tive principles as indicated in Ait-Sahalia & Brandt [16], Ang [17], Mehra & Prescott [18], Friend & Blume [19]. Hwang and Satchell [20] elaborate from the Utility function, how much should be paid in order to acquire information. The utility function has been used to explain donations and signal that these have a similar behavior to luxury goods. Inhaber and Carroll [21] signal that luxury goods are generally associated with assets such as art, jewelry, sporting equipment, etc. Which are always goods in an economic sense and therefore, assimilable to any other economic good. Carroll [11] indicates that the love of wealth as motivation is assuredly an extreme po- sition; there are other types of motivation such as: job satisfaction, status, philanthropic ambition, power, etc. Considering the aforementioned, the utility function theory has a conceptual and philosophical foundation but is also regulative, forcing the understanding of people’s behavior exclusively as rational economic entities. In this way, the utility function explains any other type of non- economic motivation which would be well represented under its assumptions. From a Theory of Knowledge stand point, the utility function theory is a mix between rationalism and empiricism, where an intersection can be made between the normative and the positive. The ra- tionalism and empiricism approach is present in financial theory. The interpretation of an economic act from a solely ra- tional economic point of view and its methodological representation through the utility function can at times give partial results. For which, these acts should be ana- Copyright © 2013 SciRes. TEL  J. R. PARADA-DAZA, M. I. PARADA-CONTZEN 236 lyzed from a view point that encompasses both rational economic standards and their implicit ethics, as with other ethic views that can fulminate distinct decisions to those that would suggest an analysis from a purely eco- nomic view point. 3. Emotional Well-Being Function 3.1. Definition From the postulations of Sharpe (Op.Ci.), who indicates that no investor is located on the descending part of the utility function curve, a more global function of eco- nomic utility is discussed here. This new function ex- plains the performance of people and businesses simul- taneously incorporating both the facets of man with eco- nomic rationality and the view of people and businesses that also act motivated by other ethical values, Parada [1]. This same model has been used to explain the economic crisis in small and medium businesses and their sustain- able politics, Brilius [3], in order to assess the social re- sponsibility of the business, Parada-Daza [2], and by this same author in order to evaluate the economic behaviour of people in different countries, Parada-Daza [4]. An Emotional Well-being (EW) function considers that there are economic sacrifices in exchange for bene- fits provoked by different reasons and exclusively eco- nomic motives. This is translated mathematically in that the function is not necessarily strictly increasing through- out its domain. :0,1 , rrrer U wUUwUwf (3) where Ur(wr) corresponds to a classic utility function as previously described. The term Ue(wr, f) joins all cultural, ethical, social, emotional or practical characteristics of a distinct nature to the strictly economic, that can cause the individual to be separated from the behavior of an eco- nomic man. Unlike the original article of Parada-Daza [1], an innovation is introduced here, making a generali- zation of both components and incorporating the f pa- rameter to synthesize the non-economic characteristics mentioned. For analysis, the following function is considered be- cause the conclusions derived from it are easily gener- alizable to the types of functions described above. EW :0,1 EW ln1sin 2 rr rr wU w awbfw c (4) With parameters of the function and a + b = 1. ,,,abc f Parameters a an d b are interpreted as the relative im- portance that people or organizations submit to economic rationality and the respective emotional component. In effect, if a = 1, then b = 0, a classic utility function is obtained as previously expressed. The parameter c repre- sents the minimum satisfaction that is independent from the level of wealth of each person or business. This could be zero, in which case it is implied that emotional well- being only depends on wealth. The coefficient c is inter- preted as a “Satisfaction of Belonging” for being an inte- gral part of a business or society that provides emo- tional satisfaction to the person, independent to their wealth. This enjoyment can be explained by such factors as: social and business prestige, business and social his- tory and tradition, social and business culture and other specific factors and characteristics of each person or business. The parameter f is interpreted as the frequency with which the person or organization allows the aversion of strictly economic rationality. Distinct values of f involve distinct types of behavior. While higher the value of f, higher will be the oscillation of the emotional variable with respect to a purely economic component. The approach of (4) is an extension of the Emotional Well-being function introduced by Parada-Daza [1], be- cause in this paper, the parameter f is considered perma- nently in f = 1/2 and, given that it was working with ab- solute wealth (in general, w > 1), the displacement of the algorithmic component was not considered. However, in this paper it has been decided to open the spectral analy- sis to include the parameter f and with it explain why the valor f = 1/2 has been previously used. Therefore, in contrary to the Parada-Daza [1] paper, in this contribu- tion the relative wealth concept has been adopted, with 0,1 r w, and the original approach has been modified adding 1 to the argument of the logarithmic function, in such a way to adjust it in order to work without the EW function assuming negative values, Mao [22]. 3.2. Coordinates of Emotional Well-Being: Enveloping Functions The family of curves (4), defined by the parameter f, in- cludes superior and inferior enveloping functions. This is explained by the sinusoidal component of the EW func- tion that has a bounded range in [−1,1], independent of its argument. A curve is said to be enveloping a family of plane curves if it is tangent with all the lines of said family, additionally each point of the enveloping function has contact with some of the lines of the family that is ex- amined, Demidovich [23]. For a family of plane curves depending on the pa- rameter α that complies with the following equation: ,, 0fxy . The enveloping equation is determined by way of the equation systems: ,, 0fxy and ,, 0fxy . Copyright © 2013 SciRes. TEL  J. R. PARADA-DAZA, M. I. PARADA-CONTZEN 237 By eliminating the parameter α, a discriminating curve (Φ) is obtained that contains the envelopment of the fam- ily studied, stemming from the following relation: Φ(x,y) = 0. In the generic case of the EW function proposed in (3), parameter α corresponds to f and x ≡ wr, y ≡ U, then: :, :0 rr er e fUUwUw f U ff 0 (5) Considering, as in (4), an emotional component of si- nusoidal characteristics, ,sin2 er r Uwf bfw , from the second equation of the system (5) it is con- cluded that: 0sin2 2cos2 22 14 e r rr r r Ubfw ff bwf w fw fw 0 0 Replacing these values in the first equation of the sys- tem (5), the following discriminating function is ob- tained: :sin rr UUw b 20 Given that sin2 1 , two enveloping curves are obtained which correspond to: rrr rrr UwUwb UwUwb Note that no matter the type of strictly economic func- tion that is used (logarithmic, quadratic or other), for an emotional component of the sinusoidal characteristic, the enveloping curves are of the same form as the economic utility function. These are interpreted as the maximum and minimum value of the described Emotional Well- being function. U+ corresponds to the behavior of an economic man as a whole while U− is interpreted as the minimum accepted level of security, which is personal and can be represented by a minimum requirement. In other words U+ indicates the economic expectations and aspirations of an agent and U− the minimum require- ments. In earlier papers, Parada-Daza [1] the existence of en- veloping functions exclusively for a function with a ra- tional logarithmic part. In this section, said proof has been broadened to include any type of utility function (Ur) that will give origin to enveloping functions with the same characteristics as Ur. In the particular case of the equation proposed in (4), ln 1 rr r Uwawc is given. Therefore, replacing the expressions earlier deduced, the envelopments are: ln 1 ln 1 rr rr Uwa wbc Uwa wbc (6) 3.3. Emotional Well-Being Function Graph Figure 3 presents a graph of the EW function according to that which has been outlined previously, the same as both enveloping functions. The Emotional Well-being function (continuous curve) is contained between both enveloping functions (segmented lines). This characteris- tic allows the affirmation that enveloping functions have tendency to increase, although, a as a product of the emotional component, clearly identifiable intervals exist where the curve is decreasing. With this the following question arises: Is it valid to be located above the decreasing interval of the curve? If conventional economic rationality necessarily locates economic agents above the ascending part of the utility function, what would justify this behavior contrary to that habitually studied in economic theory? Observe in Figure 3 that the Emotional Well-being function is always above the minimum established by the inferior envelopment (U ). That is to say that there is always a level of economic satisfaction limit that the in- dividual, society or organization is not willing to com- promise. On the other hand, it can be observed that there is an increasing level of economic aspirations (U+) that coincides with the behaviour of any agent in real life. The difference that exists between this normative model and the actions of a real economic agent is con- trasted by the differences between the minimum level of security established and the real actions to explain the making of determined decisions. In other words, The EW model encompasses complex agents, with a much wider philosophical understanding than an exclusively eco- nomic entity. In addition to the utilitarian characteristics which are taken as a normative assumption, other ethical concepts are added (such as moderation, bravery, justice or liberty) that permit a more complete analysis of human tasks. These characteristics are intended to be reflected through the parameter ƒ. Large values of this parameter indicate a tendency to recede repeatedly form the im- posed normative model denoting certain emotional “in- stability”. In turn, values that are too small, demonstrate excessive prudence that diminishes in the long run. In fact, when ƒ = 0, then the EW curve coincides with the average between both limits of behavior (fine segmented line Figure 3). Copyright © 2013 SciRes. TEL  J. R. PARADA-DAZA, M. I. PARADA-CONTZEN 238 Figure 3. Emotional well-being utility function. 4. Measuring Emotional Rationality 4.1. Emotional Security Index (ESI) Given the EW function, the Emotional Security Index (ESI) as the ration between that which is lost from eco- nomic earnings by paying attention to an emotion other than an economic one, divided by the excess earning (“Security cushion”) with respect to the minimum de- sired profit for any point of relative wealth wr. That is to say, the numerator EW rr Uw w cor- responds to lost earnings at a point wr by paying attention to values different to denominator wEW r wU r , in turn, corresponds to excess earning (“Security cush- ion”) with respect to minimum requirements at this point wr. The index is the following: EW ESI EW r r rr Uw w wwUw r (7) In the particular case of Equation (4), when b = 0, the index cannot be defined by the numerator as the de- nominator in the expression (7) would have a value equal to zero. Replacing in (7), the expressions (4) and (6) and sim- plifying, for b ≠ 0, the index takes the following form: 1sin2 ESI 1sin2 r r r w w w (8) With . Note that always r, due to the numerator and denominator are always positive. 1sin2 0 r fw 0ESI w Furthermore, ESI doesn’t depend on parameters a and b but only of f. That is to say, it doesn’t depend on how much importance is given to emotionality by each indi- vidual, organization or economic system, only the fre- quency f with which emotional behavior is accepted. The index is interpreted as the relation between that which is not earned by not being an economic man with respect to the benefit obtained by over the minimum level of security. In order to correspond as close to reality as possible, this loss cannot be higher than the emotional benefit of situating over the minimum (“The Security Cushion”). As a consequence, a prudent form of behavior would yield a numeric value less than 1 for the ESI. 4.2. Emotional Rationality A decision is defined as emotionally rational if the eco- nomic loss through emotional behavior is less than the benefits with respect to the minimum tolerated level. That is to say when: ESI 1 r w (9) In the context of (4), given that for any value of 2r w , both the ESI numerator and denominator are positive, thus: ESI 1 1sin2 1sin2 0sin2 02 012 r rr r r r w wf fw fw fw w As 0,1 r w, in order to maintain emotional ration- ality on every level of wealth the following should be observed: 012f . For subsequent analysis, f = 1/2 is chosen which repre- sents an extreme case. Thus, maximum frequency en- sures emotionally rational behavior according to that which is defined in (9), for every level of wealth. Note that any inferior value would make the EW function seem similar to a pure utility function. In particular, if f = 0, then the EW function coincides exactly with average between both enveloping functions, that is: 0 EWln 1 0.5 rr rr wawc Uw UwUw r With this, from this point onwards, Emotional Well- being and ESI functions will be implemented in the fol- lowing form: EWln1 sin 1sin ESI 1sin rr r r r r wawbw w ww c (10) 4.2.1. EW Function Properties under the Supposition of Emotional Rationality 1) Point of tangency with U+ Copyright © 2013 SciRes. TEL  J. R. PARADA-DAZA, M. I. PARADA-CONTZEN 239 The EW function is tangent with U+ in wr = 1/2. In- deed, in order to have: EW rr wUw By (6) and (10) then: ln1sin 2 ln 1 rr r aw bfw aw bc c Reducing, the following is obtained: . sin 21 r fw This complies with the function domain only if: 22 r fw . Additionally, f = 1/2, thus: 12 r w. That is, the EW function reaches a superior level (U+) at a solitary point within the domain when the emotional component reaches its maximum value. Additionally, at this point, the marginal growth rate for both functions is the same: 12 12 12 12 12 dEW d cos 1 1 d d r rr r r r rw r rww rw r rw w w abw w a w Uw w These growth rates are interpreted as marginal emo- tional and economic wellbeing. That is, for this point, the marginal emotional wellbeing is exactly the same as the marginal emotional wellbeing for an economic man. 2) Determining the maximum level of emotional wellbeing Deriving EW with respect to relative wealth, the fol- lowing is obtained: dEW 2cos2 d1 r rr a bfw ww On the other hand, the second derivative of the EW function corresponds to: 2 22 22 dEW 4sin2 d1r rr a bfw ww The derived functions can be disassembled into two parts u1 y u2 such as: 1 dEW dr uu w With: 12 and2cos 2 1r r a uufb w fw The first expression of (11), u 1, is interpreted as the rate of change in EW as a product of the emotional component of the behavior. Note that this change is al- ways strictly positive. That is to say, the economic com- ponent of the behavior is strictly increasing in all the domain and that in the behavior of individuals, organiza- tions or economies that approach the paradigm of eco- nomic rationality (i.e. when a → 1 and b → 0), the EW function will have a maximum level only in the outer lying reaches of its domain when . 1 r w Moreover, the second component of (11), u2, corre- sponds to the EW rate of change produced by the emo- tional component of the behavior. This change can be both positive or negative, so it can be presumed that within the defined domain, , the EW function can have a maximum or minimum point in w* when: [0,1] r w 12 * dEW 0* dr rww uw uw w * Note that the value of w* depends on the parameters of the function a, b = (1 – a) and f. this equation does not have a direct analytical solution, for which an analysis of all possible parameter values is not carried out. Furthermore, when wr → 0 the EW derivative is posi- tive and therefore, the EW function is increasing in a vicinity of 0. Also, under the supposition of emotional rationality stated earlier (f = 1/2), the second derivative is negative throughout the EW domain, thus the EW func- tion graph is convex. In other words, these properties ensure that there is a point where the function reaches its maximum value within the domain [0, 1]. Therefore the EW function will be increasing in the interval [0, w*] and decreasing in the interval [w*, 1]. In which case with the supposition of emotional rationality the w* point complies with: 1cos *1 aaw w * The solution to this equation depends exclusively on the value of parameter a. An extreme case is given when w* = 1. In this situation, the function will be strictly in- creasing throughout its domain. If the solution to the equation is such that w* > 1, therefore the maximum value of EW will correspond to EWmax = EW (w = 1), since the function would be increasing throughout the entire domain. From the latter it can be deduced that a value limit exists for the parameter a for which a maxi- mum wellbeing is reached for total wealth (wr = 1). In- deed, making w* = 1 from the last expression is obtained 2 (11) Copyright © 2013 SciRes. TEL 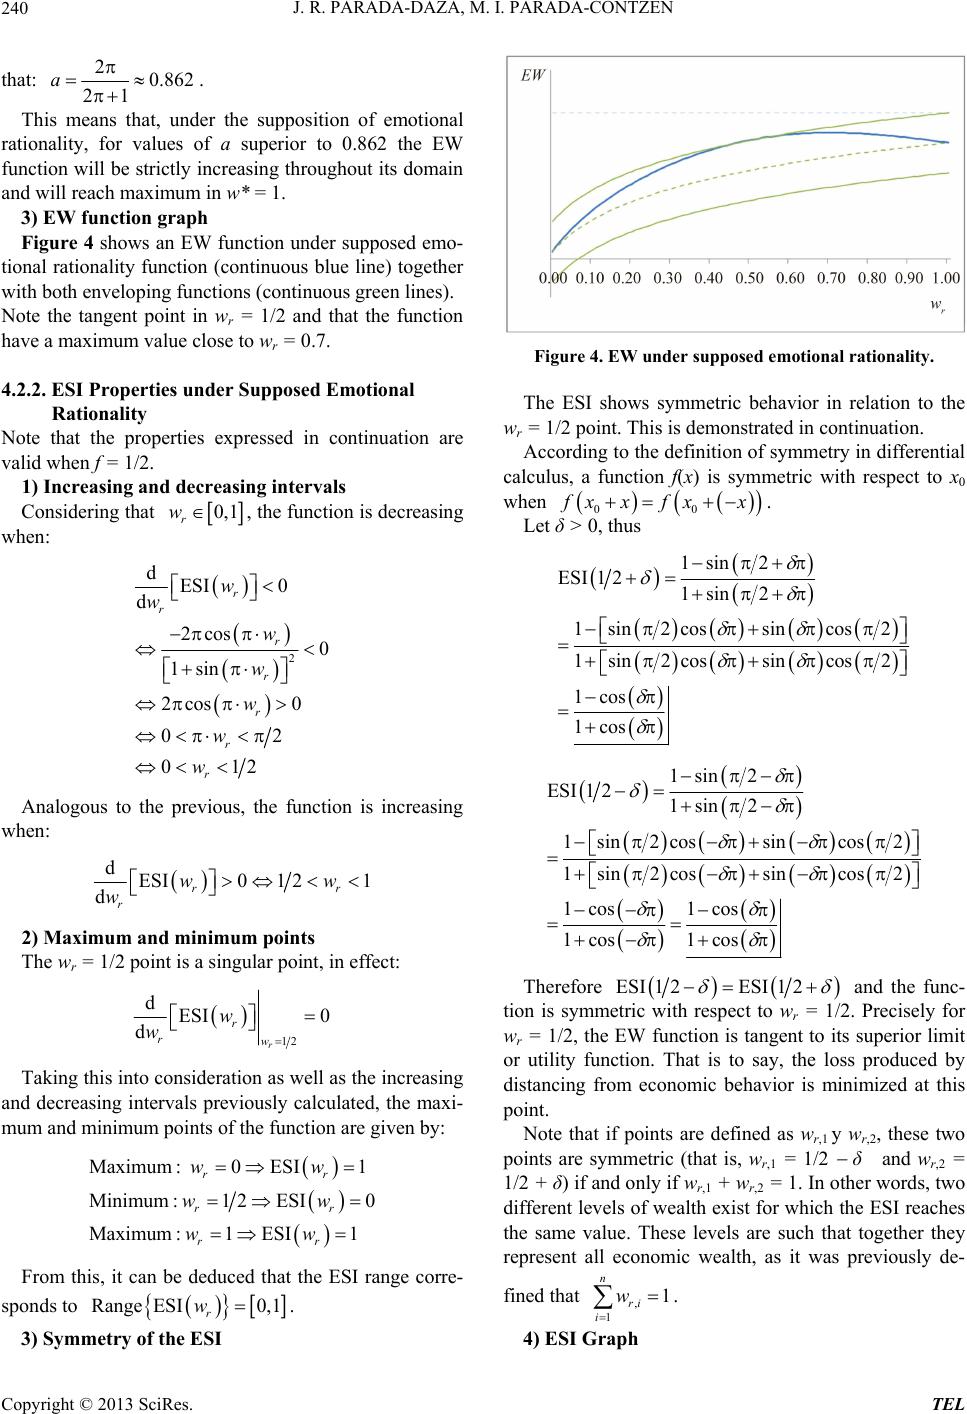 J. R. PARADA-DAZA, M. I. PARADA-CONTZEN 240 that: 20.862 21 a . This means that, under the supposition of emotional rationality, for values of a superior to 0.862 the EW function will be strictly increasing throughout its domain and will reach maximum in w* = 1. 3) EW function graph Figure 4 shows an EW function under supposed emo- tional rationality function (continuous blue line) together with both enveloping functions (continuous green lines). Note the tangent point in wr = 1/2 and that the function have a maximum value close to wr = 0.7. 4.2.2. ESI Properties under Supposed Emotional Rationality Note that the properties expressed in continuation are valid when f = 1/2. 1) Increasing and decreasing intervals Considering that 0,1 r w, the function is decreasing when: 2 dESI 0 d 2cos 0 1sin 2cos 0 02 012 r r r r r r r w w w w w w w Analogous to the previous, the function is increasing when: dESI01 21 drr r ww w 2) Maximum and minimum points The wr = 1/2 point is a singular point, in effect: 12 dESI 0 dr r rw w w Taking this into consideration as well as the increasing and decreasing intervals previously calculated, the maxi- mum and minimum points of the function are given by: Maximum: 0ESI1 Minimum :12ESI0 Maximum:1ESI1 rr rr rr ww ww ww From this, it can be deduced that the ESI range corre- sponds to Range ESI0,1 r w. 3) Symmetry of the ESI Figure 4. EW under supposed emotional rationality. The ESI shows symmetric behavior in relation to the wr = 1/2 point. This is demonstrated in continuation. According to the definition of symmetry in differential calculus, a function f(x) is symmetric with respect to x0 when 00 xx fxx . Let δ > 0, thus 1sin 2 ESI1 21sin 2 1sin2 cossincos2 1sin2 cossincos2 1cos 1cos 1sin 2 ESI1 21sin 2 1sin2cossincos2 1sin2cossincos2 1cos 1cos 1cos 1cos Therefore ESI1 2ESI1 2 and the func- tion is symmetric with respect to wr = 1/2. Precisely for wr = 1/2, the EW function is tangent to its superior limit or utility function. That is to say, the loss produced by distancing from economic behavior is minimized at this point. Note that if points are defined as wr,1 y wr,2, these two points are symmetric (that is, wr,1 = 1/2 δ and wr,2 = 1/2 + δ) if and only if wr,1 + wr,2 = 1. In other words, two different levels of wealth exist for which the ESI reaches the same value. These levels are such that together they represent all economic wealth, as it was previously de- fined that , 1 1 n ri i w . 4) ESI Graph Copyright © 2013 SciRes. TEL 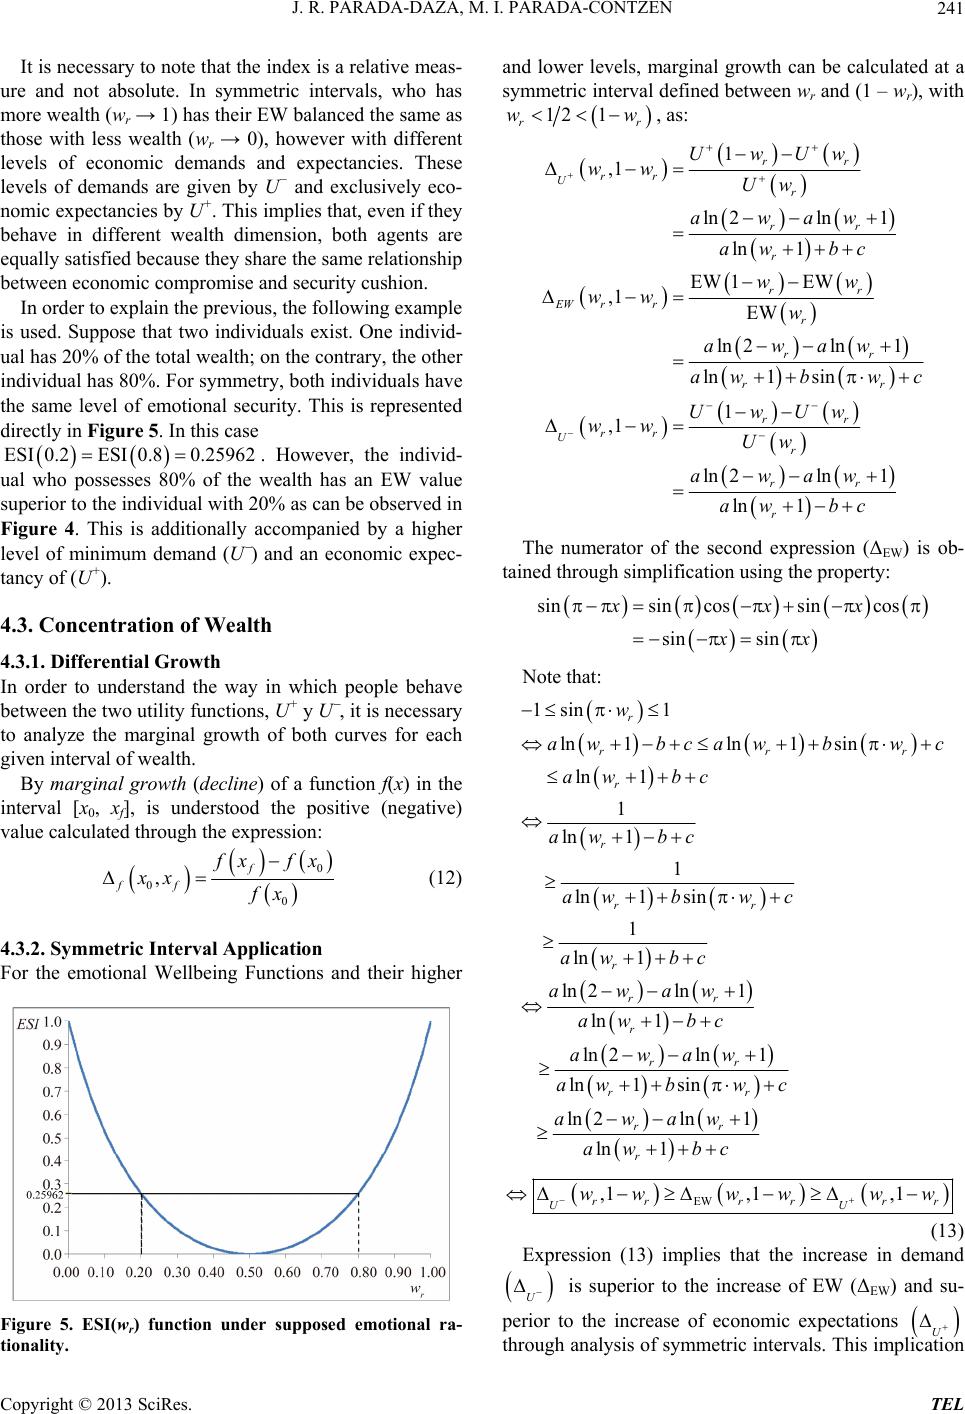 J. R. PARADA-DAZA, M. I. PARADA-CONTZEN 241 It is necessary to note that the index is a relative meas- ure and not absolute. In symmetric intervals, who has more wealth (wr → 1) has their EW balanced the same as those with less wealth (wr → 0), however with different levels of economic demands and expectancies. These levels of demands are given by U− and exclusively eco- nomic expectancies by U+. This implies that, even if they behave in different wealth dimension, both agents are equally satisfied because they share the same relationship between economic compromise and security cushion. In order to explain the previous, the following example is used. Suppose that two individuals exist. One individ- ual has 20% of the total wealth; on the contrary, the other individual has 80%. For symmetry, both individuals have the same level of emotional security. This is represented directly in Figure 5. In this case . However, the individ- ual who possesses 80% of the wealth has an EW value superior to the individual with 20% as can be observed in Figure 4. This is additionally accompanied by a higher level of minimum demand (U ) and an economic expec- tancy of (U+). ESI 0.2ESI 0.80.25962 4.3. Concentration of Wealth 4.3.1. Differential Growth In order to understand the way in which people behave between the two utility functions, U+ y U , it is necessary to analyze the marginal growth of both curves for each given interval of wealth. By marginal growth (decline) of a function f(x) in the interval [x0, x f], is understood the positive (negative) value calculated through the expression: 0 0 0 ,f ff xfx xx fx (12) 4.3.2. Symmetric Interval Application For the emotional Wellbeing Functions and their higher Figure 5. ESI(wr) function under supposed emotional ra- tionality. and lower levels, marginal growth can be calculated at a symmetric interval defined between wr and (1 – wr), with 12 1 rr ww , as: 1 ,1 ln 2ln1 ln 1 EW 1EW ,1 EW ln 2ln1 ln1 sin 1 ,1 ln 2ln1 ln 1 rr rr U r rr r rr EW rr r rr rr rr rr U r rr r UwUw ww Uw awaw aw bc ww ww w awaw awbw c UwUw ww Uw awaw aw bc The numerator of the second expression (ΔEW) is ob- tained through simplification using the property: sinsin cossincos sin sin xxx xx Note that: 1sin 1 ln1ln1 sin ln 1 1 ln 1 1 ln1 sin 1 ln 1 ln 2ln1 ln 1 ln 2ln1 ln1 sin ln 2ln1 ln 1 r rr r r rr r rr r rr rr rr r w awbcawbw c aw bc aw bc awbw c aw bc awaw aw bc awaw awbwc awaw aw bc r EW ,1,1 ,1 rrrrrr UU wwwwww (13) Expression (13) implies that the increase in demand U is superior to the increase of EW (ΔEW) and su- perior to the increase of economic expectations U through analysis of symmetric intervals. This implication Copyright © 2013 SciRes. TEL 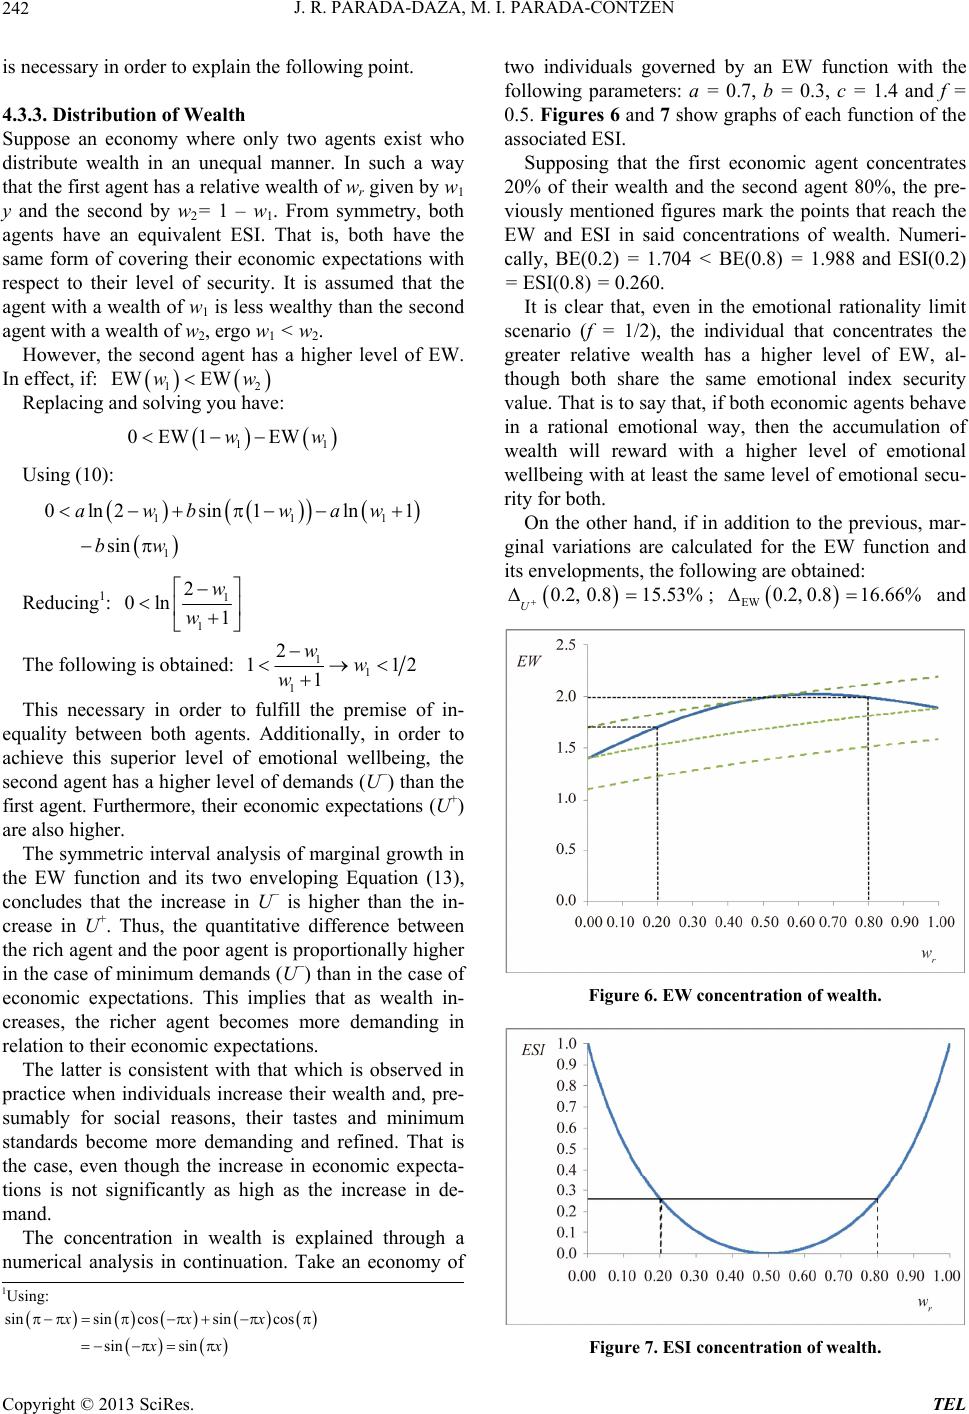 J. R. PARADA-DAZA, M. I. PARADA-CONTZEN 242 is necessary in order to explain the following point. 4.3.3. Distribution of Wealth Suppose an economy where only two agents exist who distribute wealth in an unequal manner. In such a way that the first agent has a relative wealth of wr given by w1 y and the second by w2= 1 – w1. From symmetry, both agents have an equivalent ESI. That is, both have the same form of covering their economic expectations with respect to their level of security. It is assumed that the agent with a wealth of w1 is less wealthy than the second agent with a wealth of w2, ergo w1 < w2. However, the second agent has a higher level of EW. In effect, if: 12 EW EWww Replacing and solving you have: 11 0EW1 EWww Using (10): 11 1 0ln2sin1ln 1 sin awb waw bw 1 Reducing1: 1 1 2 0ln 1 w w The following is obtained: 1 1 1 2 11 1 ww w 2 This necessary in order to fulfill the premise of in- equality between both agents. Additionally, in order to achieve this superior level of emotional wellbeing, the second agent has a higher level of demands (U−) than the first agent. Furthermore, their economic expectations (U+) are also higher. The symmetric interval analysis of marginal growth in the EW function and its two enveloping Equation (13), concludes that the increase in U− is higher than the in- crease in U+. Thus, the quantitative difference between the rich agent and the poor agent is proportionally higher in the case of minimum demands (U−) than in the case of economic expectations. This implies that as wealth in- creases, the richer agent becomes more demanding in relation to their economic expectations. The latter is consistent with that which is observed in practice when individuals increase their wealth and, pre- sumably for social reasons, their tastes and minimum standards become more demanding and refined. That is the case, even though the increase in economic expecta- tions is not significantly as high as the increase in de- mand. The concentration in wealth is explained through a numerical analysis in continuation. Take an economy of two individuals governed by an EW function with the following parameters: a = 0.7, b = 0.3, c = 1.4 and f = 0.5. Figures 6 and 7 show graphs of each function of the associated ESI. Supposing that the first economic agent concentrates 20% of their wealth and the second agent 80%, the pre- viously mentioned figures mark the points that reach the EW and ESI in said concentrations of wealth. Numeri- cally, BE(0.2) = 1.704 < BE(0.8) = 1.988 and ESI(0.2) = ESI(0.8) = 0.260. It is clear that, even in the emotional rationality limit scenario (f = 1/2), the individual that concentrates the greater relative wealth has a higher level of EW, al- though both share the same emotional index security value. That is to say that, if both economic agents behave in a rational emotional way, then the accumulation of wealth will reward with a higher level of emotional wellbeing with at least the same level of emotional secu- rity for both. On the other hand, if in addition to the previous, mar- ginal variations are calculated for the EW function and its envelopments, the following are obtained: 0.2, 0.815.53% U ; and EW 0.2, 0.816.66% Figure 6. EW concentration of wealth. 1Using: sinsin cossincos sin sin xxx xx Figure 7. ESI concentration of wealth. Copyright © 2013 SciRes. TEL 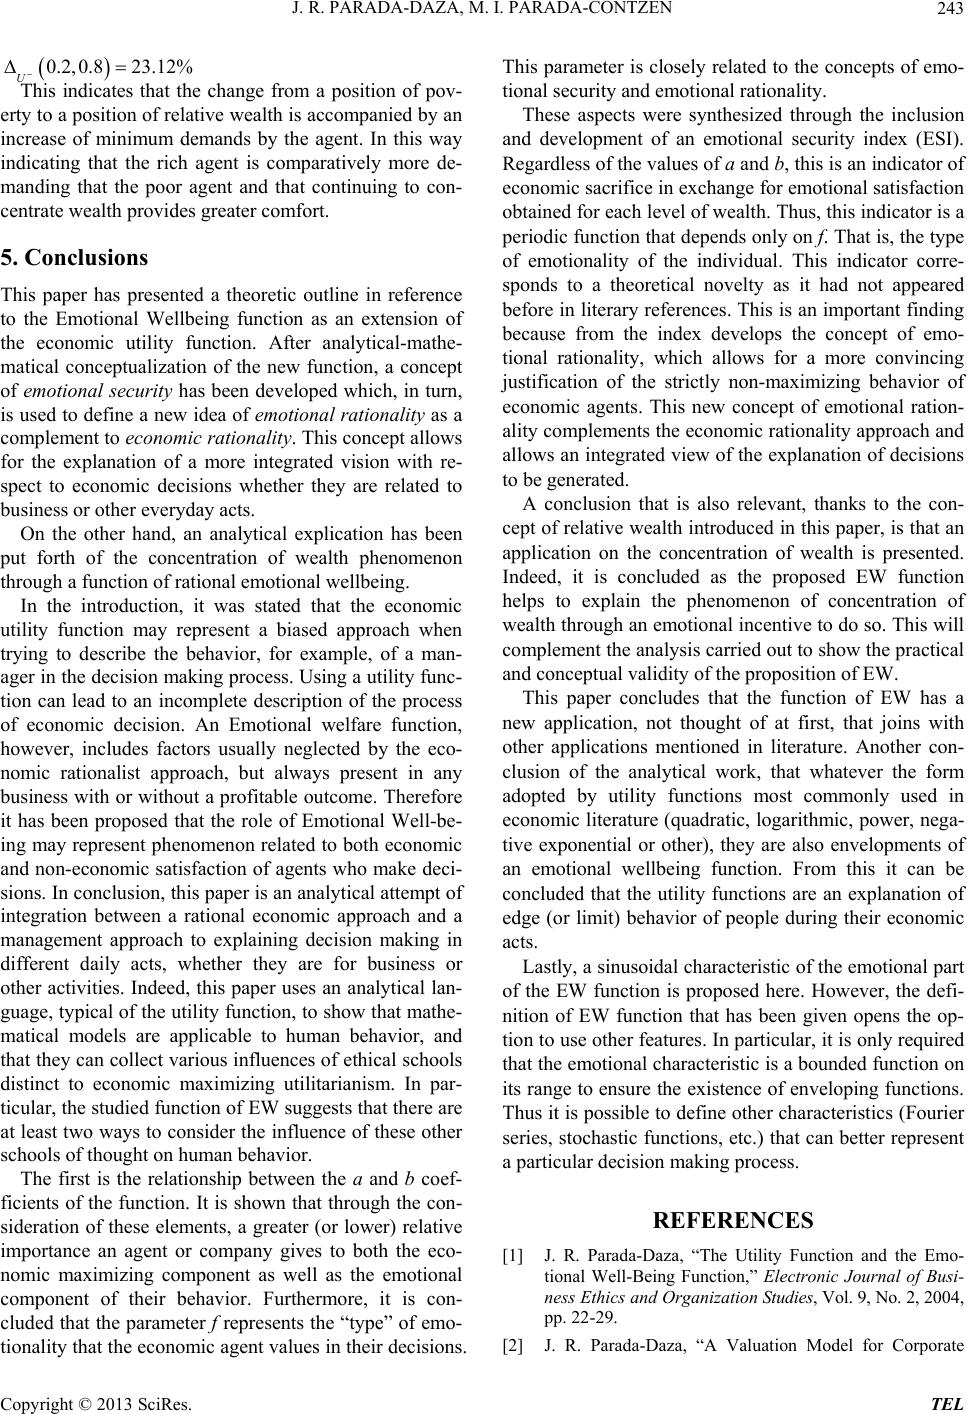 J. R. PARADA-DAZA, M. I. PARADA-CONTZEN 243 0.2,0.8 23.12% U This indicates that the change from a position of pov- erty to a position of relative wealth is accompanied by an increase of minimum demands by the agent. In this way indicating that the rich agent is comparatively more de- manding that the poor agent and that continuing to con- centrate wealth provides greater comfort. 5. Conclusions This paper has presented a theoretic outline in reference to the Emotional Wellbeing function as an extension of the economic utility function. After analytical-mathe- matical conceptualization of the new function, a concept of emotional security has been developed which, in turn, is used to define a new idea of emotional rationality as a complement to economic rationality. This concept allows for the explanation of a more integrated vision with re- spect to economic decisions whether they are related to business or other everyday acts. On the other hand, an analytical explication has been put forth of the concentration of wealth phenomenon through a function of rational emotional wellbeing. In the introduction, it was stated that the economic utility function may represent a biased approach when trying to describe the behavior, for example, of a man- ager in the decision making process. Using a utility func- tion can lead to an incomplete description of the process of economic decision. An Emotional welfare function, however, includes factors usually neglected by the eco- nomic rationalist approach, but always present in any business with or without a profitable outcome. Therefore it has been proposed that the role of Emotional Well-be- ing may represent phenomenon related to both economic and non-economic satisfaction of agents who make deci- sions. In conclusion, this paper is an analytical attempt of integration between a rational economic approach and a management approach to explaining decision making in different daily acts, whether they are for business or other activities. Indeed, this paper uses an analytical lan- guage, typical of the utility function, to show that mathe- matical models are applicable to human behavior, and that they can collect various influences of ethical schools distinct to economic maximizing utilitarianism. In par- ticular, the studied function of EW suggests that there are at least two ways to consider the influence of these other schools of thought on human behavior. The first is the relationship between the a and b coef- ficients of the function. It is shown that through the con- sideration of these elements, a greater (or lower) relative importance an agent or company gives to both the eco- nomic maximizing component as well as the emotional component of their behavior. Furthermore, it is con- cluded that the parameter f represents the “type” of emo- tionality that the economic agent values in their decisions. This parameter is closely related to the concepts of emo- tional security and emotional rationality. These aspects were synthesized through the inclusion and development of an emotional security index (ESI). Regardless of the values of a and b, this is an indicator of economic sacrifice in exchange for emotional satisfaction obtained for each level of wealth. Thus, this indicator is a periodic function that depends only on f. That is, the type of emotionality of the individual. This indicator corre- sponds to a theoretical novelty as it had not appeared before in literary references. This is an important finding because from the index develops the concept of emo- tional rationality, which allows for a more convincing justification of the strictly non-maximizing behavior of economic agents. This new concept of emotional ration- ality complements the economic rationality approach and allows an integrated view of the explanation of decisions to be generated. A conclusion that is also relevant, thanks to the con- cept of relative wealth introduced in this paper, is that an application on the concentration of wealth is presented. Indeed, it is concluded as the proposed EW function helps to explain the phenomenon of concentration of wealth through an emotional incentive to do so. This will complement the analysis carried out to show the practical and conceptual validity of the proposition of EW. This paper concludes that the function of EW has a new application, not thought of at first, that joins with other applications mentioned in literature. Another con- clusion of the analytical work, that whatever the form adopted by utility functions most commonly used in economic literature (quadratic, logarithmic, power, nega- tive exponential or other), they are also envelopments of an emotional wellbeing function. From this it can be concluded that the utility functions are an explanation of edge (or limit) behavior of people during their economic acts. Lastly, a sinusoidal characteristic of the emotional part of the EW function is proposed here. However, the defi- nition of EW function that has been given opens the op- tion to use other features. In particular, it is only required that the emotional characteristic is a bounded function on its range to ensure the existence of enveloping functions. Thus it is possible to define other characteristics (Fourier series, stochastic functions, etc.) that can better represent a particular decision making process. REFERENCES [1] J. R. Parada-Daza, “The Utility Function and the Emo- tional Well-Being Function,” Electronic Journal of Busi- ness Ethics and Organization Studies, Vol. 9, No. 2, 2004, pp. 22-29. [2] J. R. Parada-Daza, “A Valuation Model for Corporate Copyright © 2013 SciRes. TEL  J. R. PARADA-DAZA, M. I. PARADA-CONTZEN Copyright © 2013 SciRes. TEL 244 Social Responsibility,” Social Responsibility Journal, Vol. 5, No. 3. 2009, pp. 284-299. [3] P. Brilius, “Economic Crisis and SMES Sustainability Po- licies: Application of Emotional Well-Being Function for Analysis,” Journal of Advanced Research in Management, Vol. 1, No. 1, 2010, pp. 16-29. [4] J. R. Parada-Daza, “Economic Ethics and Emotional Well-Being,” Journal of Behavioral Studies in Business, Vol. 6, No. 1, 2012, pp. 1-12. [5] T. E. Copeland and J. F. Weston, “Finantial Theory and Corporate Policy,” 3rd Edition, Addison-Wesley Publish- ing Company, New York, 1992, p. 89. [6] J. M. Marín and G. Rubio, “Economía Financiera,” Antoni Bosch Editor, Barcelona, 2001, pp. 777-781. [7] R. Merton, “Continuous-Time Finance,” Blackwell Pub- lishers Ltd., Oxford, 1996, p. 138. [8] R. Jarrow, “Finance Theory,” Prentice-Hall International Editions, Upper Saddle River, 1988, p. 199. [9] W. F. Sharpe, “Teoría de Cartera y del Mercado de Capitales,” Ediciones Deusto S.A., Bilbao,1976, p. 237. [10] J.-J. Laffont, “The Economics of Uncertainty and Infor- mation,” The MIT Press, Cambridge, 1995, p. 8. [11] C. D. Carroll, “Why Do the Rich Save Much?” The Johns Hopkins University, Baltimore, 1998. [12] J. Robinson, “Economic Philosophy,” Aldine, Chicago, 1962. [13] G. Debreu, “La Théorie de la Valeur,” Dunod, Paris, 1966. [14] H. Markowitz, “Portfolio Selection,” Yale University Press, New Haven, 1959. [15] J. W. Pratt, “Risk Aversion in the Small and in the Large,” Econometrica, Vol. 32, No. 1-2, 1964, pp. 122-136. doi:10.2307/1913738 [16] J. Ait-Sahalia and M. Brandt, “Variable Selection for Port- folio Choise,” National Bureau of Economic Research (NBER), 2001. [17] A. Ang, G. Bekaert and J. Liu, “Why Stocks May Disap- point?” EFA 0669, 2000. [18] R. Mehra and E. Prescott, “The Equity Premium: A Puz- zle,” Journal of Monetary Economy, Vol. 15, No. 2, 1985, pp. 145-161. doi:10.1016/0304-3932(85)90061-3 [19] I. Friend and M. Blume, “The Demand for Risky Assets,” American Economic Review, Vol. 65, No. 5, 1975, pp. 900-922. [20] S. Hwang and S. Satchell, “Valuing Information Using Utility Functions: How Much Should We Pay for Lineal Factor Model?” The European Journal of Finance, Vol. 11, No. 1, 2005, pp. 1-16. doi:10.1080/1351847042000286630 [21] H. Inhaber and S. Carroll, “How Rich Is Too Rich? In- come and Wealth in America,” Prarger Publisher, New York, 1992. [22] J. C. T. Mao, “Quatitative Analysis of Financial Decision,” The Macmillan Co., New York, 1969. [23] B. Demidovich, “Análisis Matemático,” Undécima Edi- ción, Edit Paraninfo, Madrid, 1993, p. 247.
|