Paper Menu >>
Journal Menu >>
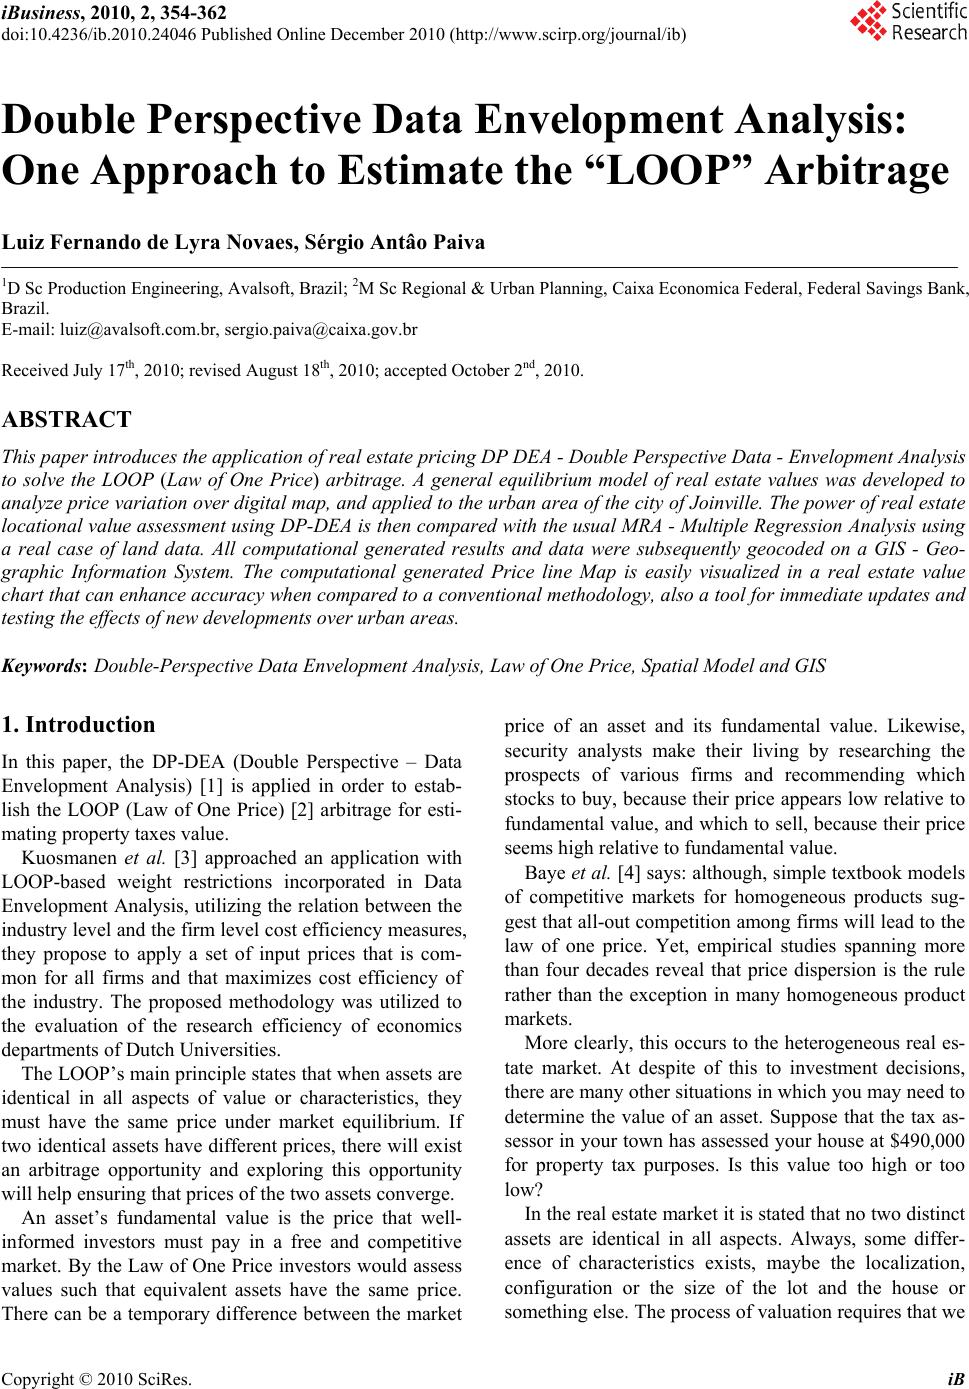 iBusiness, 2010, 2, 354-362 doi:10.4236/ib.2010.24046 Published Online December 2010 (http://www.scirp.org/journal/ib) Copyright © 2010 SciRes. iB Double Perspective Data Envelopment Analysis: One Approach to Estimate the “LOOP” Arbitrage Luiz Fernando de Lyra Novaes, Sérgio Antâo Paiva 1D Sc Production Engineering, Avalsoft, Brazil; 2M Sc Regional & Urban Planning, Caixa Economica Federal, Federal Savings Bank, Brazil. E-mail: luiz@avalsoft.com.br, sergio.paiva@caixa.gov.br Received July 17th, 2010; revised August 18th, 2010; accepted October 2nd, 2010. ABSTRACT This paper introduces the application of real estate pricing DP DEA - Double Perspective Data - Envelopment Analysis to solve the LOOP (Law of One Price) arbitrage. A general equilibrium model of real estate values was developed to analyze price variation over digital map, and applied to the urban area of the city of Joinville. The power of real estate locational value assessment using DP-DEA is then compared with the usual MRA - Multiple Regression Analysis using a real case of land data. All computational generated results and data were subsequently geocoded on a GIS - Geo- graphic Information System. The computational generated Price line Map is easily visualized in a real estate value chart that can enhance accuracy when compared to a conventional methodology, also a tool for immediate updates and testing the effects of new developments over urban areas. Keywords: Double-Perspective Data Envelopment Analysis, Law of One Price, Spatial Model and GIS 1. Introduction In this paper, the DP-DEA (Double Perspective – Data Envelopment Analysis) [1] is applied in order to estab- lish the LOOP (Law of One Price) [2] arbitrage for esti- mating property taxes value. Kuosmanen et al. [3] approached an application with LOOP-based weight restrictions incorporated in Data Envelopment Analysis, utilizing the relation between the industry level and the firm level cost efficiency measures, they propose to apply a set of input prices that is com- mon for all firms and that maximizes cost efficiency of the industry. The proposed methodology was utilized to the evaluation of the research efficiency of economics departments of Dutch Universities. The LOOP’s main principle states that when assets are identical in all aspects of value or characteristics, they must have the same price under market equilibrium. If two identical assets have different prices, there will exist an arbitrage opportunity and exploring this opportunity will help ensuring that prices of the two assets converge. An asset’s fundamental value is the price that well- informed investors must pay in a free and competitive market. By the Law of One Price investors would assess values such that equivalent assets have the same price. There can be a temporary difference between the market price of an asset and its fundamental value. Likewise, security analysts make their living by researching the prospects of various firms and recommending which stocks to buy, because their price appears low relative to fundamental value, and which to sell, because their price seems high relative to fundamental value. Baye et al. [4] says: although, simple textbook models of competitive markets for homogeneous products sug- gest that all-out competition among firms will lead to the law of one price. Yet, empirical studies spanning more than four decades reveal that price dispersion is the rule rather than the exception in many homogeneous product markets. More clearly, this occurs to the heterogeneous real es- tate market. At despite of this to investment decisions, there are many other situations in which you may need to determine the value of an asset. Suppose that the tax as- sessor in your town has assessed your house at $490,000 for property tax purposes. Is this value too high or too low? In the real estate market it is stated that no two distinct assets are identical in all aspects. Always, some differ- ence of characteristics exists, maybe the localization, configuration or the size of the lot and the house or something else. The process of valuation requires that we  Double Perspective Data Envelopment Analysis: One Approach to Estimate the “LOOP” Arbitrage Copyright © 2010 SciRes. iB 355 find assets comparable to the one whose value we want to estimate, and make judgments about which differences are important on their value to investors. This specific market equilibrium point is achievable when buyer and seller engaged in a dispute have attended their own in- terests of all kinds on the value of a specific real estate. Valuation information is fundamental to financial de- cision-making. Our goal in real estate assessment is to estimate a value of a spread range between the maximum value and the minimum value offered or bided in an effi- cient property market. 2. Tax Assessment The Direct Capital Comparison (DCC) is the most con- ventional method used in real estate value appraisal (see Mackmin (1994), for instance). DCC requires an “al- lowance in money terms” (Lewis (1999)) for any differ- ences between the subject property and the comparable properties, for which the appraiser can employ either multiple regression analysis (MRA), expert systems (ES) or artificial neural networks (ANN). The most usual me- thod established is the MRA that’s diffused between the professional’s experts. The tax assessment problem consists in establishing a mean value of tax that will apply over different proper- ties. Nowadays, in spatial models DCC and GIS data basis are used. The question is to consider valuing a house using the observed prices of comparable houses. Suppose that you own a house and that each year you pay property taxes to the local town council, which are computed as a propor- tion of the house estimated market value. You have just received a notice from the town’s real estate assessor notifying you that the estimated market value of your house this year is $ 490,000. Suppose that your next-door neighbors just sold a house identical to yours for $ 330,000. You could justi- fiably appeal the town’s assessment of $ 490,000 for the value of your house being too high, on the grounds that a house virtually identical to yours was just sold for a price $ 160,000 less than your assessed value. In the valuation of your house, you are applying the Law of One Price, considering that if you were to put the house up for sale, you are implying that your expectation is that it would fetch a price of $330,000 because a com- parable house just sold for that amount. Of course, the house next door is not exactly identical to yours because it is not located on your lot but on the one next to it. And you probably cannot prove that if you actually put your house up for sale it would fetch only $ 330,000 rather than the $ 490,000 that the town’s asses- sor says it is worth. Nonetheless, unless the town’s as- sessor can point to some economically relevant feature of your house that would make it worth $ 160,000 more than your neighbor’s house (such as more land or floor space), you would have a strong logical case (and proba- bly a strong legal case, too) for appealing the town’s as- sessment. The point is that even when the force of arbitrage cannot be relied on to enforce the Law of One Price, we still rely on its logic to value assets. But how did the assessor place a value on your house? Because you will have to pay taxes based on his assess- ment, the assessor must choose a valuation method that is perceived as fair and accurate. Valuation models used in real estate assessment vary significantly in their level of complexity and mathematical sophistication. Property tax, or millage tax, is an ad valorem tax that an owner is required to pay on the value of the property being taxed. Property tax can be defined as generally, tax imposed by municipalities upon owners of property within their jurisdiction based on the value of such prop- erty. There are three species or types of property: Land, Improvements to Land (immovable manmade objects; i.e., buildings), and Personal (movable manmade objects). Real estate, real property or realty is all terms for the combination of land and improvements. The taxing au- thority requires and/or performs an appraisal of the mon- etary value of the property, and tax is assessed in propor- tion to that value. Forms of property tax used vary be- tween countries and jurisdictions. The property tax (ad valorem tax) relies upon the fair market value of the property being taxed for justification. In Brazil, it's often given to property tax a value per square meter. To calculate the property tax for a lot, the authority will multiply the assessed unit tax value of the property by its area. We developed a LOOP DP DEA on a Spatial Model to a housing data set from Joinville, Santa Catarina, Brazil. The County Department is responsible for complying with Brazilian fiscal responsibility law that improves public finance rules while enforcing responsibility in fiscal management. That presumes well-planned and transparent actions to prevent social risk and correct de- viations that may affect the equilibrium of public ac- counts. This law is a major obligation to be achieved. In that way, the town’s assessors have to establish equitable and fair values to different real estates. 3. LOOP/DP-DEA A new approach is being proposed to solve LOOP arbi- trage, where the uncertainty in the unit’s value resulting from market transactions was taken into account by ex- plicitly representing the economic agents involved in a transaction, namely buyer and seller, whose actions es- tablish a set of transactions. Because of its non-linear  Double Perspective Data Envelopment Analysis: One Approach to Estimate the “LOOP” Arbitrage Copyright © 2010 SciRes. iB 356 structure, the proposed method performs better than re- gression analysis, in terms of adhering to data informa- tion, as shown in Subsection 3.2. Concerning ES and ANN, the new method overcomes an important weak- ness, as it offers model parameters, i.e., the weights as- signed to each input, thus facilitating the cognitive rea- soning process. However, the major advantage of this method consists in supplying a reference set for com- parison with the assessed property, a characteristic di- rectly linked to DCC philosophy and which is not pro- vided by any other method so far. The methodology to achieve this was named Law of One Price by Double Perspective-Data Envelopment Analysis (LOOP/DP-DEA). The DP-DEA makes use of two encapsulating surfaces that enfold, in an n-dimen- sional space, all the observed data. Real estate units which, from the point of view of either the seller or the buyer, present an “efficient” price, define those surfaces. The remaining units can have their value assessed by taking the envelopments as frameworks, under an out- put-oriented or an input-oriented DEA model. The LOOP/DP-DEA is the market value estimated between the two encapsulating surfaces, which minimize the me- dian absolute deviation of the whole distribution. This methodology intends to make a contribution to the real estate community in three different ways: firstly, by introducing the concept of the LOOP/DP-DEA used to estimate the fundamental value; secondly, by showing how this concept can be applied in real terms, namely the real estate value assessment problem; and thirdly by suggesting that the idea of the two enveloping surfaces can be brought to the more general context of economic/ financial transactions, taxation, urban planning or even auctions. The specific application of DP-DEA to real estate tax assessment can have wide impact in county public insti- tutions involved on regulation and taxation, dealing with many daily decisions concerning county administration. If a more precise tool is available, these institutions would be able to achieve a much more reliable portfolio of taxation and, therefore, attending a well-planned pub- lic administration. In recent years, GIS has established itself as an inte- gral component of business improvement programs at government agencies and utilities, it has sparked flashes of interest from the utility of visualizing the analysis re- sults. In that way, assuring for the analyst a powerful instrument to better understood. New emphasis on reen- gineering bodes well for commercial GIS, however, and this trend could trigger GIS’ ascent to a more prominent spot in corporate decision-making tools in Brazil. On this propose we apply the value estimation made by MRA, DP-DEA and real estate data over a geographic data ba- sis of Joinville and analyze them comparatively. The comparison of each estimated isolines formed by the regions with the same taxes value per square meter. The isolines join points of equal value on a surface geo- graphic map. The shading defines bands between two succeeding isolines. In our study case, they decrease of value on the inside to the outside of the map. 3.1. Double Perspective DEA Model – DP-DEA The DEA method is used to accomplish comparative analyses of a set of observations. For each observed unit, either a State in a national economy or a simple piece of equipment, it provides a measure of efficiency or pro- ductivity. DEA is a generalization of the nonparametric method of productivity measurement originally devel- oped by Farrell [5]. The first classical DEA model was the CCR proposed by Charnes, Cooper and Rhodes [6], also known as CRS because it assumes Constant Returns to Scale. The sec- ond one was the BCC introduced by Banker, Charnes and Cooper [7], or VRS, as it postulates Variable Returns to Scale. Shortly, the method works as follows [8]. Some applications and integration perspectives in Decision Support Theory may be seen in Lins et Meza [9]. The DP-DEA is an extension of Data Envelopment Analysis [10]. This approach has been able to assess a particular real estate, or for a general assessment, esti- mated by market’s data. The mathematical formulation of the DP-DEA method makes it possible to obtain an interval for a property’s value as a function of its physi- cal features and location, as proposed by Novaes [1]. In this paper the DP-DEA method was applied to a database consisting of the market values of lots that were established in real estate transactions or offers, and which have occurred in several neighborhoods in the city of Joinville. This data basis was been performed by the Joinville Municipal Treasurer Department. The buy and sell bids for the different units define the supply and de- mand possibilities as a function of the commodities’ at- tributes [11]. Double Perspective DEA (DP-DEA) uses as an objec- tive measure of the observed units the normalized dis- tance to the two simultaneous perspectives: the hyper planes by maximization of outputs and by the minimiza- tion of inputs, in such a way that inputs under a buyer’s perspective are the outputs under the seller’s perspective and vice-versa. Property value is the dependent variable estimated by the MRA method when applied to real es- tate assessment. Analogously, in LOOP DP-DEA we will estimate the dependent variable, which is the property value: the monetary amount received (output of the transaction on a seller’s perspective) and the monetary amount paid (input of the transaction on a buyer’s per-  Double Perspective Data Envelopment Analysis: One Approach to Estimate the “LOOP” Arbitrage Copyright © 2010 SciRes. iB 357 spective). The property’s physical features are the input of the transaction on seller’s perspective and the output of the transaction on buyer’s perspective. In LOOP DP-DEA, like in MRA method, they are the independent variables. The method employs both classical CRS and VRS DEA models. Starting from the selection of n observed real estate data, with m independents variables like lo- calization and s dependent variable, a DP-DEA model determines a subset composed of k data that belongs to the perspective’s enveloping surface. These data are considered the best to attend one or other perspective and define the segments of the enveloping surface, thus motivating the envelope form of DEA CCR or BCC models. The contained subset, not belonging to this surface, is formed by the remaining n - k inefficient data to each perspective. The computation of the nor- malized distance of each observed unit requires the so- lution of a linear programming problem. To estimate the value of the dependent variable, we have to multiply the observed value by the result Z of equation 28 which minimizes the median absolute deviation of the whole distribution. The formulation of DP-DEA in their dual multipli- ers/envelope output-oriented is the same of the both clas- sical CCR and BCC DEA models, shown in Table 1. In the multipliers model, the optimal values of the decision variables: v, u and u0* are the parameters of the frontier hyper plane defined by the constraints (3). They are finding such that the distance measure for observed data Table 1. Output-oriented CCR and BCC models. Multipliers (Primal) * 000 1 m ii i Min Lxu (1) 0 1 1 s rr r Subject toy (2) * 0 11 01,..., sm rrj iij ri yxu jn (3) ,1,......, ,1,...., ri rs im (4) ,0,, ir ir (5) ** 00 :0 : F orCCR uForBCC u unconstrained (6) Envelopment (Dual) 11 sr SSy x yx M ax Hhss (7) 0 1 0, 1,......, n Srjrj r j Subject tohyysrs (8) 0 1 0, 1,......, n iJiji j x xs im (9) ,,0, ,, jri s skji (10) 1 :1 n j j For BCC (11) “O” is minimized. This distance can be defined as a pro- gramming problem that minimize the linear combination of its independents variables (1) subject to the constraints: the normalized linear combination of its dependents variables (2) and that all distance measures must be plus than or equal to one (3). Non-Archimedean constrained multipliers (4) can be a substitute for classical positive constrained multipliers (5), where is an infinitesimal (non-Archimedean) amount. According to the envelope form, the problem consists of maximizing the objective function (7) on the decision variable h S (1/h S represents the normalized distance to the hyper-plane) subject to constraints (8) to (11). These constraints guarantee that the projected efficient unit in seller’s perspective will be located inside the production or demand possibilities set, which is defined as a linear combination of the outputs (and inputs) vectors, using the coefficient vector. In accordance to the BCC assump- tions, this linear combination should be subjected to a convex constraint (11), which does not hold in the CCR model. The inclusion of this latter constraint in BCC corresponds to an unconstrained dual variable (6) in the multipliers model. Analogously, to the classical input-oriented dual mul- tipliers/envelope CCR and BCC models the variables and constraints are quite similar; the main difference being that in the multipliers model the objective is to maximize the linear combination of the outputs of the observed data, keeping the independent variables normalization constraint. As for the envelope form, the variable h is to be reduced, and multiplied by the input of the assessed (observed) unit [6,7]. As Figures 1 and 2 illustrate, considering only one input and one output (either the maximum or the mini- mum values of the units’ sale and only one attribute, i.e., their areas). In order to simultaneously use both input and output oriented models, we will transpose the graph of the input- Figure 1. Output-oriented model. 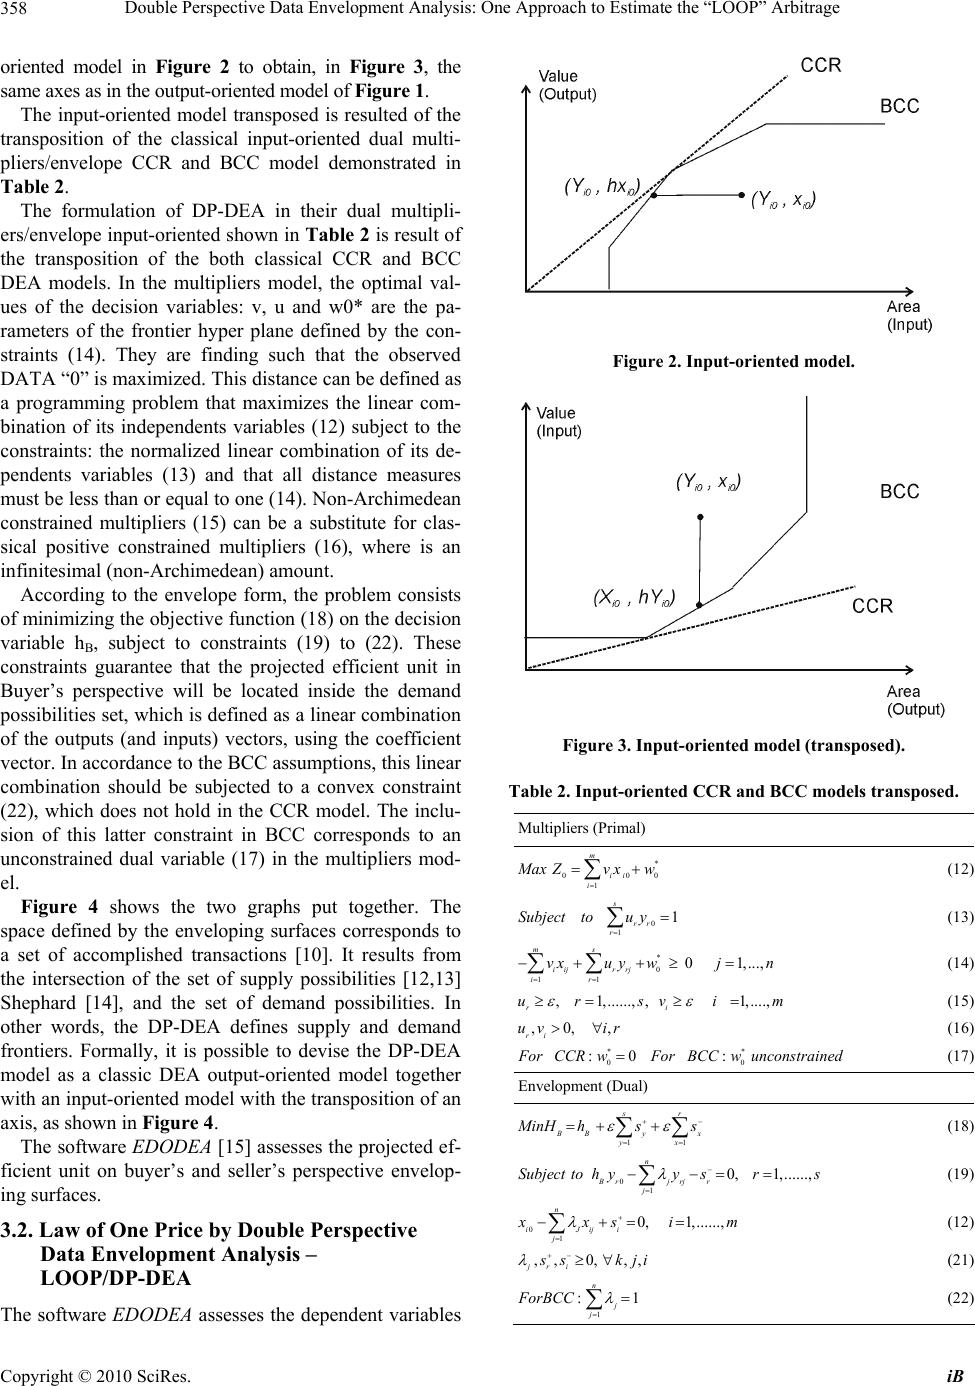 Double Perspective Data Envelopment Analysis: One Approach to Estimate the “LOOP” Arbitrage Copyright © 2010 SciRes. iB 358 oriented model in Figure 2 to obtain, in Figure 3, the same axes as in the output-oriented model of Figure 1. The input-oriented model transposed is resulted of the transposition of the classical input-oriented dual multi- pliers/envelope CCR and BCC model demonstrated in Table 2. The formulation of DP-DEA in their dual multipli- ers/envelope input-oriented shown in Table 2 is result of the transposition of the both classical CCR and BCC DEA models. In the multipliers model, the optimal val- ues of the decision variables: v, u and w0* are the pa- rameters of the frontier hyper plane defined by the con- straints (14). They are finding such that the observed DATA “0” is maximized. This distance can be defined as a programming problem that maximizes the linear com- bination of its independents variables (12) subject to the constraints: the normalized linear combination of its de- pendents variables (13) and that all distance measures must be less than or equal to one (14). Non-Archimedean constrained multipliers (15) can be a substitute for clas- sical positive constrained multipliers (16), where is an infinitesimal (non-Archimedean) amount. According to the envelope form, the problem consists of minimizing the objective function (18) on the decision variable hB, subject to constraints (19) to (22). These constraints guarantee that the projected efficient unit in Buyer’s perspective will be located inside the demand possibilities set, which is defined as a linear combination of the outputs (and inputs) vectors, using the coefficient vector. In accordance to the BCC assumptions, this linear combination should be subjected to a convex constraint (22), which does not hold in the CCR model. The inclu- sion of this latter constraint in BCC corresponds to an unconstrained dual variable (17) in the multipliers mod- el. Figure 4 shows the two graphs put together. The space defined by the enveloping surfaces corresponds to a set of accomplished transactions [10]. It results from the intersection of the set of supply possibilities [12,13] Shephard [14], and the set of demand possibilities. In other words, the DP-DEA defines supply and demand frontiers. Formally, it is possible to devise the DP-DEA model as a classic DEA output-oriented model together with an input-oriented model with the transposition of an axis, as shown in Figure 4. The software EDODEA [15] assesses the projected ef- ficient unit on buyer’s and seller’s perspective envelop- ing surfaces. 3.2. Law of One Price by Double Perspective Data Envelopment Analysis – LOOP/DP-DEA The software EDODEA assesses the dependent variables Figure 2. Input-oriented model. Figure 3. Input-oriented model (transposed). Table 2. Input-oriented CCR and BCC models transposed. Multipliers (Primal) * 000 1 m ii i MaxZv xw (12) 0 1 1 s rr r Subjecttou y (13) * 0 11 01,..., ms iijr rj ir vxuywjn (14) ,1,......, ,1,...., ri ursvi m (15) ,0, , ri uv ir (16) ** 00 :0 : F orCCRwForBCCw unconstrained (17) Envelopment (Dual) 11 sr BBy x yx M inH hss (18) 0 1 0, 1,......, n Brjrj r j Subject tohyysrs (19) 0 1 0, 1,......, n iJiji j x xs im (12) ,,0, ,, jri s skji (21) 1 :1 n j j ForBCC (22) 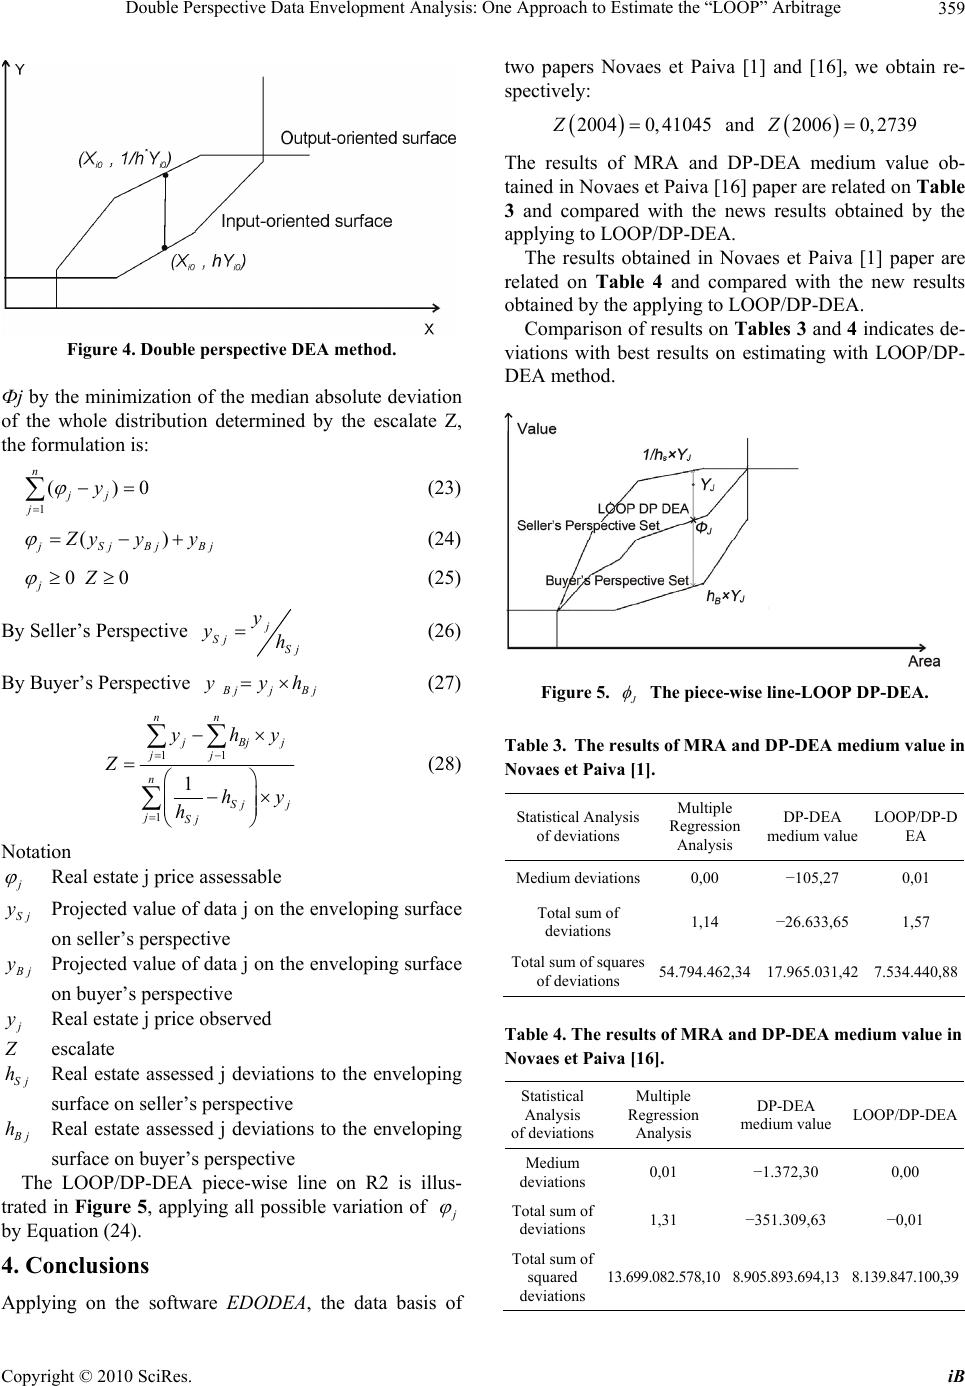 Double Perspective Data Envelopment Analysis: One Approach to Estimate the “LOOP” Arbitrage Copyright © 2010 SciRes. iB 359 Figure 4. Double perspective DEA method. Фj by the minimization of the median absolute deviation of the whole distribution determined by the escalate Z, the formulation is: 1 ()0 n jj j y (23) () j Sj BjBj Z yy y (24) 00 jZ (25) By Seller’s Perspective j Sj Sj y yh (26) By Buyer’s Perspective B jjBj yyh (27) 11 1 1 nn j Bj j jj n Sj j jSj yhy Z hy h (28) Notation j Real estate j price assessable Sj y Projected value of data j on the enveloping surface on seller’s perspective B j y Projected value of data j on the enveloping surface on buyer’s perspective j y Real estate j price observed Z escalate Sj h Real estate assessed j deviations to the enveloping surface on seller’s perspective B j h Real estate assessed j deviations to the enveloping surface on buyer’s perspective The LOOP/DP-DEA piece-wise line on R2 is illus- trated in Figure 5, applying all possible variation of j by Equation (24). 4. Conclusions Applying on the software EDODEA, the data basis of two papers Novaes et Paiva [1] and [16], we obtain re- spectively: 2004 0,41045Z and 2006 0,2739Z The results of MRA and DP-DEA medium value ob- tained in Novaes et Paiva [16] paper are related on Table 3 and compared with the news results obtained by the applying to LOOP/DP-DEA. The results obtained in Novaes et Paiva [1] paper are related on Table 4 and compared with the new results obtained by the applying to LOOP/DP-DEA. Comparison of results on Tables 3 and 4 indicates de- viations with best results on estimating with LOOP/DP- DEA method. Figure 5. J The piece-wise line-LOOP DP-DEA. Table 3. The results of MRA and DP-DEA medium value in Novaes et Paiva [1]. Statistical Analysis of deviations Multiple Regression Analysis DP-DEA medium value LOOP/DP-D EA Medium deviations0,00 −105,27 0,01 Total sum of deviations 1,14 −26.633,65 1,57 Total sum of squares of deviations 54.794.462,34 17.965.031,42 7.534.440,88 Table 4. The results of MRA and DP-DEA medium value in Novaes et Paiva [16]. Statistical Analysis of deviations Multiple Regression Analysis DP-DEA medium value LOOP/DP-DEA Medium deviations 0,01 −1.372,30 0,00 Total sum of deviations 1,31 −351.309,63 −0,01 Total sum of squared deviations 13.699.082.578,10 8.905.893.694,13 8.139.847.100,39 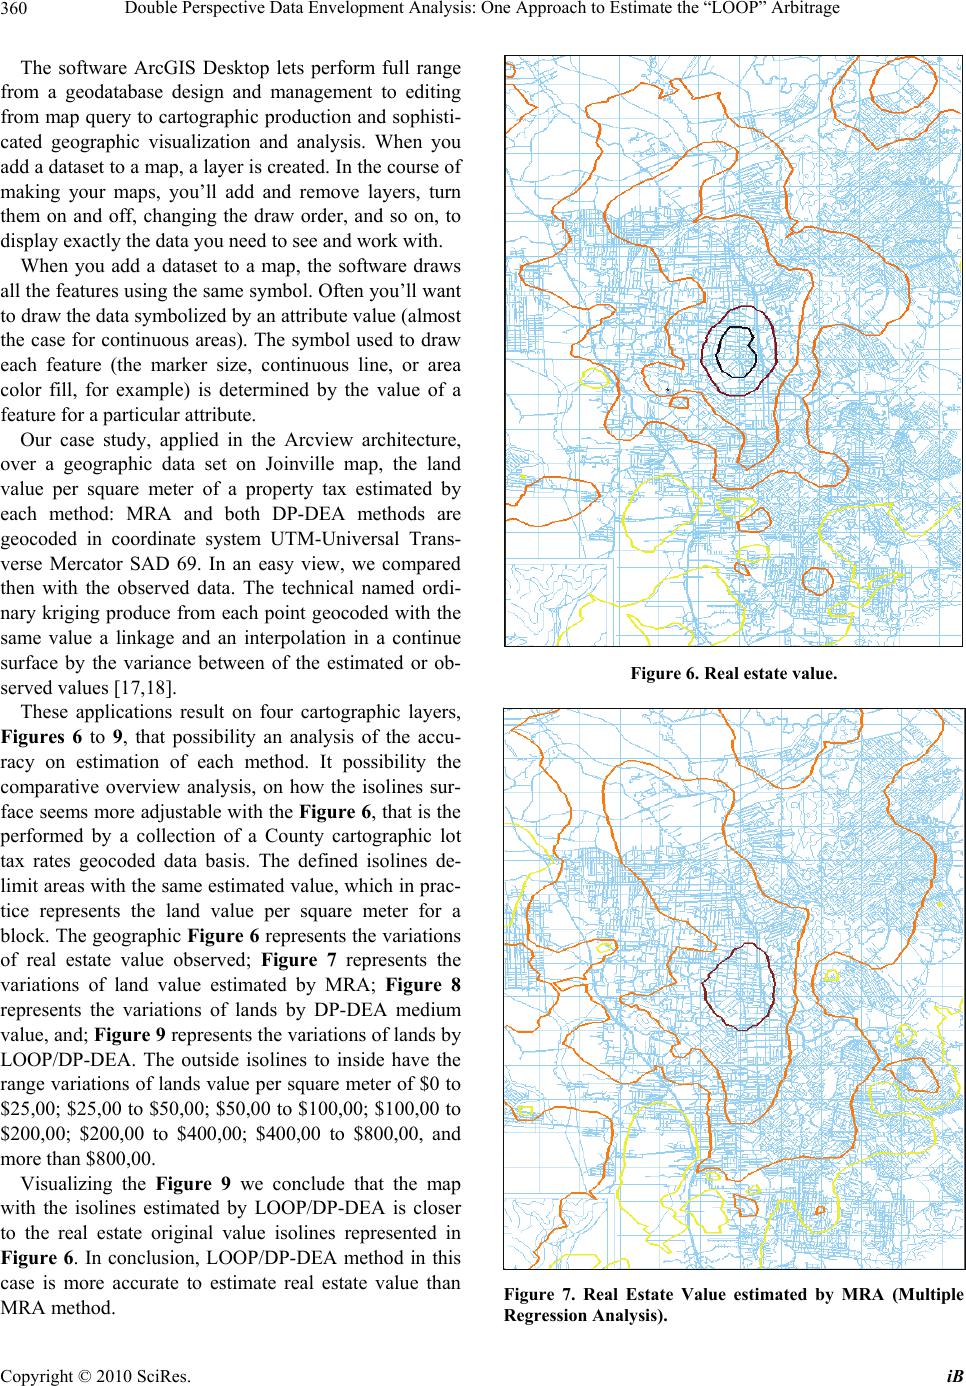 Double Perspective Data Envelopment Analysis: One Approach to Estimate the “LOOP” Arbitrage Copyright © 2010 SciRes. iB 360 The software ArcGIS Desktop lets perform full range from a geodatabase design and management to editing from map query to cartographic production and sophisti- cated geographic visualization and analysis. When you add a dataset to a map, a layer is created. In the course of making your maps, you’ll add and remove layers, turn them on and off, changing the draw order, and so on, to display exactly the data you need to see and work with. When you add a dataset to a map, the software draws all the features using the same symbol. Often you’ll want to draw the data symbolized by an attribute value (almost the case for continuous areas). The symbol used to draw each feature (the marker size, continuous line, or area color fill, for example) is determined by the value of a feature for a particular attribute. Our case study, applied in the Arcview architecture, over a geographic data set on Joinville map, the land value per square meter of a property tax estimated by each method: MRA and both DP-DEA methods are geocoded in coordinate system UTM-Universal Trans- verse Mercator SAD 69. In an easy view, we compared then with the observed data. The technical named ordi- nary kriging produce from each point geocoded with the same value a linkage and an interpolation in a continue surface by the variance between of the estimated or ob- served values [17,18]. These applications result on four cartographic layers, Figures 6 to 9, that possibility an analysis of the accu- racy on estimation of each method. It possibility the comparative overview analysis, on how the isolines sur- face seems more adjustable with the Figure 6, that is the performed by a collection of a County cartographic lot tax rates geocoded data basis. The defined isolines de- limit areas with the same estimated value, which in prac- tice represents the land value per square meter for a block. The geographic Figure 6 represents the variations of real estate value observed; Figure 7 represents the variations of land value estimated by MRA; Figure 8 represents the variations of lands by DP-DEA medium value, and; Figure 9 represents the variations of lands by LOOP/DP-DEA. The outside isolines to inside have the range variations of lands value per square meter of $0 to $25,00; $25,00 to $50,00; $50,00 to $100,00; $100,00 to $200,00; $200,00 to $400,00; $400,00 to $800,00, and more than $800,00. Visualizing the Figure 9 we conclude that the map with the isolines estimated by LOOP/DP-DEA is closer to the real estate original value isolines represented in Figure 6. In conclusion, LOOP/DP-DEA method in this case is more accurate to estimate real estate value than MRA method. Figure 6. Real estate value. Figure 7. Real Estate Value estimated by MRA (Multiple Regression Analysis). 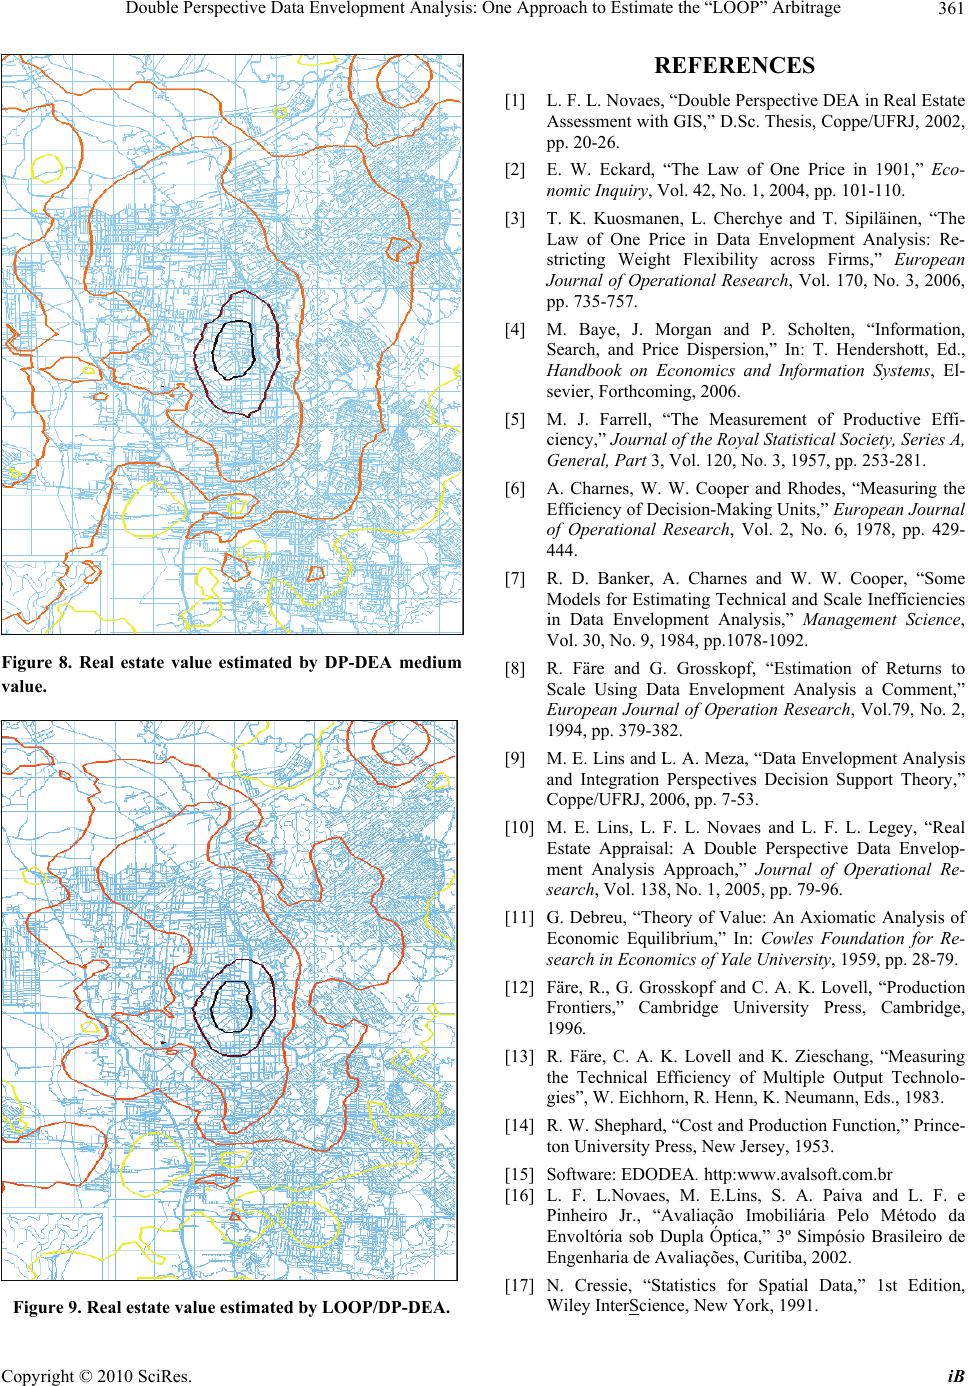 Double Perspective Data Envelopment Analysis: One Approach to Estimate the “LOOP” Arbitrage Copyright © 2010 SciRes. iB 361 Figure 8. Real estate value estimated by DP-DEA medium value. Figure 9. Real estate value estimated by LOOP/DP-DEA. REFERENCES [1] L. F. L. Novaes, “Double Perspective DEA in Real Estate Assessment with GIS,” D.Sc. Thesis, Coppe/UFRJ, 2002, pp. 20-26. [2] E. W. Eckard, “The Law of One Price in 1901,” Eco- nomic Inquiry, Vol. 42, No. 1, 2004, pp. 101-110. [3] T. K. Kuosmanen, L. Cherchye and T. Sipiläinen, “The Law of One Price in Data Envelopment Analysis: Re- stricting Weight Flexibility across Firms,” European Journal of Operational Research, Vol. 170, No. 3, 2006, pp. 735-757. [4] M. Baye, J. Morgan and P. Scholten, “Information, Search, and Price Dispersion,” In: T. Hendershott, Ed., Handbook on Economics and Information Systems, El- sevier, Forthcoming, 2006. [5] M. J. Farrell, “The Measurement of Productive Effi- ciency,” Journal of the Royal Statistical Society, Series A, General, Part 3, Vol. 120, No. 3, 1957, pp. 253-281. [6] A. Charnes, W. W. Cooper and Rhodes, “Measuring the Efficiency of Decision-Making Units,” European Journal of Operational Research, Vol. 2, No. 6, 1978, pp. 429- 444. [7] R. D. Banker, A. Charnes and W. W. Cooper, “Some Models for Estimating Technical and Scale Inefficiencies in Data Envelopment Analysis,” Management Science, Vol. 30, No. 9, 1984, pp.1078-1092. [8] R. Färe and G. Grosskopf, “Estimation of Returns to Scale Using Data Envelopment Analysis a Comment,” European Journal of Operation Research, Vol.79, No. 2, 1994, pp. 379-382. [9] M. E. Lins and L. A. Meza, “Data Envelopment Analysis and Integration Perspectives Decision Support Theory,” Coppe/UFRJ, 2006, pp. 7-53. [10] M. E. Lins, L. F. L. Novaes and L. F. L. Legey, “Real Estate Appraisal: A Double Perspective Data Envelop- ment Analysis Approach,” Journal of Operational Re- search, Vol. 138, No. 1, 2005, pp. 79-96. [11] G. Debreu, “Theory of Value: An Axiomatic Analysis of Economic Equilibrium,” In: Cowles Foundation for Re- search in Economics of Yale University, 1959, pp. 28-79. [12] Färe, R., G. Grosskopf and C. A. K. Lovell, “Production Frontiers,” Cambridge University Press, Cambridge, 1996. [13] R. Färe, C. A. K. Lovell and K. Zieschang, “Measuring the Technical Efficiency of Multiple Output Technolo- gies”, W. Eichhorn, R. Henn, K. Neumann, Eds., 1983. [14] R. W. Shephard, “Cost and Production Function,” Prince- ton University Press, New Jersey, 1953. [15] Software: EDODEA. http:www.avalsoft.com.br [16] L. F. L.Novaes, M. E.Lins, S. A. Paiva and L. F. e Pinheiro Jr., “Avaliação Imobiliária Pelo Método da Envoltória sob Dupla Óptica,” 3º Simpósio Brasileiro de Engenharia de Avaliações, Curitiba, 2002. [17] N. Cressie, “Statistics for Spatial Data,” 1st Edition, Wiley InterScience, New York, 1991.  Double Perspective Data Envelopment Analysis: One Approach to Estimate the “LOOP” Arbitrage Copyright © 2010 SciRes. iB 362 [18] E. H. Isaaks and R. M. Shrivastava, “Applied Geostatis- tics,” 1th Edition, Oxford University Press, New York, 1989. |