Engineering, 2013, 5, 622-628
http://dx.doi.org/10.4236/eng.2013.57074 Published Online July 2013 (http://www.scirp.org/journal/eng)
Study on Technical Measures of Romashkino Oil Field
after En t er ing Ultra-High Water Cut Sta ge
Liuli Lu1,2, Zhibin Liu1, Haohan Liu1,3*, Yongqin Yan1
1School of Graduate of Southwest Petroleum University, Chengdu, China
2Geological Exploration and Development Institute of Chuanqing Drilling Engineering Co., Ltd., Chengdu, China
3Sichuan College of Architectural Technology, Deyang, China
Email: *tsinghua616@163.com
Received May 6, 2012; revised June 6, 2013; accepted June 14, 2013
Copyright © 2013 Liuli Lu et al. This is an open access article distributed under the Creative Commons Attribution License, which
permits unrestricted use, distribution, and reproduction in any medium, provided the original work is properly cited.
ABSTRACT
Romashkino oil field has large oilfield area, small formation dip, many reservoir layers, wide oil-water transition zone
and complicated sedimentary environment. Since development, 3 overall development plannings and adjustments of
individual block have been established. This achieves a high oil production. However, the recoverable reserves of major
oil layer with high production become smaller and smaller and the water cut increases over time, the production ability
of oil layer decreases. The development status of oil layer of mining siltstone, oil-water transition zone and oil layer
with upswept injected water cannot be changed under present dilute well network condition, because there is no rein-
forced measurement to water well. This results the low oil production of Romashkino oil field. In order to improve oil
production rate and reach the designed oil recovery, Romashkino oil field has been implemented many added cuttings
since development. Resent researches about Romashkino oil field show: in later oilfield development stage, sidetrack
and lateral drilling horizontal wells technology is very reasonable; formation hydraulic fracturing technology has been
widely used in recent years; in tertiary oil recovery, sweep efficiency and flooding efficiency related technologies have
been taken. This offers reference and guidance for the effective and reasonable oil field development in later period.
Keywords: Romashkino Oil Field; Geological; Development; Technical Measures
1. Introduction
Romashkino oil field lies in Tatarsta. It was found in
1948, and began industrial development in 1952. In 1954,
Romashkino oil field began to inject water and it was a
typical multi-layer oil field [1,2]. The oily area of Ro-
mashkino oil field is 4255 km2, geological reserves is 45
× 108 m3, the recoverable reserves is 24 × 1088 m3, and
the oil recovery is 53% [3,4]. At present, this oilfield is
in the production decline stage. In 1997, the crude oil
production of Romashkino oil field is 1500 × 104 m3, the
water cut is 0.88, the cumulative oil production is 20.3 ×
108 m3, the recovery degree is 45.1% [5,6]. The location
map is shown in Figure 1.
2. Romashkino Oil Field Geology and
Development
2.1. Tectonic
The area of Romashkino oil field is large and the forma-
tion dip is small, the tectonic area is 4500 km2, where the
oil-water transition zone area is 70% of the total area, the
formation dip is smaller than 0.5˚, and only reaches 2˚ in
the side of south and west. The oil-bearing area of Devo-
nian D-I layer is 4255 km2, tectonic high-point located in
Figure 1. Location map of Romashkino oil field.
*Corresponding author.
C
opyright © 2013 SciRes. ENG
L. L. LU ET AL. 623
1535 m below the sea leve [7-9] (see Figures 2 and 3)
(North: 1480 - 1482 m, South: 1489 - 1490 m).
2.2. Sedimentary Facies
The oilfield stratigraphic section is composed of the Pre-
cambrian, Devonian, Carboniferous and Permian strata,
the total sediment thickness is 2000 meters, in which car-
bonate sediment thickness is about 1500 m, the thickness
of the terrigenous is about 500 meters, where 89% of the
proved reserves located in the Paxi Ya group DI sand
layer and Ke Nuofu group D-0 sand layer of the Upper
Devonian. The depositional environment of the sand-
stone reservoir is mainly the delta plain distributary
channel, The lithology consists of quartz sandstone, silt-
stone, mudstone and limestone.
Figure 2. Formation top structure of Romashkino oil fiel d.
Figure 3. Cross-sectional view of D-I oil layer of Romashkino oil field.
Copyright © 2013 SciRes. ENG
L. L. LU ET AL.
624
2.3. Reservoir Properties
il field are 421. 22 oil lay-
e
major parame-
mperature: 37.8˚C;
9% in aver-
ag
3.1t Design
ashkino oil field has
erty
an
he
cutting distance, reinforced the development of oil layer
The proven reservoirs of the o
ers are established. The main oil production layer is D-I
layer, the burial depth ranges from 1650 m to 1850 m.
the oil layer temperature is 37.8 Degrees Celsius, the
original formation pressure is 16.3 - 18.2 MPa, and the
OOIP is 45 × 108 t, other parameters are shown in Tables
1 and 2.
Fluid propertis
The following shown parameters are the
ters of the fluid properties of the production layer of
Romashkino oil field.
Original formation pressure: 16.3 - 18.2 MPa;
Saturation pressure: 8.5 - 9.5 MPa;
3
Original gas-oil ratio: 40 - 65 m/t;
3
Oil density: 0.858 g/cm;
Viscosity: 2.6 - 4.5 mPa·s;
Wax content: 3.2%;
Sulfur content: 1.3%;
The original reservoir te
The original water saturation: 17% - 21%, 1
e;
In a word, the major characteristics of Romashkino oil
field are the followings: large area; big the formation dip;
many oil layers; wide oil-water transition zone and com-
plicated sedimentary environment.
3. Romashkino Oil Field Development
Characteristics
. Oil Developmen
Since development in 1952, Rom
been made three total development program [11,12].
1) The first total development program (in 1956)
pAccording to the geological structure, reserve pro
d oil-water interface factors, Romashkino oil field is
cutting into 21 development zone with water injection
wells, the yearly oil production is 5400 × 104 ton. The
injection and production of D-I layer is reasonable, the
bottom-hole pressure of production well is 12.5 MPa, the
wellhead pressure of injection well is 6 MPa, water line
pressure is17.5 MPa (see Figure 4).
2) The second total development program (in 1966)
The second total development program declined t
with low and middle permeability. The main idea of this
program is to keep stable production after entering high
oil production; move the water line in completely flooded
area, reservoir with good connectivity and homogeneous
region; increase 50 percent oil production. The designed
oil recovery of each cutting section is 40% to 55%. In
order to solve the hierarchical differences, the develop-
ment program formulates to take separate water injection
and oil production.
3) The third total development program (in 1976 to
Figure 4. Depositional environment of DI-D0 oil layer.
D-I layerPorosity
Table 1. Data of BXY group D-I layer.
Thickness of production permeability
layer (m) (mD) (%)
a 1.8 - 7.1 1 1 57 - 5894 - 23
b1 2.8 541 22
b2 2.2 317 19
b3 2.9 411 22
v 1.2 141 14
2153 12
9 - 3.2 - 733 - 2
g1 2.9 300 - 400 20
g2-3 6.6 824 21
d - 3.7 6 - 554 - 2
f main reservoir.
project D-I D-I D-0
Table 2. Data o
D-0 project
Total thickness of 20 - 50 20 - 40 permmD 142 - 824, average 375 100 - 800, average 300
reservoir/m eability/
Effective thickness o
f
3.7 - 16.9 <4, aver2
Net-gross ratio Initon
reservoir/m 6, average 8.age 3.porosity/% 13 - 24, average 19 10 - 22, average 18
0.56 - ial oilsaturati17 - 21, average 19 -
Copyright © 2013 SciRes. ENG
L. L. LU ET AL. 625
9
The water injection system is further reinforced, the
ed area is enlarged, the additional wells are
ke
ent zones in the later develop-
minly ad-
ju
nuous oil layer with low oil production reservoir
of
n in the A oil layer of Ali-
ye
development
zo
pment zone and carry out side water injection and
ho
of Qishiming development zone; en-
cr
ter i
opment Stages
ield
into four stages, they are:
aracteristics of Oil Field Development
in
characteristic curve is a line, water cut of
oi
177)
water flood
pt drilled, the wells network is encrypted and the pro-
duction decline rate is controlled to reach the designed
oil recovery. To reinforce water injection system needs
the ratio of injection well and production well to be 1:3;
for the independent well network with connectivity layer,
the upper reservoir injection pressure should be higher
than the lower reservoir; selective injection in the oil
water transition band.
4) Key adjustment in five development Zones
In 1986, five developm
ent period of Romashkino oil field were ma
sted.
1) Establish separate point-like injection system in the
disconti
Rakhmanov block; carry out supplementary cutting in
the high production oil layer and establish separate mas-
sive water injection system;
2) Establish supplementary cutting wells aims to de-
velop periodic water injectio
fu and Dongsuyefu development zone;
3) Establish stratified water injection system and sup-
plementary cutting wells in the Qishiming
ne;
4) Use the 600 × 600 m well network in the Saernuofu
develo
rizontal cutting;
5) In addition, carry out phased drilling in the low
permeability layer
ypt well spacing density to 300 × 600 m in the later
period of Saernuofu development zone; do not drill well
in the area with siltstone thickness less than 2 m and
without wanjection system.
3.2. Division of Oilfield Devel
After introducing statistics to the Romashkino oil f
gives Figures 5 and 6.
From Figures 5 and 6, we divide the Romashkino oil-
field development stage
1) the first stage (1952-1969): incensing oil production
stage;
2) the second stage (1970-1975): stable oil production
stage;
3) the third stage (1976-1992): oil production decline
stage;
4) the fourth stage (since1993): decline slowed down
stage.
3.3. Ch
Characteristics of oil field development are shown
Figures 7-9.
Figure 7 shows: in the second stage of development,
the water cut
lfield increases steadily. With the implementation of
various adjustment measures of the oilfield, a downward
trend of the line slope takes on; Figure 8 shows the sec-
ond characteristic curve can be divided into three line
section: the first line section means the completely de-
velopment of oilfield blocks, water cut increases steadily;
the second line section means the water cut increase
faster and faster, because of the imperfect injection and
production systems; in the third line section, the water
cut keeps 0.87 with the implementation of different mea-
sures.
Figure 5. Yearly oil production and water cut of Romashkino oil field.
Copyright © 2013 SciRes. ENG
L. L. LU ET AL.
626
0.00
5.00
10.00
15.00
20.00
25.00
1952 19561960 1964 19681972 1976 1980 19841988 1992 1996
t/year
Np/10
8
t
Figure 6. Cumulative oil production of Romashkino oil field.
1
10
100
1000
10000
100000
1000000
051015 20 25
Np/10
8
t
Wp/10
4
t
Figure 7. First-type water drive curve.
0.001
0.01
0.1
1
10
0510 152025
Np/10
8
t
WOR/m
3
/t
Figure 8. Second-type water drive curve.
Copyright © 2013 SciRes. ENG
L. L. LU ET AL.
Copyright © 2013 SciRes. ENG
627
0
10
20
30
40
50
60
70
80
90
100
0510 1520 25 3035 4045 50
R/%
f
W
/%
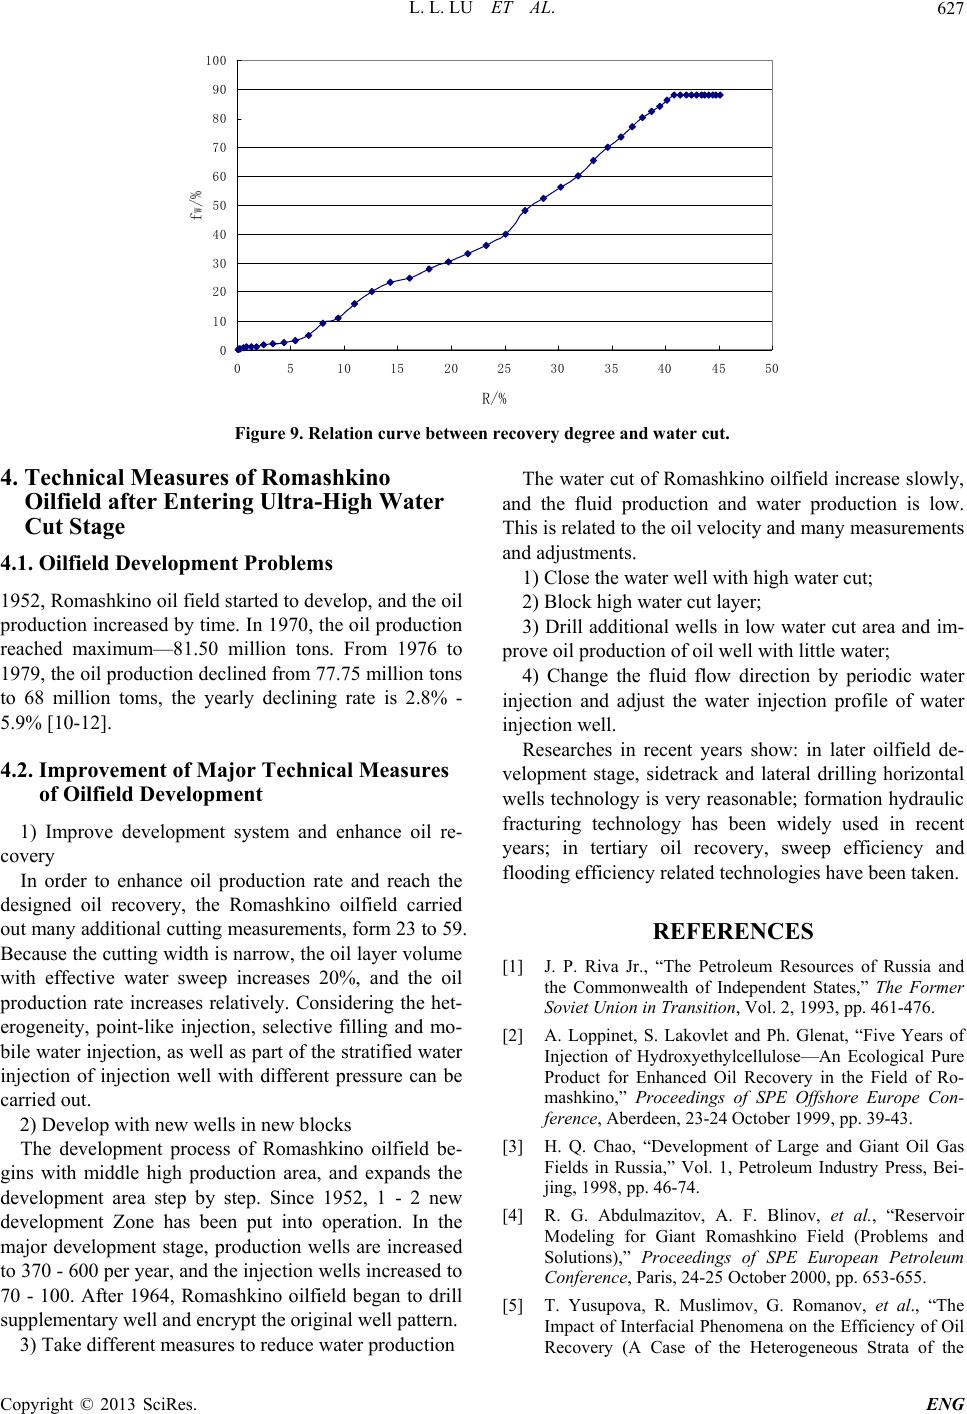
Figure 9. Relation curve between recovery degree and water cut.
4. Technical Measures of Romas h kino
Oilfield after Entering Ultra-
Cut Stage
4.1. Oilfield Development Problems
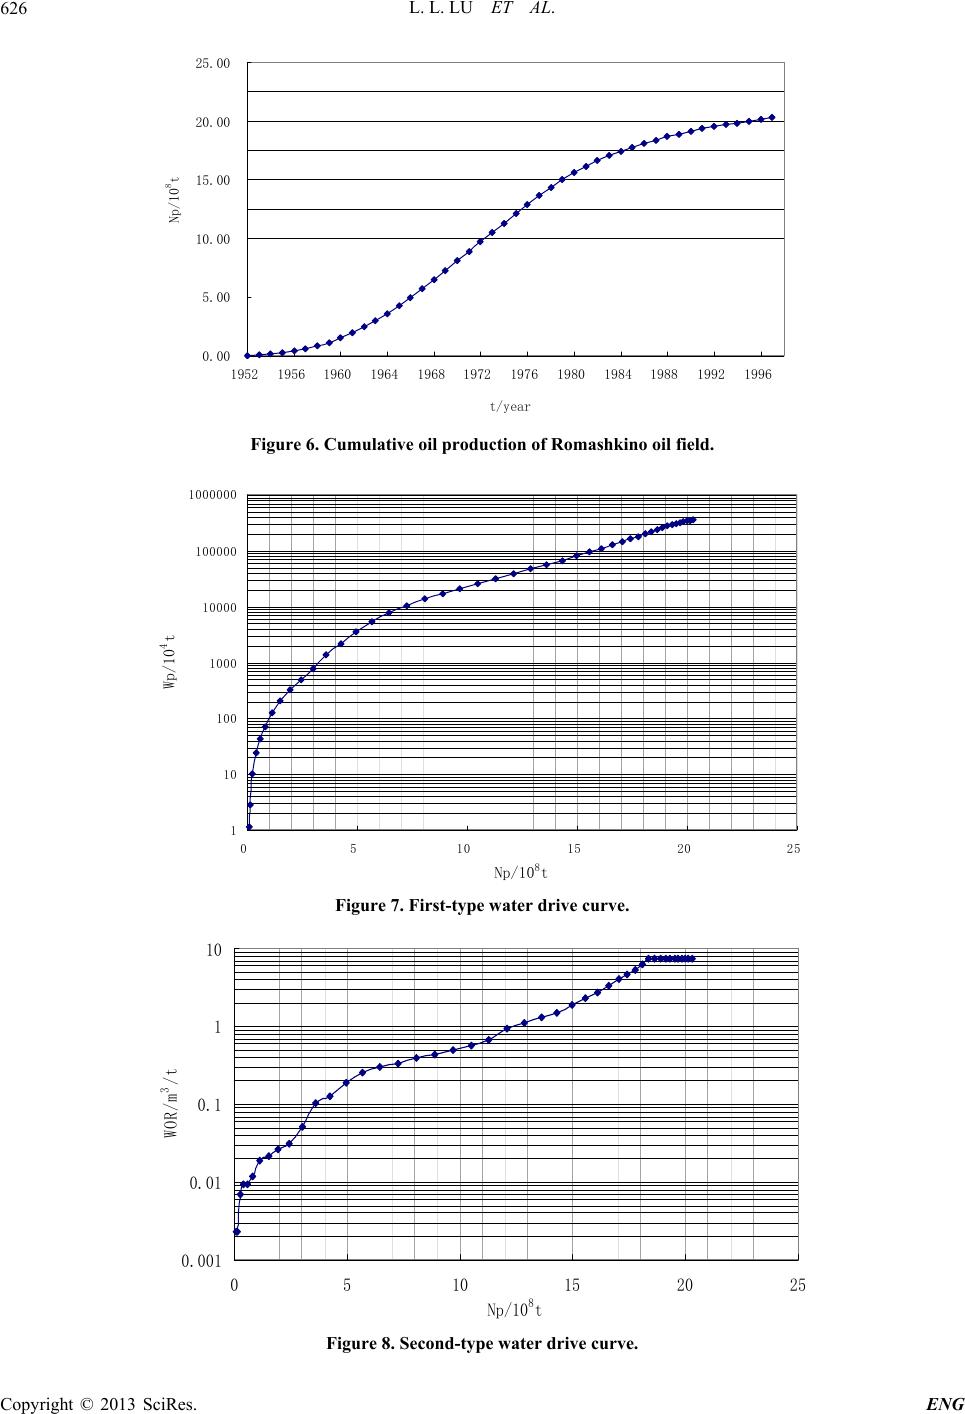
1952, Romashkino oil field started to develop, and the oil
production increased by time. In 1970, the oil production
reached maximum—81.50 million tons. From 1976 to
1979, the oil production declined from 77.75 million tons
to 68 million toms, the yearly declining rate is 2.8% -
5.9% [10-12].
4.2. Improvement of Major Technical Measures
of Oilfield Development
1) Improve development system and enhance oil re-
covery
In order to enhance oil p
esigned oil recovery, the R
to 59.
wi
idering the het-
g and mo-
ea step by step. Since 1952, 1 - 2 new
to 37 wells increased to
70
entary well and encrypt the original well pattern.
The water cut of Romashkino oilfield increase slowly,
duction and water production is low.
This is related to the oil velocity and many measurements
and adjustments.
1) Close the water well with high water cut;
2) Block high water cut layer;
3) Drill additional wells in low water cut area and im-
prove oil production of oil well with little water;
4) Change the fluid flow direction by periodic water
injection and adjust the water injection profile of water
injection well.
Researches in recent years show: in later oilfield de-
velopment stage, sidetrack and lateral drilling horizontal
wells technology is very reasonable; formation hydraulic
fracturing technology has been widely used in recent
years; in tertiary oil recovery, seep efficiency and
flooding efficiency related technologies have been taken.
iant Oil Gas
Recovery (A Case of the Heterogeneous Strata of the
High Water and the fluid pro
w
roduction rate and reach the
omashkino oilfield carried d
out many additional cutting measurements, form 23
Because the cutting width is narrow, the oil layer volume
th effective water sweep increases 20%, and the oil
production rate increases relatively. Cons
erogeneity, point-like injection, selective fillin
bile water injection, as well as part of the stratified water
injection of injection well with different pressure can be
carried out.
2) Develop with new wells in new blocks
The development process of Romashkino oilfield be-
gins with middle high production area, and expands the
development ar
development Zone has been put into operation. In the
major development stage, production wells are increased
0 - 600 per year, and the injection
- 100. After 1964, Romashkino oilfield began to drill
supplem
3) Take different measures to reduce water production
REFERENCES
[1] J. P. Riva Jr., “The Petroleum Resources of Russia and
the Commonwealth of Independent States,” The Former
Soviet Union in Transition, Vol. 2, 1993, pp. 461-476.
[2] A. Loppinet, S. Lakovlet and Ph. Glenat, “Five Years of
Injection of Hydroxyethylcellulose—An Ecological Pure
Product for Enhanced Oil Recovery in the Field of Ro-
mashkino,” Proceedings of SPE Offshore Europe Con-
ference, Aberdeen, 23-24 October 1999, pp. 39-43.
[3] H. Q. Chao, “Development of Large and G
Fields in Russia,” Vol. 1, Petroleum Industry Press, Bei-
jing, 1998, pp. 46-74.
[4] R. G. Abdulmazitov, A. F. Blinov, et al., “Reservoir
Modeling for Giant Romashkino Field (Problems and
Solutions),” Proceedings of SPE European Petroleum
Conference, Paris, 24-25 October 2000, pp. 653-655.
[5] T. Yusupova, R. Muslimov, G. Romanov, et al., “The
Impact of Interfacial Phenomena on the Efficiency of Oil
L. L. LU ET AL.
628
Romashkino Oil Field, Tatarstan),” Canadian Interna-
tional Petroleum Conference, Calgary, 10-12 June 2003.
doi:10.2118/2003-036
[6] X. J. Wen and F. R. Li, “Overview of Romashkino Field
Development,” Foreign Oil Field Engineering, Vol. 26,
No. 12, 2010, pp. 3-6.
[7] M. Boduszyński, B. R. Chadha and T. Szkuta-
“Investigations on Romashkino Asphaltic B
Pochopień
itumen. 3
sing Ion-Exchange Chro-
,
.
Fractionation of Asphaltenes U
matography,” Fuel, Vol. 56, No. 4, 1977, pp. 432-436.
doi:10.1016/0016-2361(77)90072-2
[8]
.
i:10.1016/j.gexplo.2005.12.022
D. I. D. B. A. Yakovlev, G. A. Tuzhilin and N. V. Par-
feneko “Geothermal Characteristics of The Volga-Ural
Oil-Gas Province and the Romashkino Oil Field, ” Petro-
leum Geology, Vol. 11, No. 7-12, 2001, p. 309.
[9] Q. S. Song and J. S. Zhang, “Secondary Development of
Romashkino Field,” Foreign Oil Field Engineering, Vol.
17, No. 5, 2001, pp. 31-35.
[10] D. K. Nourgaliev, R. K. Muslimov, N. N. Sidorova, et al.,
“Variation of i-Butane/n-Butane Ratio in Oils of the Ro-
mashkino Oil Field for the Period of 1982-2000: Probable
Influence of the Global Seismicity on the Fluid Migra-
tion,” Journal of Geochemical Exploration, Vol. 89, No
1, 2006, pp. 293-296. do
opment Information, Vol. 2, 2001,
.
[11] R. N. Diyashev and Y. Q. Li, “Secondary Development of
Romashkino Field Aims to Stable Production,” Petroleum
Exploration and Devel
pp. 65-74.
[12] X. B. Yang and Y. Feng, “Study on the Technological
Development Measures of Updip-Zone of Glutenite Oil
Field,” HENAN Petroleum, Vol. 14, No. 6, 2000, pp
17-19.
Copyright © 2013 SciRes. ENG