 Journal of Water Resource and Protection, 2013, 5, 18-27 http://dx.doi.org/10.4236/jwarp.2013.57A004 Published Online July 2013 (http://www.scirp.org/journal/jwarp) A Study on Zeolite Performance in Waste Treating Ponds for Treatment of Palm Oil Mill Effluent M. Halim Shah Ismail*, Shazryenna Dalang, Syafiie Syam, Shamsul Izhar Department of Chemical and Environmental Engineering, Faculty of Engineering, Universiti Putra Malaysia, Serdang, Malaysia Email: *mshalim@eng.upm.edu.my Received April 27, 2013; revised May 29, 2013; accepted July 4, 2013 Copyright © 2013 M. Halim Shah Ismail et al. This is an open access article distributed under the Creative Commons Attribution License, which permits unrestricted use, distribution, and reproduction in any medium, provided the original work is properly cited. ABSTRACT Oil palm currently occupies the largest acreage of farm land in Malaysia. In 2011, the produ ction of palm oil in Malay- sia was recorded as 19.8 million tons which has led to a huge amount of wastewater known as palm oil mill effluent (POME). This work focuses on the ponding system which acts as wastewater treatment plant in order to treat POME. The conventional ponding system applied in mills consists of a series of seven ponds. The maintenance costs of the pond are expensive thus study of alternative methods is needed. POME treatment using zeolite shows a potential to overcome the problem. Samples collected from selected ponds are tested and analyzed using water analyzer method. Result from adsorption by zeolite shows a significant reduction of COD, BOD, Fe, Zn, Mn and turbidity. This shows that zeolite is highly potential to be applied as adsorbent in the POME treatment plants. The results here may lead to lower maintenance cost, lower quantity of treatment po nds and lesser land occupied for the treatment of POME in Ma- laysia. Keywords: Palm Oil Mill Effluent (POME); Zeolite; Wastewater Treatment 1. Introduction Palm oil is one of the world’s most rapidly expanding equatorial crops. Indonesia and Malaysia are the two largest oil palm producing countries and is rich with nu- merous endemic, forest-dwelling species. Malaysia has a tropical climate and is prosperous in natural resources. Oil palm currently occupies the largest acreage of farmed land in Malaysia [1]. Over the recent years, there has been a growing concern about the discharge of oil-con- taining industrial wastewater into the ecosystem. Palm oil processing in Malaysia annually produces a huge amount of wastewater known as palm oil mill effluent (POME). POME is a viscous brown liquid with fine suspended solids at pH ranging between 4 and 5 [2]. Characteristics of POME are tabulated in Table 1. In the process of palm oil milling, POME is generated through steriliza- tion of fresh oil palm fruit bunches, clarification of palm oil and effluent from hydrocyclone operations [3]. It is estimated that about 0.5 - 0.75 tons of POME are dis- charged from the mill for every ton of fresh fruit bunch (FFB) [4]. In Malaysia about 53 million m3 POME is being produced every year based on palm oil production since 2005. Therefore, the challenge of converting POME into an env ironmental friendly waste requires an efficient treatment and effective disposal. Ponding systems are easy operating systems but they occupy a vast amount of land mass, relatively long hy- draulic retention time (45 - 60 days) and bad odor. More- over, it is difficult to maintain the liquor distribution and biogas collection which leads to harmful effect on the environment [5,6]. Another major disadvantage of using ponding system is the formation of scum and solids that tend to build up at the bottom of the pond. The sludge and scum will clump together inside the pond lowering the treatment efficiency. Therefore, the system requires regular desludging process by either using submersible pumps or excavators. Since the POME treatment applied at mills consists of seven ponds, th e maintenance cost for all the ponds is very costly. Due to these facts, palm oil mills face the challenge of balancing the environmental protection, its economic viability and sustainable devel- opment. There is an urgent necessity to find an approach to preserve the environment while keeping the economy growing. *Corresponding a uthor. C opyright © 2013 SciRes. JWARP  M. H. S. ISMAIL ET AL. 19 Table 1. Characteristic of untreated POME [15]. Parameter Concentration* pH 4.7 Temperature 80 - 90 BOD 3-day, 30˚C 25,000 COD 50,000 Total Solids 40,500 Suspended Solids 18,000 Total Volatile Solids 34,000 Ammoniacal-Nitrogen 35 Total Nitrogen 750 Phosphorus 18 Potassium 2,270 Magnesium 615 Calcium 439 Boron 7.6 Iron 46.5 Manganese 2.0 Copper 0.89 Zinc 2.3 *All units are in mg/L except pH and Temperature (˚C). Zeolites are safe, naturally occurring crystalline alu- minosilicate that have a three-dimensional structure; aluminum, silicon and oxygen which are arranged in a regular structure of [SiO4]- and [AlO4]-tetrahedral units that form a framework with small pores (also called tun- nels, channels or cavities) of about 0.1 - 2 nm diameter running through th e material [7]. In these small channels, solid, liquid and gaseous substances can be trapped [8]. High ion exchange capacity, the molecular sieve proper- ties and the relatively high surface area [9,10] make zeo- lite a promising adsorbent media for treating effluent with different suspended solids [11]. Zeolites have wide application as gas and odor filter, as a part of animal feed, and as ammonia removers from different wastewaters [12,13]. The metallic ions sorbent behavior of natural zeolite has been also stud ied by several researches, and it has been recognized as a promising sorbent for heavy metals [14]. Despite these various researches that have shown the feasibility of its application for removal of heavy metals from aqueous solution, limited studies have been carried out on COD, BOD and turbidity removal in POME treatment. Thus, this study will apply the opti- mum condition for zeolite to treat POME in order to de- termine the performance of zeolite for POME treatment at different ponds. A successful result could minimize the quantity of treatment ponds in palm oil mill in order to minimize the annual operation cost and the area of land used. 2. Materials and Methods 2.1. Sources of POME Samples This study was conducted at one of palm oil mill in Ma- laysia. This mill has the capacity to process 30 ton/h of FFB. Since the factory operates continuously for 24 hours, it is capable to process 720 ton/d of FFB. Roughly, the mill will produce 360 ton/d of POME. POME treatment applied by the mill was the ponding system which con- sists of several ponds and ends up with wastewater treat- ment plant which is an extended aeration type before dis- charging the effluent into the river. The ponds are sepa- rated by their function as in Table 2. The percentage of removal is further studied to identify if this laboratory scale treatment can b e applied. Natu ral zeolite (clino ptilo- lite) that was used in th is study was supplied from Slova- kia. Prior to the experiment, the zeolite was crushed and passed throug h a No. 20 sieves before it was washed with distilled water and dried in an oven at 12 0 ˚C for 18 h. 2.2. POME Analysis The analysis of POME characterization in this study is limited to COD, BOD, heavy metals and turbidity only. The POME is characterized before and after the adsorp- tion by zeolite. The COD is used as a measure of the oxygen equiva- lent of the organic matter content of a sample that is sus- ceptible to oxidation by a strong chemical oxidant. In this project, the open reflux method of COD analysis is used as it is suitable for a wide range of waste where a large sample size is preferred. The procedures for COD analy- sis consist of apparatus preparation, sample and reagent preparation and reading method. For apparatus prepara- tion, this analysis requires the reflux apparatus which consists of Digital Reactor Block (DRB 200), micro bu- Table 2. POME treatment ponds. Sample Real Pond Sample Label Cooling Pond 1 Mixing Pond 2 Anaerobic 1 Pond 3 Anaerobic 2 Pond 4 Facultative Pond 5 Algae 1 Pond 6 Algae 2 Pond 7 Copyright © 2013 SciRes. JWARP  M. H. S. ISMAIL ET AL. 20 rette, pipette, conical flask and culture tubes (16 × 100 mm). To begin the experiment, 2.5 mL of sample is placed in the culture tube. 1.5 mL of 0.01167 M potassium di- chromate digestion solution is added. 3.5 mL sulphuric acid is carefully added as the formation of acid layer un- der the sample-digestion solution layer is required. The culture tubes are tightly cap an d inverted several times to allow sample to be completely mixed. The culture tubes are placed in the block digester, preheated to 150˚C and refluxed for 2 hours behind a protective shield. The cul- ture tubes are then taken out and cooled to room tem- perature. The culture tubes caps are removed and 0.05 to 0.10 mL (1 to 2 drops) ferroin indicator is added. The samples are titrated with standardized 0.10 M FAS while stirred rapidly. Reading is taken when the end point is reached. The endpoint is a sharp color that changed from blue-green to reddish brown, although the blue-green may reappear within minutes. The blank samples were prepared in the same manner. The COD value of the sample was calculated using the following equation: 27 KCrO FAS FAS 0.1COD VAB M sample 8000M VV where MFAS= molarity of FAS solution (M), VK2CrO7 = volume 0.0167 M K2CrO7 (mL), VFAS = volume FAS used in titration (mL), A = mL FAS used for blank, B = mL FAS used for sample, M = molarity of FAS. The procedures fo r BOD analysis consist of incubatio n bottles –300 ml bottles, incubator–thermostatically con- trolled at 20˚C ± 1˚C, burette, pipette 2 ml, measuring cylinder –100 ml and 200 ml, aluminum foil and stan- dard laboratory glassware. There are 3 parts in measuring BOD; sample pre-treatment, preparation of dilution water and the measurement of BOD. For sample pre-treatment, pH for all the samples is checked. Sample with pH not between 6.0 and 8.0 is adjusted to pH to 7.0 to 7.2 using H2SO4 solution. NaOH solution is used to adjust the sample with pH lower than 6.0. The NaOH should be in such strength that the quantity of reagent does not dilute the sample by more than 0.5%. The pH of dilution water should not be affected by the lowest sample dilution. In preparing dilution water, a desired working volume of source water is transferred to a suitably sized bottle. The dissolve oxygen concentration is checked so at least 7.5 mg/L is existed before it can be used for BOD tests. DO is added by shaking or by aerating it with or- ganic-free filtered air. Finally 1mL each of phosphate buffer, magnesium sulphate (MgSO4), calcium chloride (CaCl2) and ferrous chloride (FeCl3) solutions per liter of water is added. Dilution of sample is also required. In this experiment, the dilution is based on 1 to 5% for raw and settled wastewater. To measure BOD, ten BOD 300 mL bottles are prepared, eight for POME samples and two for blank samples. All bottles are labelled accord- ingly to indicate day-0 and day-5 to avoid confusion. 1 mL of diluted sample is added into the sample bottles and 1mL of deionised water is added into the blank sam- ples. Dilution water is added until it reached the neck of the bottles for complete filling. The sample is then mixed by inverted the bottles several times. The day-5 bottles are wrapped with aluminium foil and are incubated for 5 days at 20˚C. The DO is determined directly for day-0 samples by adding 1mL of manganese sulphate (MnSO4) solution followed by 1 mL of iodine-azide reagent. The bottles are then sealed and inverted a few times to allow mixing. 1mL of concentrated H2SO4 solution is added after the suspension has fully settled. Again, the bottles are sealed and mixed by inverting several times until dissolution complete. 200 mL of the sample are taken out and ti- trated with sodium thiosulphate solution. Few drops of starch indicator are added and titrated until the samples are colorless. This procedure is repeated for the day-5 sample and blank bottle after the five days of incubatio n. The BOD is determined by the formula below: 12300 BOD mgLsample ml DD where D1 = DO of diluted sample immediately after preparation (mg/L), D2 = DO of diluted sample after 5 days of incubation at 20˚C (mg/L). The heavy metal analysis is examined using the Ato- mic Absorption Spectroscopy (Shimadzu). Substance must first be dissolved in a liquid, dried and then atom- ized to vaporize the substance into gas atoms. Sample is prepared by adding 5% of nitric acid and refluxed at 95˚C for 15 minutes. Then, the sample is filtered with 0.45 µm filter paper. The standard solution is prepared for Zn, Fe and Mn and based on the permissible limit concentration. The turbidity is analyzed by 2100N and AN Turbidity Meter, which adopted the Nephelometry method. The Nephelometry method is the standard method for meas- uring turbidity because of the method’s sensitivity, preci- sion, and applicability over a wide range of particle size and concentration. The POME samples were measured directly without pretreatment. 3. Results and Discussion 3.1. Characteristics of POME in Ponding System The parameters analyzed in this study are COD, BOD, Fe, Zn and Mn and turbidity. The characterization of the samples collected from the mill by the normal method without zeolite is summarized in Table 3. Pond 2 con- Copyright © 2013 SciRes. JWARP  M. H. S. ISMAIL ET AL. JWARP 21 Table 3. Analysis results of POME at Mill Site for ponding system and zeolite adsorption. Pond Number Parameter 2 4 5 7 COD (mg/L) 26,880 3264 2112 768 BOD (mg/L) 66,000 420 270 330 pH 4.4 7.5 7.7 8.4 Turbidity (NTU) 4352 100 54.3 13.6 Fe (mg/L) 11.5206 2.9217 0.9479 0.7428 Mn (mg/L) 1.7832 0.3226 0.34495 0.2616 Zn (mg/L) 0.7456 0.5453 0.1681 0.1221 tains higher COD concentration (26880 mg/L) as com- pared to Pond 4, Pond 5 and Pond 7 where COD concen- trations are 3264 mg/L, 2112 mg/L and 768 mg/L, re- spectively. POME characteristics in Table 3 clearly shows that Pond 2 h as the h ighest va lue of all parameters due to the presence of high degradable organic matter, which most probably caused by the presence of unrecov- ered palm oil. The BOD concentration at Pond 2 is 66,000 mg/L, while Pond 4, Pond 5 and Pond 7 has the BOD concen- trations of 420 mg/L, 270 mg/L and 330 mg/L, respect- tively. Similar to COD concentration, Pond 2 contains less dissolve oxygen as it has higher BOD concentration compared to other treatment ponds. The turbidity of Pond 2 is 4352 NTU, which indicates poor aesthetic characteristic. The turbidity level for wastewater should comply with the turbidity for drinking water, which should not exceed 1000 NTU. Pond 2 shows acidic behavior of pH 4.4 and this is comparable to Ma et al. on characterization of POME [15]. Normally palm oil mill wastewater is low in pH because of the or- ganic acids produced during the fermentation process. However, throughout the POME treatment by ponding system, the pH at Pond 4, Pond 5 and Pond 7 show alka- line behavior with pH of 7.5, 7.7 and 8.4, respectively. POME samples were considered a non-toxic wastewater as no chemical was added in the oil extraction process. However, it is identified as a major source of aquatic pollution caused by depleting dissolved oxygen when discharged untreated into the w ater bodies [16]. Figure 1. COD concentration after POME was treatedwith and without zeolite as adsorbent. monly on anaerobic, aerobic and facultative processes. This is evident by the degradation of COD concentration at Pond 2 to Pond 7, where the COD concentration of Pond 2, Pond 4, Pond 5 and Pond 7 is 26 ,680 mg/L, 3264 mg/L, 2112 mg/L, and 768 mg/L respectively. The treatment of POME with zeolite in Figure 1 shows the COD concentration that all samples are de- creasing. The COD concentration at Pond 2 reduced to 17,280 mg/L, lower than that without zeolite. The COD concentration is also reduced at Pond 4, Pond 5 and Pond 7 to 1920 mg/L, 960 mg/L, and 576 mg/L, respectively. The acceptable conditions for discharge of industrial ef- fluent containing chemical oxygen demand for specific trade or industry sector is 200 mg/L as the discharge limit. Therefore, to comply with the regulation, but the mill has abio-polishing plant where the COD concentra- tion can fu r t h er be reduced. 3.2. COD Analysis Figure 1 illustrates the COD concentrations of normal POME treatment (without zeolite) and treatment with zeolite. The figure clearly indicates both COD concentra- tion is degrading from Pond 2 to Pond 7. According to Sethupathi [17], the organic substance of POME is gen- erally biodegradable; therefore treatment by biodegrade- able process could be suitable, which are based com- Figure 1 (bar graph) indicates that zeo lite has different capacity of COD sorption at different type of POME characteristic. The highest removal percentage of COD concentration is found at Pond 5 (54.6%). Pond 5 is a facultative pond where according to Gray [18], faculta- Copyright © 2013 SciRes. 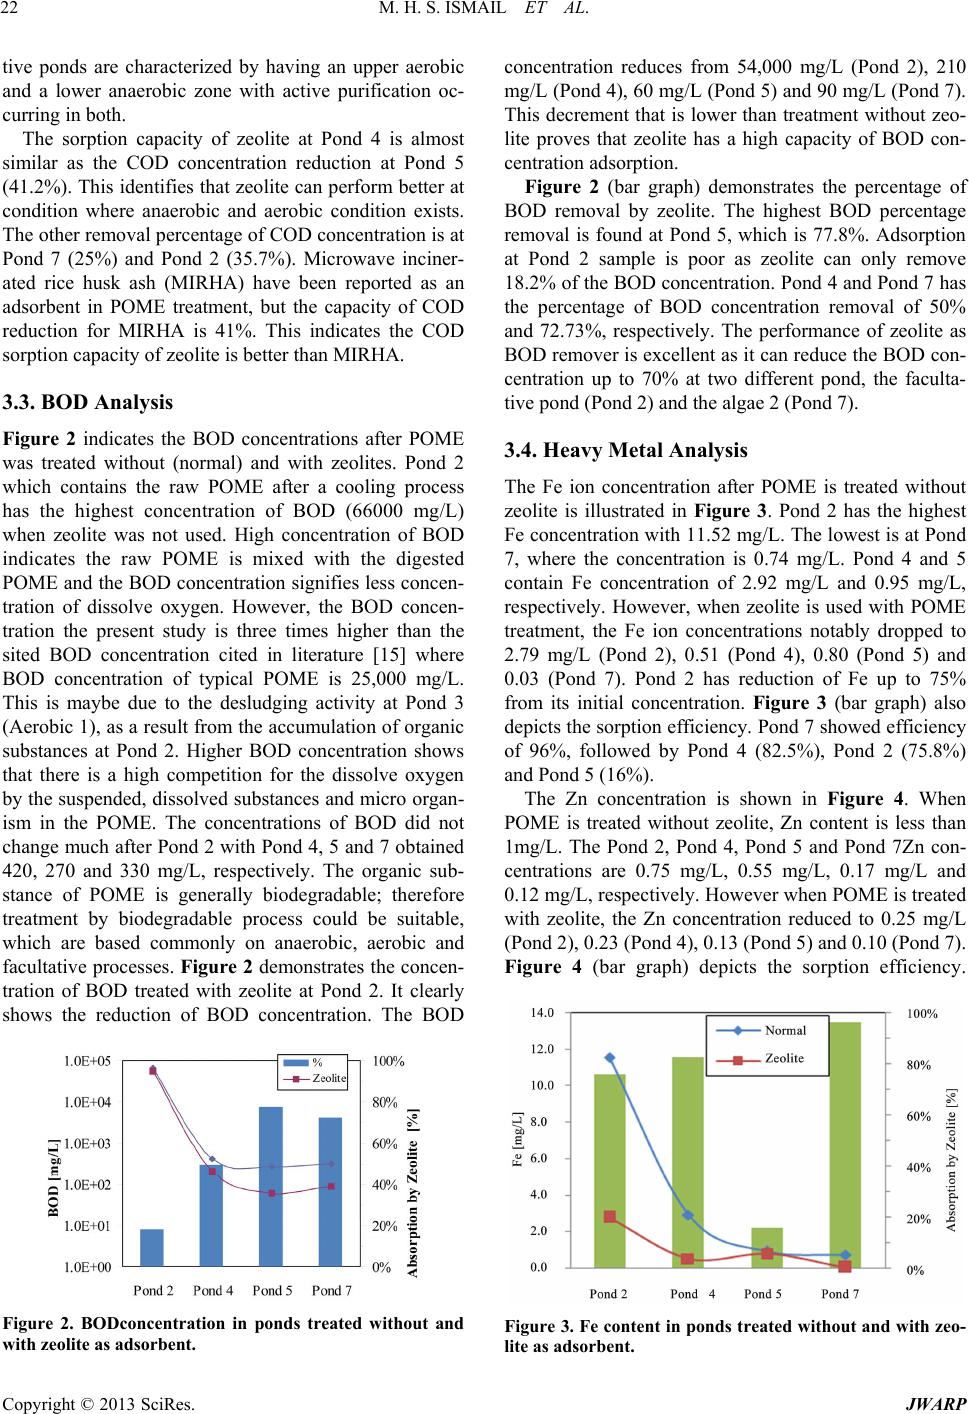 M. H. S. ISMAIL ET AL. 22 tive ponds are characterized by having an upper aerobic and a lower anaerobic zone with active purification oc- curring in both. The sorption capacity of zeolite at Pond 4 is almost similar as the COD concentration reduction at Pond 5 (41.2%). This identifies that zeolite can p erform better at condition where anaerobic and aerobic condition exists. The other removal percentage of COD concentration is at Pond 7 (25%) and Pond 2 (35.7%). Microwave inciner- ated rice husk ash (MIRHA) have been reported as an adsorbent in POME treatment, but the capacity of COD reduction for MIRHA is 41%. This indicates the COD sorption capacity of zeolite is better than MIRHA. 3.3. BOD Analysis Figure 2 indicates the BOD concentrations after POME was treated without (normal) and with zeolites. Pond 2 which contains the raw POME after a cooling process has the highest concentration of BOD (66000 mg/L) when zeolite was not used. High concentration of BOD indicates the raw POME is mixed with the digested POME and the BOD concentration signifies less concen- tration of dissolve oxygen. However, the BOD concen- tration the present study is three times higher than the sited BOD concentration cited in literature [15] where BOD concentration of typical POME is 25,000 mg/L. This is maybe due to the desludging activity at Pond 3 (Aerobic 1), as a result from the accumulation of organic substances at Pond 2. Higher BOD concentration shows that there is a high competition for the dissolve oxygen by the suspended, dissolved substances and micro organ- ism in the POME. The concentrations of BOD did not change much after Pond 2 with Pond 4, 5 and 7 obtained 420, 270 and 330 mg/L, respectively. The organic sub- stance of POME is generally biodegradable; therefore treatment by biodegradable process could be suitable, which are based commonly on anaerobic, aerobic and facultative processes. Figure 2 demonstrates the concen- tration of BOD treated with zeolite at Pond 2. It clearly shows the reduction of BOD concentration. The BOD Figure 2. BODconcentration in ponds treated without and with zeolite as adsorbent. concentration reduces from 54,000 mg/L (Pond 2), 210 mg/L (Pond 4), 60 mg/L (Pond 5) and 90 mg/L (Pond 7). This decrement that is lower than treatment without zeo- lite proves that zeolite has a high capacity of BOD con- centration adsorption . Figure 2 (bar graph) demonstrates the percentage of BOD removal by zeolite. The highest BOD percentage removal is found at Pond 5, which is 77.8%. Adsorption at Pond 2 sample is poor as zeolite can only remove 18.2% of the BOD concentration. Pond 4 and Pond 7 has the percentage of BOD concentration removal of 50% and 72.73%, respectively. The performance of zeolite as BOD remover is excellent as it can reduce the BOD con- centration up to 70% at two different pond, the faculta- tive pond (Pond 2) and the al gae 2 (P on d 7) . 3.4. Heavy Metal Analysis The Fe ion concentration after POME is treated without zeolite is illustrated in Figure 3. Pond 2 has the highest Fe concentration with 11.52 mg/L. The lowest is at Pond 7, where the concentration is 0.74 mg/L. Pond 4 and 5 contain Fe concentration of 2.92 mg/L and 0.95 mg/L, respectively. However, when zeolite is used with POME treatment, the Fe ion concentrations notably dropped to 2.79 mg/L (Pond 2), 0.51 (Pond 4), 0.80 (Pond 5) and 0.03 (Pond 7). Pond 2 has reduction of Fe up to 75% from its initial concentration. Figure 3 (bar graph) also depicts the sorption efficiency. Pond 7 showed efficiency of 96%, followed by Pond 4 (82.5%), Pond 2 (75.8%) and Pond 5 (16%). The Zn concentration is shown in Figure 4. When POME is treated without zeolite, Zn content is less than 1mg/L. The Pond 2, Pond 4, Pond 5 and Pond 7Zn con- centrations are 0.75 mg/L, 0.55 mg/L, 0.17 mg/L and 0.12 mg/L, respectively. However when POME is treated with zeolite, the Zn concentration reduced to 0.25 mg/L (Pond 2), 0.23 (P ond 4), 0.13 (Pond 5) and 0.10 (Pond 7). Figure 4 (bar graph) depicts the sorption efficiency. Figure 3. Fe content in ponds tr eated without and with zeo- lite as adsorbent. Copyright © 2013 SciRes. JWARP 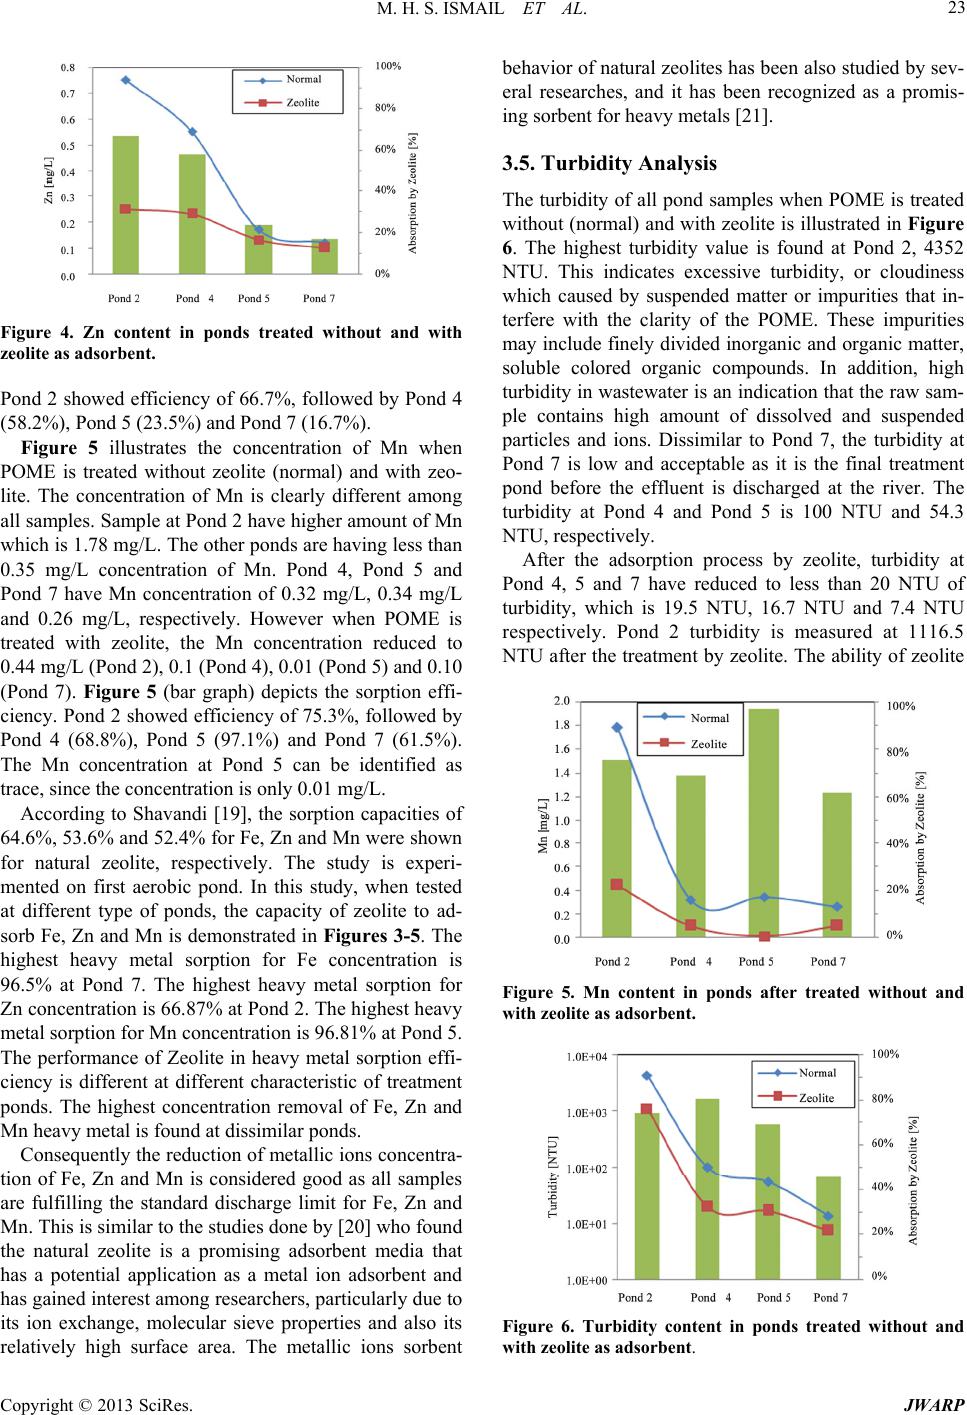 M. H. S. ISMAIL ET AL. 23 Figure 4. Zn content in ponds treated without and with zeolite as adsorbent. Pond 2 showed efficiency of 66.7%, followed by Pond 4 (58.2%), Pond 5 (23.5%) and Pond 7 (16.7%). Figure 5 illustrates the concentration of Mn when POME is treated without zeolite (normal) and with zeo- lite. The concentration of Mn is clearly different among all samples. Sample at Pond 2 have higher amount of Mn which is 1.78 mg/L. The other ponds are having less than 0.35 mg/L concentration of Mn. Pond 4, Pond 5 and Pond 7 have Mn concentration of 0.32 mg/L, 0.34 mg/L and 0.26 mg/L, respectively. However when POME is treated with zeolite, the Mn concentration reduced to 0.44 mg/L (Pond 2), 0.1 (Pond 4), 0.01 (Pond 5) and 0.10 (Pond 7). Figure 5 (bar graph) depicts the sorption effi- ciency. Pond 2 showed efficiency of 75.3%, followed by Pond 4 (68.8%), Pond 5 (97.1%) and Pond 7 (61.5%). The Mn concentration at Pond 5 can be identified as trace, since the concentration is only 0.01 mg/L. According to Shavandi [19], the sorption capacities of 64.6%, 53.6% and 52.4% fo r Fe, Zn and Mn were shown for natural zeolite, respectively. The study is experi- mented on first aerobic pond. In this study, when tested at different type of ponds, the capacity of zeolite to ad- sorb Fe, Zn and Mn is demonstrated in Figures 3-5. The highest heavy metal sorption for Fe concentration is 96.5% at Pond 7. The highest heavy metal sorption for Zn concentration is 66.87% at Pond 2. The highest heavy metal sorption for Mn concentration is 96.81% at Pond 5. The performance of Zeolite in heavy metal sorption effi- ciency is different at different characteristic of treatment ponds. The highest concentration removal of Fe, Zn and Mn heavy metal is found at dissimilar po nds. Consequently the reduction of metallic ions concentra- tion of Fe, Zn and Mn is considered good as all samples are fulfilling the standard discharge limit for Fe, Zn and Mn. This is similar to the studies done by [20] who found the natural zeolite is a promising adsorbent media that has a potential application as a metal ion adsorbent and has gained interest among researchers, particularly due to its ion exchange, molecular sieve properties and also its relatively high surface area. The metallic ions sorbent behavior of natural zeolites has been also stud ied by sev- eral researches, and it has been recognized as a promis- ing sorbent for heavy metals [21]. 3.5. Turbidity Analysis The turbidity of all pond samples when POME is treated without (normal) and with zeolite is illu strated in Figure 6. The highest turbidity value is found at Pond 2, 4352 NTU. This indicates excessive turbidity, or cloudiness which caused by suspended matter or impurities that in- terfere with the clarity of the POME. These impurities may include finely divided inorganic and organic matter, soluble colored organic compounds. In addition, high turbidity in wastewater is an indication that the raw sam- ple contains high amount of dissolved and suspended particles and ions. Dissimilar to Pond 7, the turbidity at Pond 7 is low and acceptable as it is the final treatment pond before the effluent is discharged at the river. The turbidity at Pond 4 and Pond 5 is 100 NTU and 54.3 NTU, respectively. After the adsorption process by zeolite, turbidity at Pond 4, 5 and 7 have reduced to less than 20 NTU of turbidity, which is 19.5 NTU, 16.7 NTU and 7.4 NTU respectively. Pond 2 turbidity is measured at 1116.5 NTU after the treatment by zeolite. The ability of zeo lite Figure 5. Mn content in ponds after treated without and with zeolite as adsorbent. Figure 6. Turbidity content in ponds treated without and with zeolite as adsorbent. Copyright © 2013 SciRes. JWARP 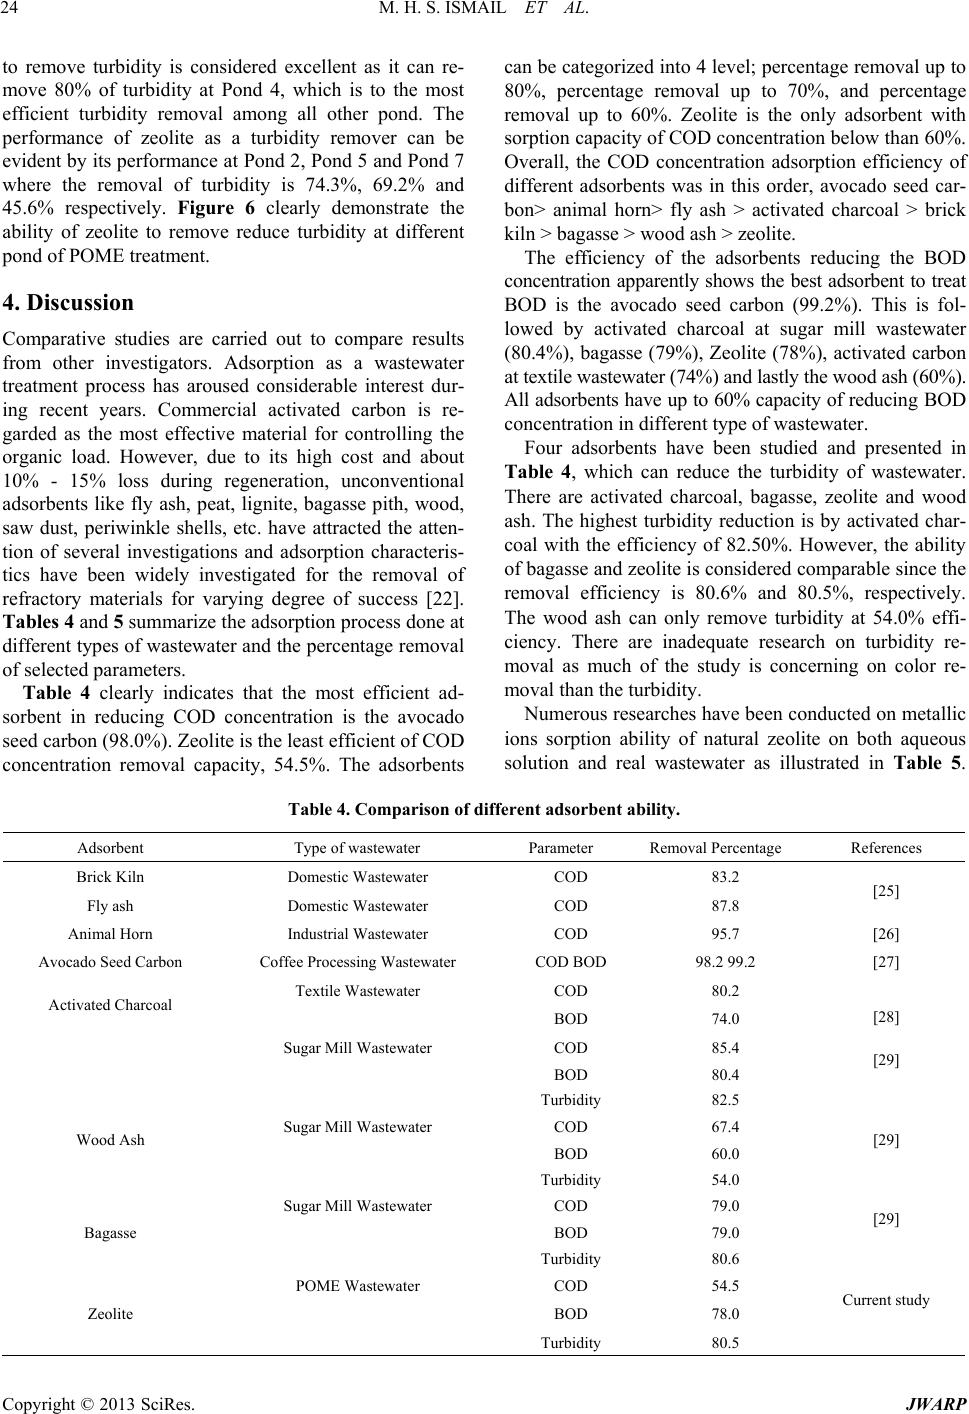 M. H. S. ISMAIL ET AL. Copyright © 2013 SciRes. JWARP 24 to remove turbidity is considered excellent as it can re- move 80% of turbidity at Pond 4, which is to the most efficient turbidity removal among all other pond. The performance of zeolite as a turbidity remover can be evident by its performance at Pond 2, Pond 5 and Pond 7 where the removal of turbidity is 74.3%, 69.2% and 45.6% respectively. Figure 6 clearly demonstrate the ability of zeolite to remove reduce turbidity at different pond of POME treatment. 4. Discussion Comparative studies are carried out to compare results from other investigators. Adsorption as a wastewater treatment process has aroused considerable interest dur- ing recent years. Commercial activated carbon is re- garded as the most effective material for controlling the organic load. However, due to its high cost and about 10% - 15% loss during regeneration, unconventional adsorbents like fly ash, peat, lignite, bagasse pith, wood, saw dust, periwinkle shells, etc. have attracted the atten- tion of several investigations and adsorption characteris- tics have been widely investigated for the removal of refractory materials for varying degree of success [22]. Tables 4 and 5 summarize the adsorption process done at different types of wastewater and the percentage removal of selected parameters. Table 4 clearly indicates that the most efficient ad- sorbent in reducing COD concentration is the avocado seed carbon (98.0%). Zeolite is the least efficient of COD concentration removal capacity, 54.5%. The adsorbents can be categorized into 4 level; percentage remova l up to 80%, percentage removal up to 70%, and percentage removal up to 60%. Zeolite is the only adsorbent with sorption capacity of COD concentration below than 60%. Overall, the COD concentration adsorption efficiency of different adsorbents was in this order, avocado seed car- bon> animal horn> fly ash > activated charcoal > brick kiln > bagasse > wood ash > zeolite. The efficiency of the adsorbents reducing the BOD concentration apparently shows the best adsorbent to treat BOD is the avocado seed carbon (99.2%). This is fol- lowed by activated charcoal at sugar mill wastewater (80.4%), bagasse (79%), Zeolite (78%), activated carbon at textile wastewater (74%) and lastly the wood ash (60%). All adsorbents have up to 60% capacity of reducing BO D concentration in different type of wastewater. Four adsorbents have been studied and presented in Table 4, which can reduce the turbidity of wastewater. There are activated charcoal, bagasse, zeolite and wood ash. The highest turbidity reduction is by activated char- coal with the efficiency of 82.50%. However, the ability of bagasse and zeolite is considered comparable since the removal efficiency is 80.6% and 80.5%, respectively. The wood ash can only remove turbidity at 54.0% effi- ciency. There are inadequate research on turbidity re- moval as much of the study is concerning on color re- moval than the turbid ity. Numerous researches have been conducted on metallic ions sorption ability of natural zeolite on both aqueous solution and real wastewater as illustrated in Table 5. Table 4. Comparison of different adsorbent ability. Adsorbent Type of wastewater Parameter Removal Percent ag e References Brick Kiln Domestic Wastewater COD 83.2 Fly ash Domestic Wastewater COD 87.8 [25] Animal Horn Industrial Wastewater COD 95.7 [26] Avocado Seed Carbon Coffee Processing Wastewater COD BOD 98.2 99.2 [27] Textile Wastewater COD 80.2 Activated Charcoal BOD 74.0 [28] Sugar Mill Wastewater COD 85.4 BOD 80.4 [29] Turbidity 82.5 Sugar Mill Wastewater COD 67.4 Wood Ash BOD 60.0 [29] Turbidity 54.0 Sugar Mill Wastewater COD 79.0 Bagasse BOD 79.0 [29] Turbidity 80.6 POME Wastewater COD 54.5 Zeolite BOD 78.0 Current study Turbidity 80.5 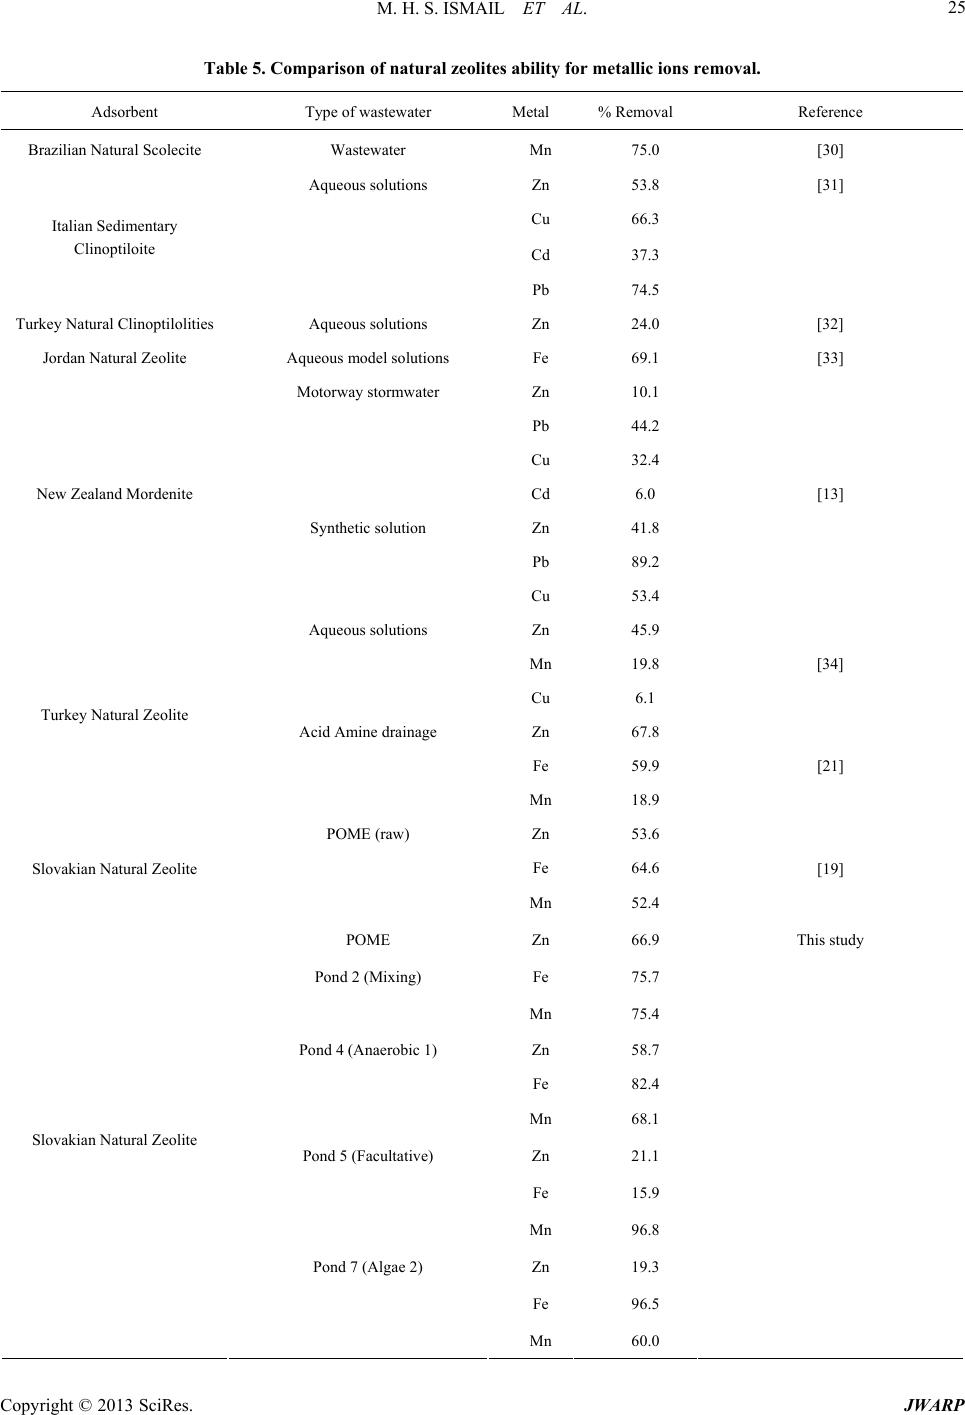 M. H. S. ISMAIL ET AL. 25 Table 5. Comparison of natural zeolites ability for metallic ions removal. Adsorbent Type of wastewater Metal % Removal Reference Brazilian Natural Scolecite Wastewater Mn 75.0 [30] Aqueous solution s Zn 53.8 [31] Cu 66.3 Cd 37.3 Italian Sedimentary Clinoptiloite Pb 74.5 Turkey Natural Clinoptilolities Aqueous solution s Zn 24.0 [32] Jordan Natural Zeolite Aqueous model solutions Fe 69.1 [33] Motorway stormwater Zn 10.1 Pb 44.2 Cu 32.4 Cd 6.0 Synthetic solution Zn 41.8 Pb 89.2 New Zealand Mordenite Cu 53.4 [13] Aqueous solution s Zn 45.9 Mn 19.8 [34] Cu 6.1 Acid Amine drainage Zn 67.8 Fe 59.9 Turkey Natural Zeolite Mn 18.9 [21] POME (raw) Zn 53.6 Fe 64.6 Slovakian Natural Zeolite Mn 52.4 [19] POME Zn 66.9 This study Pond 2 (Mixing) Fe 75.7 Mn 75.4 Pond 4 (Anaerobic 1) Zn 58.7 Fe 82.4 Mn 68.1 Pond 5 (Facultative) Zn 21.1 Fe 15.9 Mn 96.8 Pond 7 (Algae 2) Zn 19.3 Fe 96.5 Slovakian Natural Zeolite Mn 60.0 Copyright © 2013 SciRes. JWARP  M. H. S. ISMAIL ET AL. Copyright © 2013 SciRes. JWARP 26 The Slovakian zeolite u sed in this study has higher Zn sorption percentage compared to the majority of tested zeolites. However, Fe removal percentages of all studied zeolites are almost in the same range that is less than 70%. In case of Mn, the zeolite used in this study shows the higher remov al ability than zeoli te from Turkey, while Brazilian zeolite removed Mn ions more effectively. In this study case, the sorption capacity of the Slovakian zeolite to reduce the concentration of Fe, Zn and Mn is different at different pond. This is maybe due to the dif- ferent contents of metallic ions in all samples. Overall, the adsorption process is one of the effective methods for pollutant removal from the waste effluent especially heavy metal ions, color, odor and organic pol- lution [23,24]. The process of adsorption has an edge over the other methods due to its sludge free clean opera- tion and low capital intensive nature. Even though, zeo- lite has less adsorption capacity toward reducing COD concentration, the other abilities should not be over- looked. The present study evidenced that zeolite is ex- cellent for the reduction of BOD concentration and re- moval sorption of metal and turbidity during POME treatment. 5. Conclusion The characterization of POME has been carried out. The POME at Pond 2 has the highest concentration of all tested ponds due to the fact that it is the first receiver of POME. Due to the recent desludging activity at Pond 4 and Pond 5, BOD concentration in Pond 7 was slightly high. The POME at Pond 2, Pond 4, Pond 5 and Pond 7 has been treated through adsorption process by zeolite. The adsorption process shows a substantial reduction in COD, BOD, heavy metals and turbidity. This indicates the performance of zeolite as adsorbent is promising.Th e highest concentration removal is at Pond 2, thus applying zeolite in Pond 2 could result in positive step in reducing the POME treatment ponds in mills. REFERENCES [1] S. Arifand and T. A. Tengku Mohd Ariff, “The Case Study on the Malaysian Palm Oil,” United Nations Con- ference on Trade and Development/Economic and Social Commission for Asia and the Pacific Regional Workshop on Commodity Export Diversification and Poverty Re- duction in South and South-East Asia, Bangkok, 3-5 April 2001. [2] G. D. Najafpour, A. A. LZinatizadeh, A. R. Mohamed, M. Hasnain Isa, H. Nasrollahzadeh, “High-Rate Anaerobic Digestion of Palm Oil Mill Effluent in an Upflow An- aerobic Sludge-Fixed Film Bioreactor,” Process Bio- chemistry, Vol. 41, No. 2, 2006, pp. 370-379. doi:10.1016/j.procbio.2005.06.031 [3] R. Borja, C. J. Banks and E. Sánchez, “Anaerobic Treat- ment of Palm Oil Mill Effluent in a Two-Stage Up-Flow Anaerobic Sludge Blanket (UASB) Reactor,” Journal of Biotechnology, Vol. 45, No. 2, 1996, pp. 125-135. doi:10.1016/0168-1656(95)00154-9 [4] S. Yacob, M. A. Hassan, Y. Shirai, M. Wakisaka and S. Subash, “Baseline Study of Methane Emission from Open Digesting Tanks of Palm Oil Mill Effluent Treatment,” Chemosphere, Vol. 59, No. 11, 2005, pp. 1575-1581. doi:10.1016/j.chemosphere.2004.11.040 [5] C. O. Onyia, A. M. Uyub, J. C. Akunna, N. A. Norulaini and A. K. M. Omar, “Increasing the Fertilizer Value of Palm Oil Mill Sludge: Bioaugmentation in Nitrification. Sludge Management Entering the Third Millenium,” In- dustrial, Combined, Water and Wastewater Residues, Vol. 44, 2001, pp. 157-162. [6] K. K. Chin, S. W. Lee and H. H. Mohammad, “A Study of Palm Oil Mill Effluent Treatment Using a Pond Sys- tem,” Water Science and Technology, Vol. 34, No. 1, 1996, pp. 119-123. doi:10.1016/S0273-1223(96)00828-1 [7] A. W. Chester and E. G. Derouane, “Zeolite Characteri- zation and Catalysis,” Springer, Heidelberg, London, New York, 2001. [8] D. Mohan and K. P. Singh, “Single- and Multi-Compo- nent Adsorption of Cadmium and Zinc Using Activated Carbon Derived from Bagasse—An Agricultural Waste,” Water Research, Vol. 36, No. 9, pp. 2304-2318. doi:10.1016/S0043-1354(01)00447-X [9] V. J. Inglezakis, M. D. Loizidou and H. P. Grigoropoulou, “Ion Exchange of Pb2+, Cu2+, Fe3+, and Cr3+ on Natural Clinoptilolite: Selectivity Determination and Influence of Acidity on Metal Uptake,” Journal of Colloid and Inter- face Science, Vol. 261, No. 1, pp. 49-54. doi:10.1016/S0021-9797(02)00244-8 [10] S. Mohan and R. Gandhimathi, “Removal of Heavy Metal Ions from Municipal Solid Waste Leachate Using Coal Fly Ash as An Adsorbent,” Journal of Hazardous Mate- rials, Vol. 169, No. 1-3, 2009, pp. 351-359. [11] Z. Milán, E. Sánchez, P. Weiland, R. Borja and A. Marti, “Influence of Different Natural Zeolite Concentrations on the Anaerobic Digestion of Piggery Waste,” Bioresource Technology, Vol. 80, No. 1, 2001, pp. 37-43. doi:10.1016/S0960-8524(01)00064-5 [12] T. S. Jamil, H. S. Ibrahim, I. H. Abd El-Maksoud, S. T. El-Wakeel, “Application of Zeolite Prepared from Egyp- tian Kaolin for Removal of Heavy Metals. I. Optimum Conditions,” Desalination, Vol. 258, No. 1-3, 2010, pp. 34-40. doi:10.1016/j.desal.2010.03.052 [13] S. K. Pitcher, R. C. T. Slade and N. I. Ward, “Heavy Metal Removal from Motorway Stormwater Using Zeo- lites,” Science of The Total Environment, Vol. 334-335, 2004, pp. 161-166. doi:10.1016/j.scitotenv.2004.04.035 [14] T. Motsi, N. A. Rowson and M. J. H. Simmons, “Adsorp- tion of Heavy Metals from Acid Mine Drainage by Natu- ral Zeolite,” International Journal of Mineral Processing, Vol. 92, No. 1-2, 2009, pp. 42-48. doi:10.1016/j.minpro.2009.02.005 [15] A. N. Ma, “Treatment of Palm Oil Mill Effluent,” In: G. Singh, K. H. Lim, T. Leng and L. K. David, Ed., Oil Palm and the Environment: A Malaysian Perspective,  M. H. S. ISMAIL ET AL. 27 Malaysian Oil Palm Growers’ Council, Kuala Lampur, 1999, pp. 113-126. [16] R. Khalid and W. A. Wan Mustafa, “External Benefits of Environmental Regulation: Resource Recovery and the Utilisation of Effluents,” The Environmentalist, Vol. 12, No. 4, 1992, pp. 277-285. doi:10.1007/BF01267698 [17] S. Sethupathi, “Removal of Residue Oil from Palm Oil Mill (POME) Using Chitosan,” Universiti Sains Malaysia, Vol. 41, 2004, pp. 962-964. [18] N. F. Gray, “Biological of Wastewater Treatment,” Ox- ford University Press, Oxford, 1992. [19] M. A. Shavandi, Z. Haddadian, M. H. S. Ismail, N. Ab- dullah and Z. Z. Abidin, “Removal of Fe(III), Mn(II) and Zn(II) from Palm Oil Mill Effluent (POME) by Natural Zeolite,” Journal of the Taiwan Institute of Chemical En- gineers, Vol. 43, 2012, pp. 750-759. doi:10.1016/j.jtice.2012.02.014 [20] S. Mohan and R. Gandhimathi, “Removal of Heavy Metal Ions from Municipal Solid Waste Leachate Using Coal Fly Ash as An Adsorbent,” Journal of Hazardous Mate- rials, Vol. 169, No. 1- 3, 2009, pp. 351-359. [21] E. Erdem, N. Karapinar and R. Donat, “The Removal of Heavy Metal Cations by Natural Zeolites,” Journal of Colloid and Interface Science, Vol. 280, No. 2, 2004, pp. 309-314. doi:10.1016/j.jcis.2004.08.028 [22] K. K. Pandey, G. Prasad and V. N. Singh, “Copper Re- moval from Aqueous Solutions by Fly Ash,” Water Re- search, Vol. 19, No. 7, 1985, pp. 869-873. doi:10.1016/0043-1354(85)90145-9 [23] M. Ganji, M. Khosravi and R. Rakhshaei, “Biosorption of Pb, Cd, Cu and Zn from the Wastewater by Treated Azollafiliculides with H2O2/MgCl2,” International Jour- nal of Environmental Science and Technology, Vol. 1, No. 4, 2005, pp. 265-271. [24] M. B .G. Steinhauser, “Adsorption of Ions onto High Silica Volcanic Glass,” Applied Radiation and Isotopes, Vol. 66, No. 1, 2008, pp. 1-8. doi:10.1016/j.apradiso.2007.07.010 [25] R. Devi and R. P. Dahiya, “Chemical Oxygen Demand (Cod) Reduction in Domestic Wastewater By Fly Ash And Brick Kiln Ash,” Water, Air & Soil Pollution, Vol. 174, No. 1-4, 2006, pp. 33-46. doi:10.1007/s11270-005-9022-9 [26] E. O. Aluyor and O. A. M. Badmus, “COD Removal from Industrial Wastewater Using Activated Carbon Pre- pared from Animal Horns,” African Journal of Biotech- nology,Vol. 7, No. 21, 2008, pp. 3887-3891. [27] R. Devi, “Innovative Technology of COD and BOD Re- duction from Coffee Processing Wastewater Using Avo- cado Seed Carbon (ASC),” Water, Air, & Soil Pollution, Vol. 207, 2010, pp. 299-306. doi:10.1007/s11270-009-0137-2 [28] H. Patel and R. T. Vashi, “Treatment of Textile Waste- waterby Adsorption and Coagulation,” E-Journal of Che- mistry, Vol. 7, No. 4, 2010, pp. 1468-1476. doi:10.1155/2010/987620 [29] C. Saxena and S. Madan, “Evaluation of Adsorbents Ef- ficacy for the Removalof Pollutants from Sugar Mill Ef- fluent,” ARPN Journal of Agricultural and Biological Science, Vol. 7, No. 5, 2012, pp. 325-329. [30] S. M. Dal Bosco, R. S. Jimenez and W. A. Carvalho, “Removal of Toxic Metals from Wastewater by Brazilian Natural Scolecite,” Journal of Colloid and Interface Sci- ence, Vol. 281, No. 2, 2005, pp. 424-431. doi:10.1016/j.jcis.2004.08.060 [31] A. Langella, M. Pansini, P. Cappelletti, B. D. Gennaro, M. de’ Gennaro and C. Colella, “NH4+, Cu2+, Zn2+, Cd2+ and Pb2+ Exchange for Na+ in a Sedimentary Clinopti-Lolite, North Sardinia, Italy,” Microporous and Mesoporous Materials, Vol. 37, No. 3, 2000, pp. 337-343. doi:10.1016/S1387-1811(99)00276-0 [32] C. Semra, “The Removal of Zinc Ions by Natural and Conditioned Clinoptilolites,” Desalination, Vol. 225, No. 1-3, 2008, pp. 41-57. [33] M. Al-Anber and Z. A. Al-Anber, “Utilization of Natural Zeolite as Ion-Exchange and Sorbent Material in the Re- moval of Iron,” Desalination, Vol. 225, No. 1-3, 2008, pp. 70-81. doi:10.1016/j.desal.2007.07.006 [34] A. Sdiri, T. Higashi, T. Hatta, F. Jamoussi and N. Tase, “Evaluating the Adsorptive Capacity of Montmorillonitic and Calcareous Clays on the Removal of Several Heavy Metals in Aqueous Systems,” Chemical Engineering Journal, Vol. 172, No. 1, 2011, pp. 37-46. doi:10.1016/j.cej.2011.05.015 Copyright © 2013 SciRes. JWARP
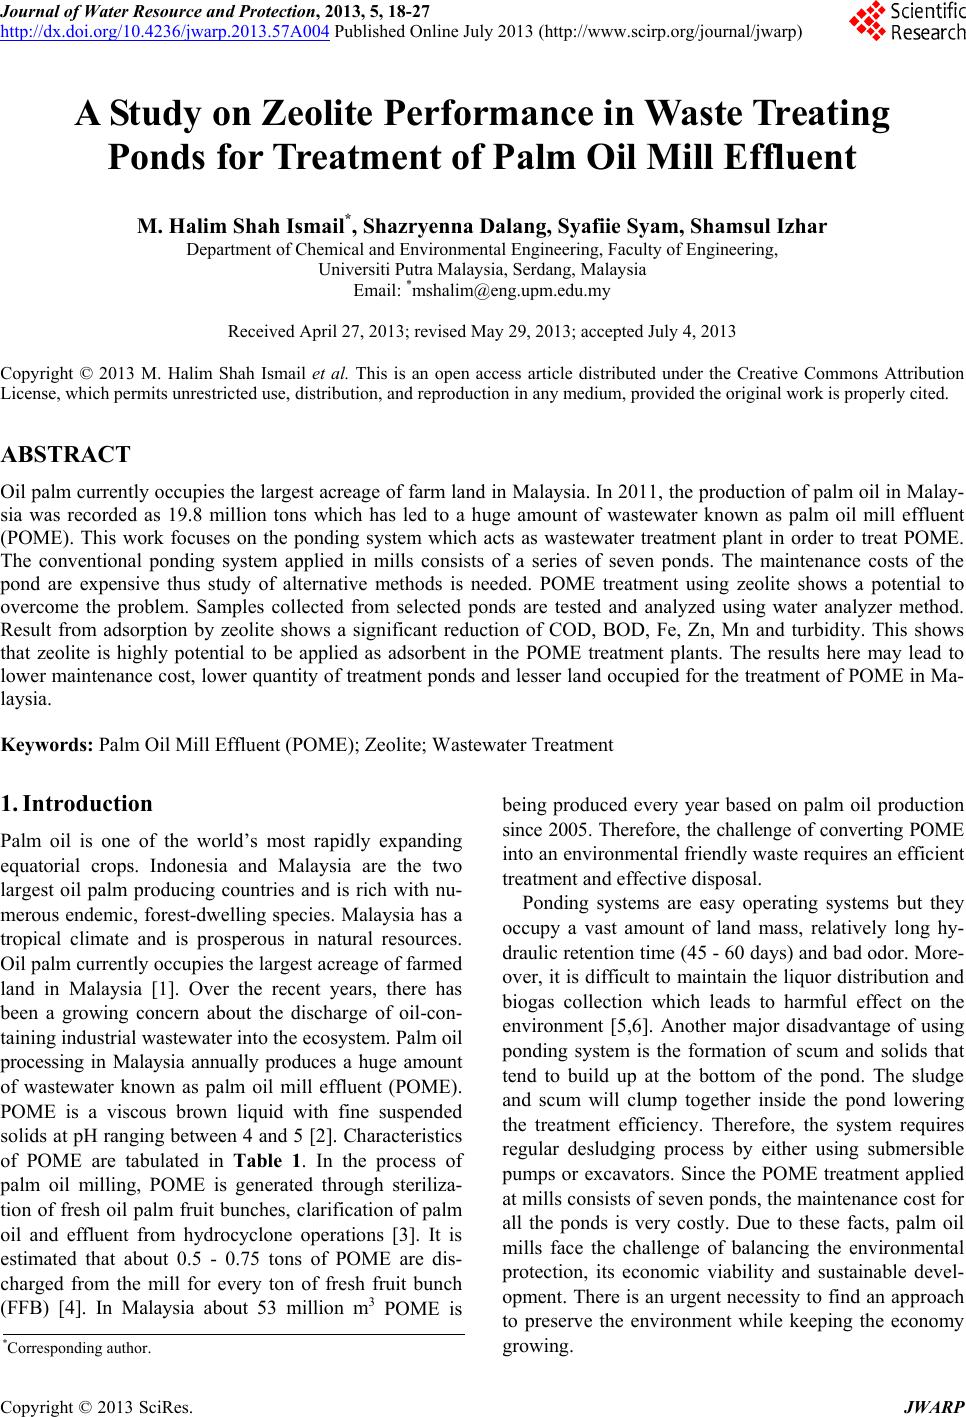
|