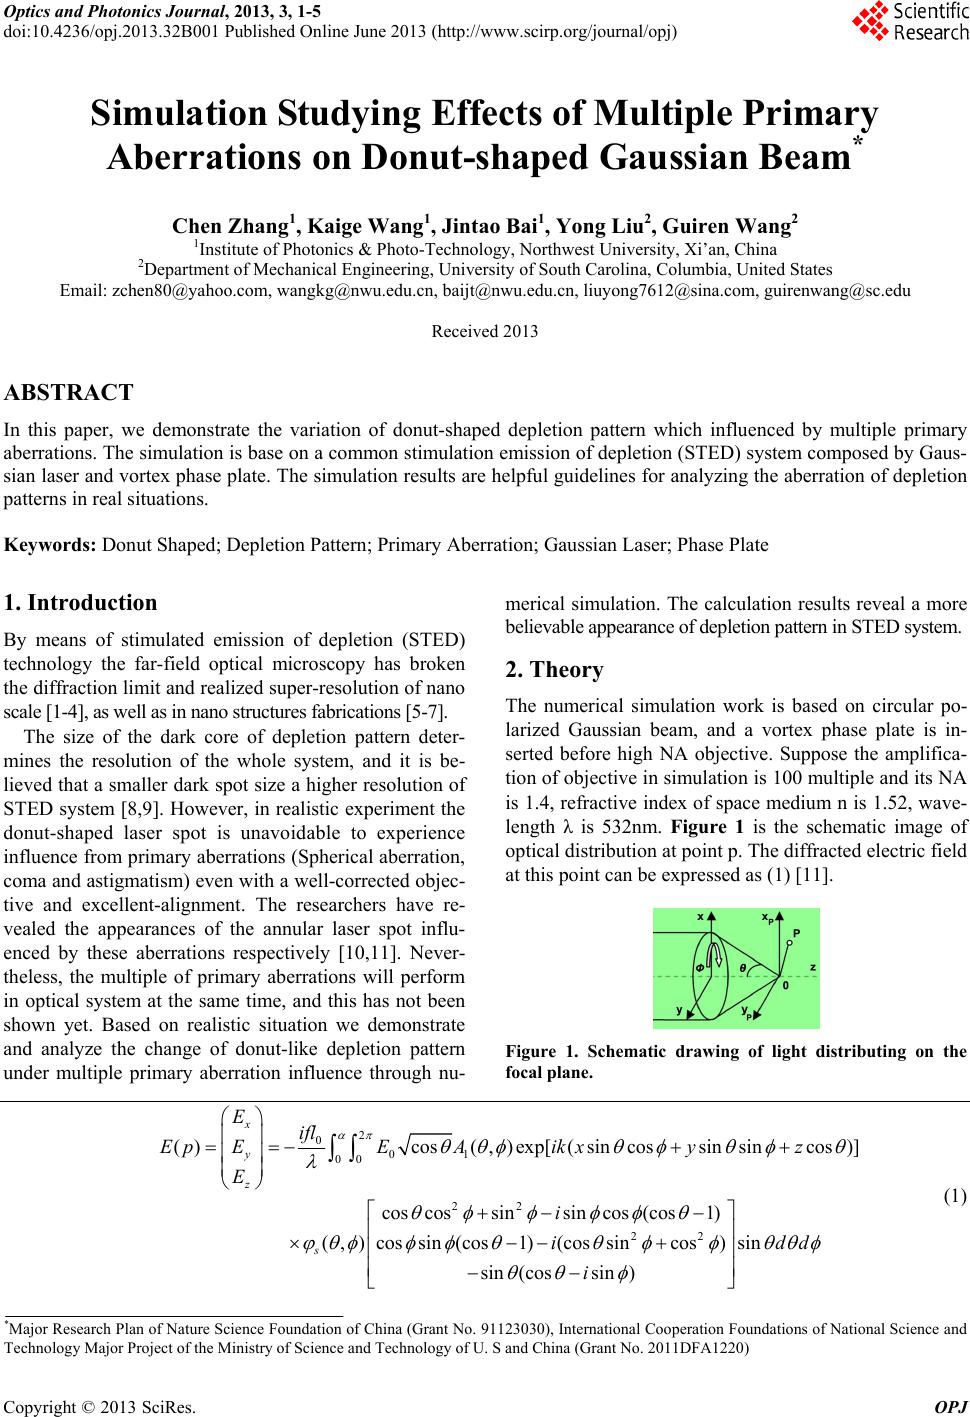
 Optics and Photonics Journal, 2013, 3, 1-5 doi:10.4236/opj.2013.32B001 Published Online June 2013 (http://www.scirp.org/journal/opj) Simulation Studying Effects of Multiple Primary Aberrations on Donut-shaped Gaussian Beam* Chen Zhang1, Kaige Wang1, Jintao Bai1, Yong Liu2, Guiren Wang2 1Institute of Photonics & Photo-Technology, Northwest University, Xi’an, China 2Department of Mechanical Engineering, University of South Carolina, Columbia, United States Email: zchen80@yahoo.com, wangkg@nwu.edu.cn, baijt@nwu.edu.cn, liuyong7612@sina.com, guirenwang@sc.edu Received 2013 ABSTRACT In this paper, we demonstrate the variation of donut-shaped depletion pattern which influenced by multiple primary aberrations. The simulation is base on a common stimulation emission of depletion (STED) system composed by Gaus- sian laser and vortex phase plate. The simulation results are helpful guidelines for analyzing the aberration of depletion patterns in real situations. Keywords: Donut Shaped; Depletion Pattern; Primary Aberration; Gaussian Laser; Phase Plate 1. Introduction By means of stimulated emission of depletion (STED) technology the far-field optical microscopy has broken the diffraction limit and realized super-resolution of nano scale [1-4], as well as in nano structures fabrications [5-7]. The size of the dark core of depletion pattern deter- mines the resolution of the whole system, and it is be- lieved that a smaller dark spot size a higher resolution of STED system [8,9]. However, in realistic experiment the donut-shaped laser spot is unavoidable to experience influence from primary aberrations (Spherical aberration, coma and astigmatism) even with a well-corrected objec- tive and excellent-alignment. The researchers have re- vealed the appearances of the annular laser spot influ- enced by these aberrations respectively [10,11]. Never- theless, the multiple of primary aberrations will perform in optical system at the same time, and this has not been shown yet. Based on realistic situation we demonstrate and analyze the change of donut-like depletion pattern under multiple primary aberration influence through nu- merical simulation. The calculation results reveal a more believable appearance of depletion pattern in STED system. 2. Theory The numerical simulation work is based on circular po- larized Gaussian beam, and a vortex phase plate is in- serted before high NA objective. Suppose the amplifica- tion of objective in simulation is 100 multiple and its NA is 1.4, refractive index of space medium n is 1.52, wave- length λ is 532nm. Figure 1 is the schematic image of optical distribution at point p. The diffracted electric field at this point can be expressed as (1) [11]. Figure 1. Schematic drawing of light distributing on the focal plane. 2 0 01 00 22 22 ()cos(,) exp[(sincossinsincos)] coscossinsincos (cos1) (,)cossin(cos1)(cossin cos)sin sin(cossin ) x y z s Eifl Ep EEAikxyz E i id i d (1) *Major Research Plan of Nature Science Foundation of China (Grant No. 91123030), International Cooperation Foundations of National Science and Technology Major Project of the Ministry of Science and Technology of U. S and China (Grant No. 2011DFA1220) Copyright © 2013 SciRes. OPJ 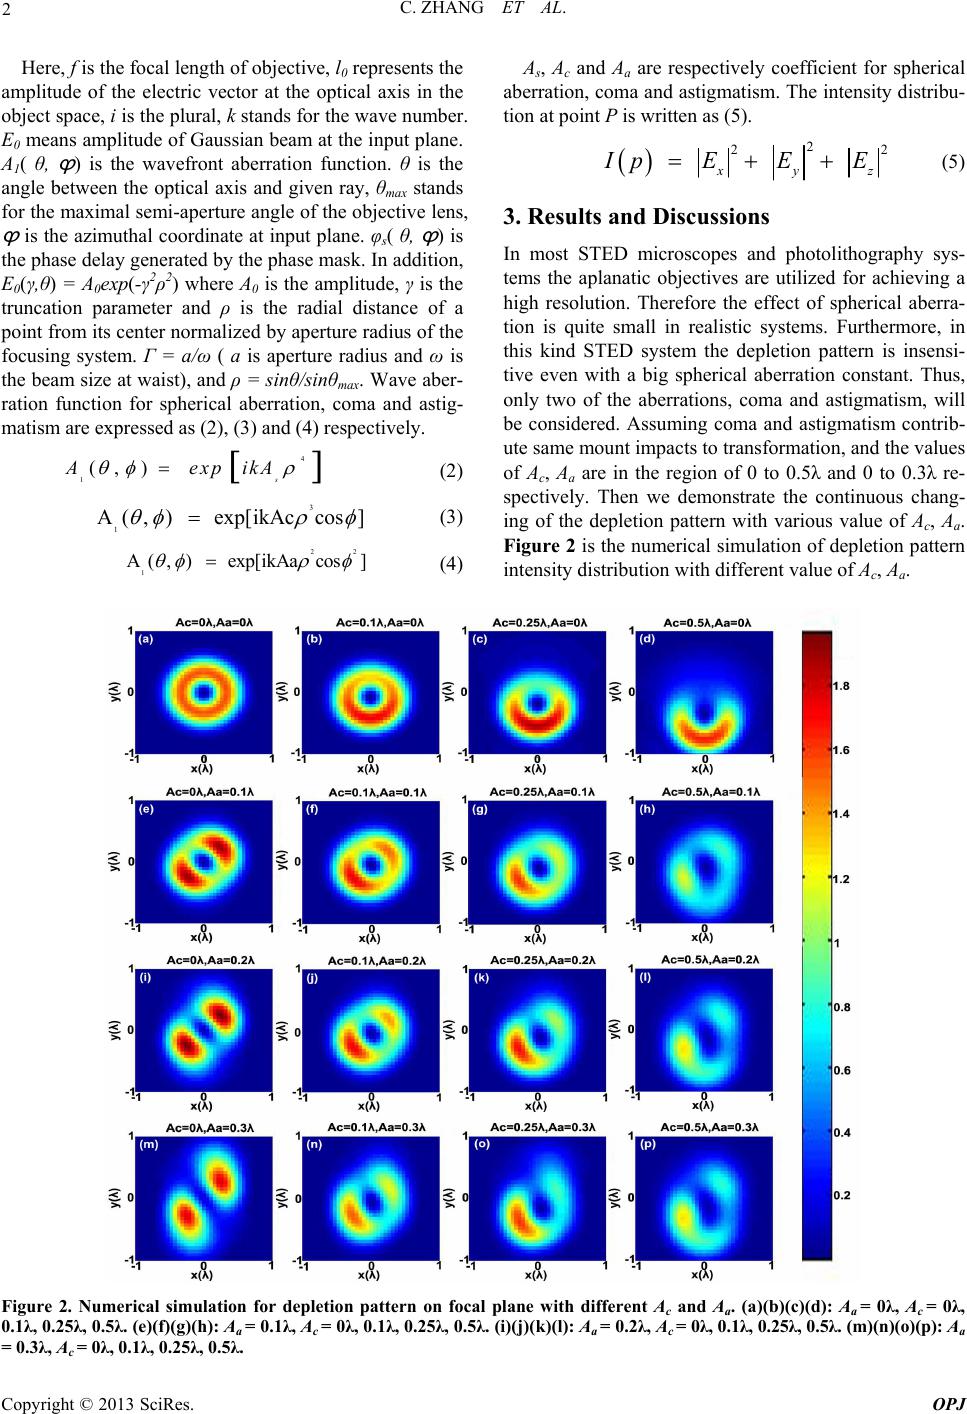 C. ZHANG ET AL. 2 Here, f is the focal length of objective, l0 represents the amplitude of the electric vector at the optical axis in the object space, i is the plural, k stands for the wave number. E0 means amplitude of Gaussian beam at the input plane. A1( θ, ϕ ) is the wavefront aberration function. θ is the angle between the optical axis and given ray, θmax stands for the maximal semi-aperture angle of the objective lens, ϕ is the azimuthal coordinate at input plane. φs( θ, ϕ ) is the phase delay generated by the phase mask. In addition, E0(γ,θ) = A0exp(-γ2ρ2) where A0 is the amplitude, γ is the truncation parameter and ρ is the radial distance of a point from its center normalized by aperture radius of the focusing system. Γ = a/ω ( a is aperture radius and ω is the beam size at waist), and ρ = sinθ/sinθmax. Wave aber- ration function for spherical aberration, coma and astig- matism are expressed as (2), (3) and (4) respectively. 4 1(,) s Aexp ikA (2) 3 1 A(,) exp[ikAccos] (3) 22 1 A(,) exp[ikAacos] As, Ac and Aa are respectively coefficient for spherical aberration, coma and astigmatism. The intensity distribu- tion at point P is written as (5). 2 22 yz pEEE (5) 3. Results and Discussions In most STED microscopes and photolithography sys- tems the aplanatic objectives are utilized for achieving a high resolution. Therefore the effect of spherical aberra- tion is quite small in realistic systems. Furthermore, in this kind STED system the depletion pattern is insensi- tive even with a big spherical aberration constant. Thus, only two of the aberrations, coma and astigmatism, will be considered. Assuming coma and astigmatism contrib- ute same mount impacts to transformation, and the values of Ac, Aa are in the region of 0 to 0.5λ and 0 to 0.3λ re- spectively. Then we demonstrate the continuous chang- ing of the depletion pattern with various value of Ac, Aa. Figure 2 is the numerical simulation of depletion pattern intensity distribution with different value of Ac, Aa. (4) Figure 2. Numerical simulation for depletion pattern on focal plane with different Ac and Aa. (a)(b)(c)(d): Aa = 0λ, Ac = 0λ, 0.1λ, 0.25λ, 0.5λ. (e)(f)(g)(h): Aa = 0.1λ, Ac = 0λ, 0.1λ, 0.25λ, 0.5λ. (i)(j)(k)(l): Aa = 0.2λ, Ac = 0λ, 0.1λ, 0.25λ, 0.5λ. (m)(n)(o)(p): Aa = 0.3λ, Ac = 0λ, 0.1λ, 0.25λ, 0.5λ. Copyright © 2013 SciRes. OPJ  C. ZHANG ET AL. 3 It is obviously in Figure 2(a) to (d) that optical inten- sity at one side of the donut-shaped depletion beam is gradually weakened with sole influence from strength- ening coma. The annular-shape pattern is transformed into a semi-cyclic-shape when Ac equals to 0.5λ. The dark cores of the depletion patterns are maintained in circular shape. In addition, the depletion patterns are in axial symmetry while suffering the influence from coma. Fig- ures 2(a), (e), (i) and (m) illustrate the changing of de- pletion pattern that sole affected by astigmatism. In this situation, the depletion patterns are in central symmetry. The annular-shaped pattern is likely tore apart into two pieces with the increasing A a value. The dark core is squeezed into line-shaped when 0.3 a A . The transformation of the depletion patterns are getting more complex in the combined impact from coma and astig- matism. The dark cores are distorted to irregular ovals in depletion patterns. It is obvious that in the situation of Aa= 0 the intensity distribution is axial symmetric. In the cases of Ac= 0 the intensity distribution are central symmetric. While coma and astigmatism act together the intensity distribution are neither axial symmetric nor central symmetric. Figures 3, 4 and 5 are drawn in order to better under- stand how the aberration works to depletion pattern. Fig- ure 4 is the intensity cross section view of Figure 2(a) to (d) along axis x. The optical distribution is asymmetric about axis y, it is noticeable that the intensity of the dark cores has increased a bit. The cross section profiles cap- tured respectively along x = y and x = -y are illustrated as Figures 5(a) and (b). The intensity is strong and steep along x = y, while weaker and gentle along x = -y. The intensity at the center of the pattern raises fast with the increasing of Aa. Figures 3. (a) to (i): Three demission view for intensity distribution changing in the situations of Figure 2(f) to Figure 2(h), Figure 2(f) to Figure 2(h) and Figure 2(n) to Figure 2(p) respectively. Copyright © 2013 SciRes. OPJ  C. ZHANG ET AL. 4 Figure 4. Cross section view of optical intensity along axis x in Figure 2(a) to Figure 2(d). Figure 5. Cross section view of optical intensity along axis x = y, x = - y in Figure 2(a), (e), (i) and (m). Figure 3 is drawn for the depletion patterns suffer complex variations in the combined influence of coma and astigmatism. The intensity at center of patterns is nonzero and very uneven at the peripheries. The 3 di- mensional views from Figures 3(a) to (i) are corre- sponding to the situations of Figures 2(f) to (h), Figure 2(f) to (h) and Figure 2(n) to (p) respectively. 4. Conclusions Our work demonstrates the variation of donut-shaped depletion pattern under the combined influence of pri- mary optical aberration. The simulation is based on common STED system which utilizing Gaussian beam, vortex phase plate and aplanatic objective. In view of the particular designed objective and spherical aberration is insensitive to this kind of STED system, the effect of spherical aberration is ignored. The depletion patterns that affected by coma and astigmatism are presented in the assumption of the two factors contribute same mount to wavefront aberration. Through our study, the effects of multiple aberrations to donut-shaped depletion patterns are demonstrated visually, and the STED system is quite sensitive with primary aberrations. The simulation results are helpful guidelines for analyzing the aberration of depletion patterns in real situations. 5. Acknowledgements This work has got many supports from colleagues of Northwest University (NWU), China, and University of South Carolina (USC), United States. Especially, we would like to thank Dr. Baole Lu (NWU), Dr. Xiaoming Chen (NWU), Dr. Wei Zhao (USC), Dr. Fang Yang (USC) and Dr. Jianchao Chen (USC) for their enthusias- tic help. REFERENCES [1] G. Donnert et al., “Macromolecular-Scale Resolution in Biological Fluorescence Microscopy,” Proceedings of the National Academy of Sciences, USA, Vol. 103, August 2006, pp. 11440–11445. doi:10.1073/pnas.060 4965103 [2] R. R. Kellner, C. J. Baier, K. I. Willig, S. W. Hell and F. J. Barrantes, “Nanoscale Organization of Nicotinic Acetyl- choline Receptors Revealed by STED Microscopy,” Neuroscience, Vol. 144, January 2007, pp. 135–143. doi:10.1016/j.neu roscience.2006.08.07 1 [3] R. Schmidt et al., “Spherical Nanosized Spot Unravels the Interior of Cells,” Nature Methods, Vol. 4, May 2008, pp. 81–86. [4] V. Westphal et al., “Video-Rate Far-Field Optical Nano- scopy Dissects Synaptic Vesicle Movement,” Science, Vol. 320,2008, pp. 246–249. [5] L. J. Li, R. R. Gattass, E. Gershgoren, H. Hwang and J. T. Fourkas, “Achieving λ/20 Resolution by One-Color Ini- tiation and Deactivation of Polymerization,” Science, Vol. Copyright © 2013 SciRes. OPJ  C. ZHANG ET AL. 5 324, No. 5929, May 2009, pp. 910-913. [6] T. F. Scott, B. A. Kowalski, A. C. Sullivan, C. N. Bowman and R. R. Mcleod, “Two-Color Single-Photon Photoini- tiation and Photoinhibition for Subdiffraction Photolitho- graphy,” Science, Vol. 324, No. 5929, May 2009, pp. 913-917. [7] Y. Y. Cao, Z. S. Gan, B. H. Jia, R. A. Evans and M. Gu, “High-Photosensitive Resin for Super-Resolution Di- rect-Laser-Writing Based on Photoinhibited Polymeriza- tion,” Optics Express, Vol. 19, Semptember 2011, pp. 19486-19494. [8] X. Hao, C. F. Kuang, T. T. Wang and X. Liu, “Effects of Polarization on the De-excitation Dark Focal Spot in STED Microscopy,” Journal of Optics, Vol. 12, No. 115707, October 2010, pp. 1-8. [9] S. H. Deng, L. Liu, Y. Cheng, R. X. Li and Z. Z. Xu, “Effects of Primary Aberrations on the Fluorescence De- pletion Patterns of STED Microscopy,” Optics Express, Vol. 18, January 2010, pp. 1657-1666. doi:10.1364 /OE.18.001657 [10] D. P. Biss and T. G. Brown, “Primary Aberrations in Focused Radially Polarized Vortex Beams,” Optics Ex- press, Vol. 12, Feberary 2004, pp. 384–393. [11] R. K. Singh, P. Senthikumaran and K. Singh, “Effect of Primary Spherical Aberration on High- Numerical Aper- ture Focusing of A Laguerre- Gaussian Beam,” Journal of the Optical Society of America, Vol. A25, May 2008, pp. 1307-1318. doi:10.1364 /JOSAA.25.0013 07 Copyright © 2013 SciRes. OPJ
|