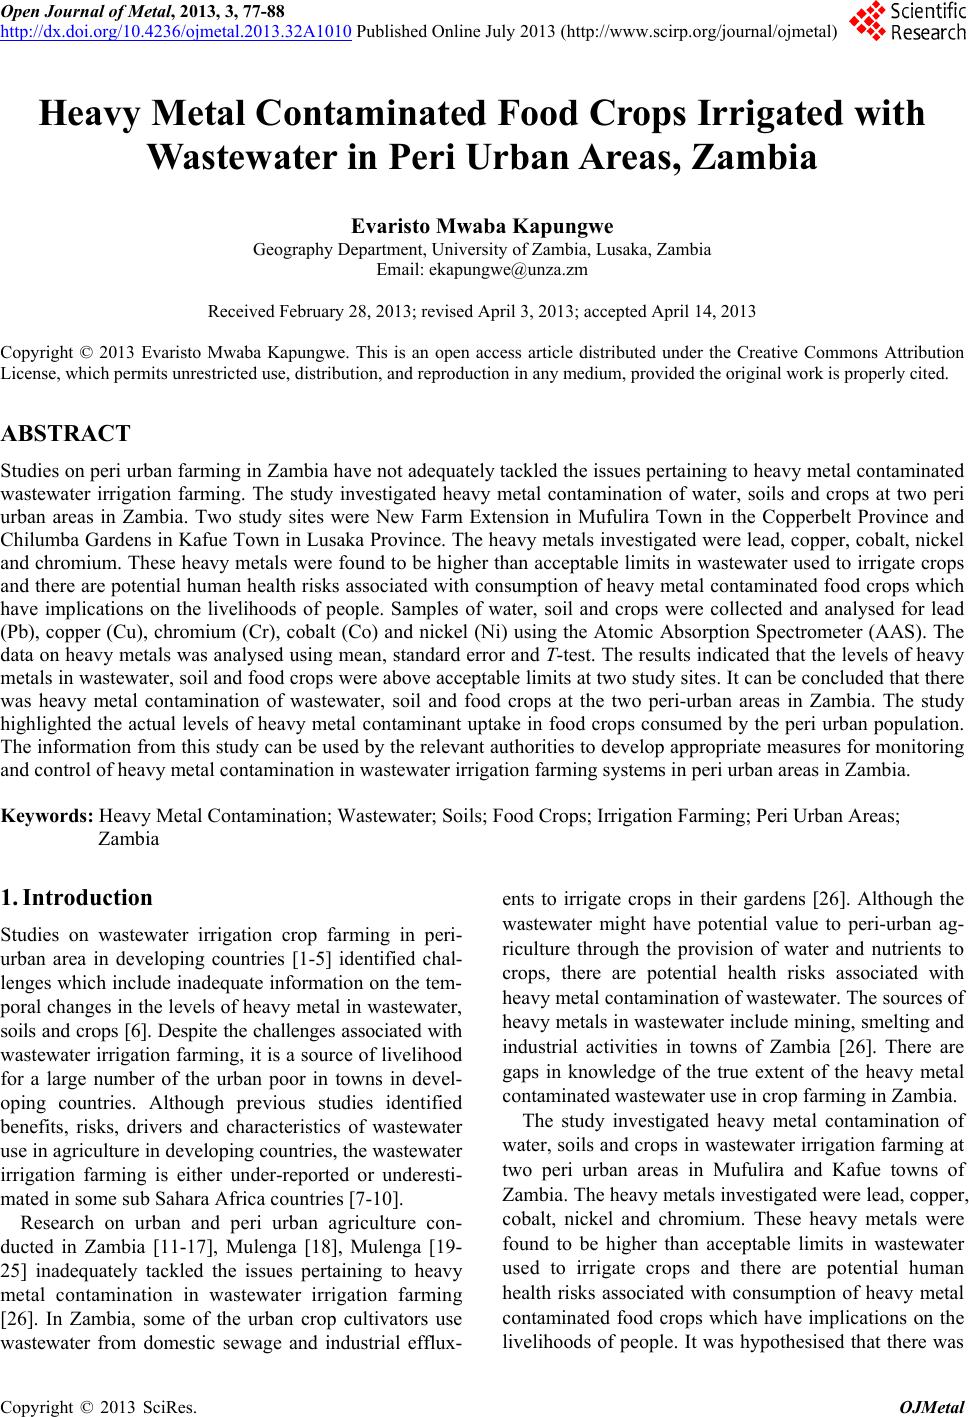
 Open Journal of Metal, 2013, 3, 77-88 http://dx.doi.org/10.4236/ojmetal.2013.32A1010 Published Online July 2013 (http://www.scirp.org/journal/ojmetal) Heavy Metal Contaminated Food Crops Irrigated with Wastewater in Peri Urban Areas, Zambia Evaristo Mwaba Kapungwe Geography Department, University of Zambia, Lusaka, Zambia Email: ekapungwe@unza.zm Received February 28, 2013; revised April 3, 2013; accepted April 14, 2013 Copyright © 2013 Evaristo Mwaba Kapungwe. This is an open access article distributed under the Creative Commons Attribution License, which permits unrestricted use, distribution, and reproduction in any medium, provided the original work is properly cited. ABSTRACT Studies on peri urban farming in Zambia have not adequately tackled the issues pertaining to heavy metal contaminated wastewater irrigation farming. The study investigated heavy metal contamination of water, soils and crops at two peri urban areas in Zambia. Two study sites were New Farm Extension in Mufulira Town in the Copperbelt Province and Chilumba Gardens in Kafue Town in Lusaka Province. The heavy metals investigated were lead, copper, cobalt, nickel and chromium. These heavy metals were found to be higher than acceptable limits in wastewater used to irrigate crops and there are potential human health risks associated with consumption of heavy metal contaminated food crops which have implications on the livelihoods of people. Samples of water, soil and crops were collected and analysed for lead (Pb), copper (Cu), chromium (Cr), cobalt (Co) and nickel (Ni) using the Atomic Absorption Spectrometer (AAS). The data on heavy metals was analysed using mean, standard error and T-test. The results indicated that the levels of heavy metals in wastewater, soil and food crops were above acceptable limits at two study sites. It can be concluded that there was heavy metal contamination of wastewater, soil and food crops at the two peri-urban areas in Zambia. The study highlighted the actual levels of heavy metal contaminant uptake in food crops consumed by the peri urban population. The information from this study can be used by the relevant authorities to develop appropriate measures for monitoring and control of heavy metal contamination in wastewater irrigation farming systems in peri urban areas in Zambia. Keywords: Heavy Metal Contamination; Wastewater; Soils; Food Crops; Irrigation Farming; Peri Urban Areas; Zambia 1. Introduction Studies on wastewater irrigation crop farming in peri- urban area in developing countries [1-5] identified chal- lenges which include inadequate information on the tem- poral changes in the levels of heavy metal in wastewater, soils and crops [6]. Despite the challenges associated with wastewater irrigation farming, it is a source of livelihood for a large number of the urban poor in towns in devel- oping countries. Although previous studies identified benefits, risks, drivers and characteristics of wastewater use in agriculture in developing countries, the wastewater irrigation farming is either under-reported or underesti- mated in some sub Sahara Africa countries [7-10]. Research on urban and peri urban agriculture con- ducted in Zambia [11-17], Mulenga [18], Mulenga [19- 25] inadequately tackled the issues pertaining to heavy metal contamination in wastewater irrigation farming [26]. In Zambia, some of the urban crop cultivators use wastewater from domestic sewage and industrial efflux- ents to irrigate crops in their gardens [26]. Although the wastewater might have potential value to peri-urban ag- riculture through the provision of water and nutrients to crops, there are potential health risks associated with heavy metal contamination of wastewater. The sources of heavy metals in wastewater include mining, smelting and industrial activities in towns of Zambia [26]. There are gaps in knowledge of the true extent of the heavy metal contaminated wastewater use in crop farming in Zambia. The study investigated heavy metal contamination of water, soils and crops in wastewater irrigation farming at two peri urban areas in Mufulira and Kafue towns of Zambia. The heavy metals investigated were lead, copper, cobalt, nickel and chromium. These heavy metals were found to be higher than acceptable limits in wastewater used to irrigate crops and there are potential human health risks associated with consumption of heavy metal contaminated food crops which have implications on the livelihoods of people. It was hypothesised that there was C opyright © 2013 SciRes. OJMetal 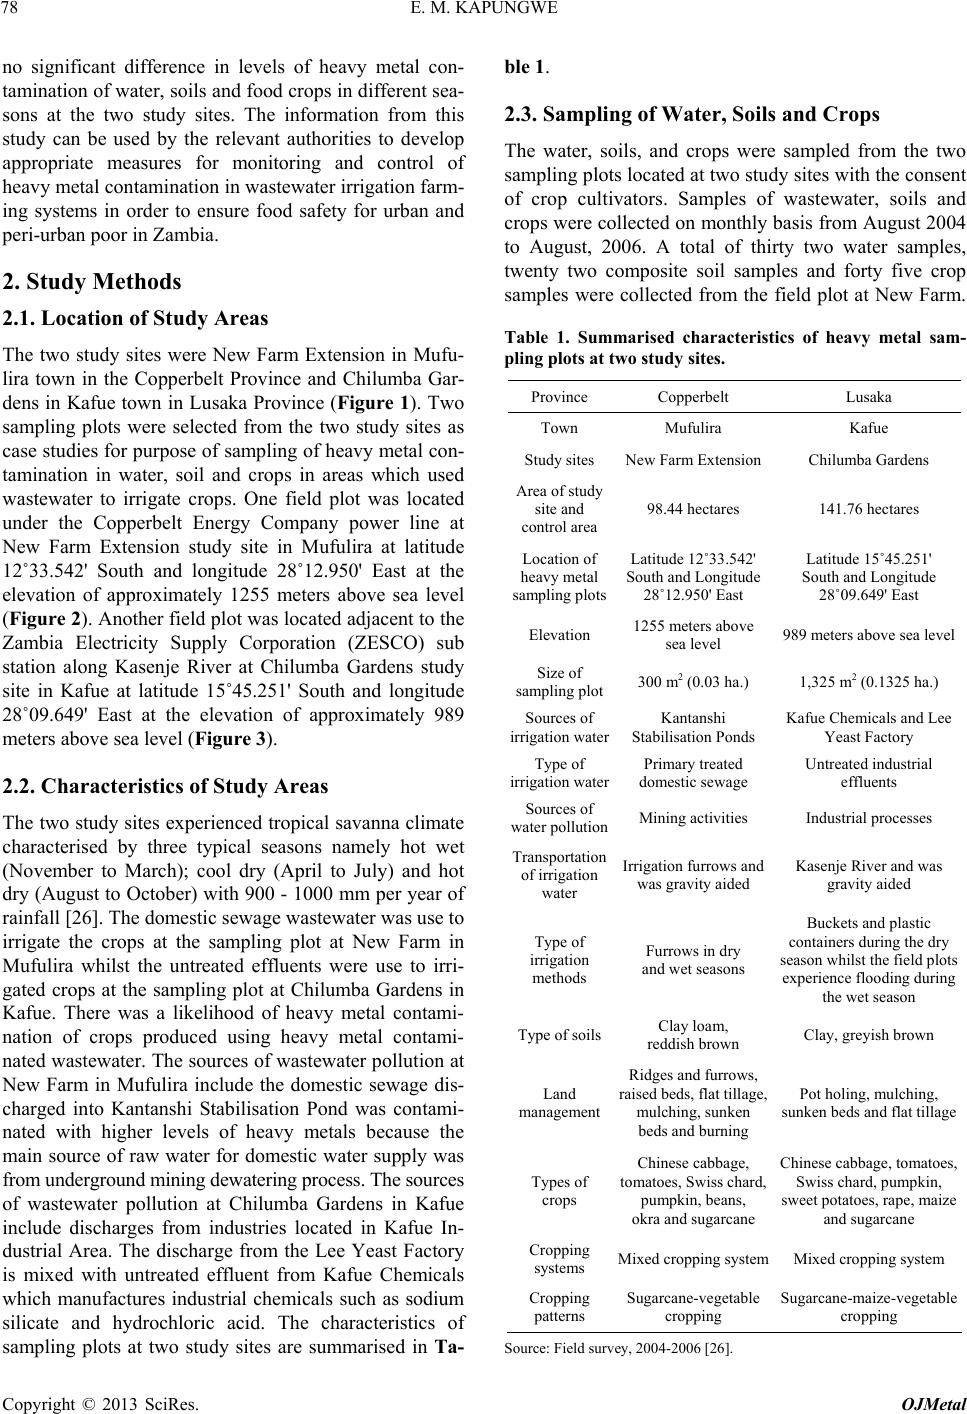 E. M. KAPUNGWE 78 no significant difference in levels of heavy metal con- tamination of water, soils and food crops in different sea- sons at the two study sites. The information from this study can be used by the relevant authorities to develop appropriate measures for monitoring and control of heavy metal contamination in wastewater irrigation farm- ing systems in order to ensure food safety for urban and peri-urban poor in Zambia. 2. Study Methods 2.1. Location of Study Areas The two study sites were New Farm Extension in Mufu- lira town in the Copperbelt Province and Chilumba Gar- dens in Kafue town in Lusaka Province (Figure 1). Two sampling plots were selected from the two study sites as case studies for purpose of sampling of heavy metal con- tamination in water, soil and crops in areas which used wastewater to irrigate crops. One field plot was located under the Copperbelt Energy Company power line at New Farm Extension study site in Mufulira at latitude 12˚33.542' South and longitude 28˚12.950' East at the elevation of approximately 1255 meters above sea level (Figure 2). Another field plot was located adjacent to the Zambia Electricity Supply Corporation (ZESCO) sub station along Kasenje River at Chilumba Gardens study site in Kafue at latitude 15˚45.251' South and longitude 28˚09.649' East at the elevation of approximately 989 meters above sea level (Figure 3). 2.2. Characteristics of Study Areas The two study sites experienced tropical savanna climate characterised by three typical seasons namely hot wet (November to March); cool dry (April to July) and hot dry (August to October) with 900 - 1000 mm per year of rainfall [26]. The domestic sewage wastewater was use to irrigate the crops at the sampling plot at New Farm in Mufulira whilst the untreated effluents were use to irri- gated crops at the sampling plot at Chilumba Gardens in Kafue. There was a likelihood of heavy metal contami- nation of crops produced using heavy metal contami- nated wastewater. The sources of wastewater pollution at New Farm in Mufulira include the domestic sewage dis- charged into Kantanshi Stabilisation Pond was contami- nated with higher levels of heavy metals because the main source of raw water for domestic water supply was from underground mining dewatering process. The sources of wastewater pollution at Chilumba Gardens in Kafue include discharges from industries located in Kafue In- dustrial Area. The discharge from the Lee Yeast Factory is mixed with untreated effluent from Kafue Chemicals which manufactures industrial chemicals such as sodium silicate and hydrochloric acid. The characteristics of sampling plots at two study sites are summarised in Ta- ble 1. 2.3. Sampling of Water, Soils and Crops The water, soils, and crops were sampled from the two sampling plots located at two study sites with the consent of crop cultivators. Samples of wastewater, soils and crops were collected on monthly basis from August 2004 to August, 2006. A total of thirty two water samples, twenty two composite soil samples and forty five crop samples were collected from the field plot at New Farm. Table 1. Summarised characteristics of heavy metal sam- pling plots at two study sites. Province Copperbelt Lusaka Town Mufulira Kafue Study sites New Farm Extension Chilumba Gardens Area of study site and control area 98.44 hectares 141.76 hectares Location of heavy metal sampling plots Latitude 12˚33.542' South and Longitude 28˚12.950' East Latitude 15˚45.251' South and Longitude 28˚09.649' East Elevation 1255 meters above sea level 989 meters above sea level Size of sampling plot300 m2 (0.03 ha.) 1,325 m2 (0.1325 ha.) Sources of irrigation water Kantanshi Stabilisation Ponds Kafue Chemicals and Lee Yeast Factory Type of irrigation water Primary treated domestic sewage Untreated industrial effluents Sources of water pollutionMining activities Industrial processes Transportation of irrigation water Irrigation furrows and was gravity aided Kasenje River and was gravity aided Type of irrigation methods Furrows in dry and wet seasons Buckets and plastic containers during the dry season whilst the field plots experience flooding during the wet season Type of soilsClay loam, reddish brown Clay, greyish brown Land management Ridges and furrows, raised beds, flat tillage, mulching, sunken beds and burning Pot holing, mulching, sunken beds and flat tillage Types of crops Chinese cabbage, tomatoes, Swiss chard, pumpkin, beans, okra and sugarcane Chinese cabbage, tomatoes, Swiss chard, pumpkin, sweet potatoes, rape, maize and sugarcane Cropping systems Mixed cropping system Mixed cropping system Cropping patterns Sugarcane-vegetable cropping Sugarcane-maize-vegetable cropping Source: Field survey, 2004-2006 [26]. Copyright © 2013 SciRes. OJMetal  E. M. KAPUNGWE Copyright © 2013 SciRes. OJMetal 79 Lake Bangweulu Lake Mweru Lake Kariba Itezhi tezhi Dam Chipata Kasama Isoka Mporokoso Nchelenge Mbala Tunduma Chama Mpika Serenje Mkushi Kapiri Mposhi Ndola Luanshya Mufulira Chilil abomb we Kitwe Solwezi Mansa Samfya Kabwe Petauke LUSAKA Luangwa Kafue Namwala Monze Siavonga Livingstone Senanga Sesheke Mongu Kalabo Lukulu Mwinilunga Zambezi Kasempa Kabompo Kaoma Mumbwa International Boundary Major Road Railway Study Towns Other Tow ns LEGEND 9 S 15 S 12 S 28 18 S East 22 15 S 9 25 31 Capital City Lake Tanganyika 010020 0 km 28 22 E 12 S RELATIVE LOCATION OF ZAMBIA IN SOUTHERN AFRICA ZAMBIA ZIMBABWE BOTSWANA ANGOLA CONGO D. R. NAMIBIA SOUTH AFRICA LESOTHO SWAZILAND TANZANIA KENYA UGANDA RUANDA BURUNDI CAMERON N 34 Figure 1. Location of Mufulira and Kafue study towns in Zambia [26]. The soil auger was used to obtain soil sub samples from the depth of 0 - 20 cm from five places located ran- domly in each sampling plot and the sub samples were mixed in order to form a composite sample. The depth of 20 cm was chosen because the roots of crops penetrate to such depth of subsoil to extract the necessary nutrients and other elements needed for plant growth. Furthermore a total of forty four water samples, twenty seven composite soil samples and forty two crop samples were collected from the another field plot at Chilumba Gardens. The water, soils and crops samples were taken to the laboratory for preparation of extract and determi- nation of levels of heavy metals. The water, soils and crops samples were collected us- ing standard sampling methods [27,28]. Samples of wa- ter were collected from stream channels and irrigation furrows in the cultivated fields where the crop cultivators drew water for irrigation of crops. The metal ions in the water samples were mobilised through addition of diluted nitric acid. The samples of edible parts of food crops that were collected from the two sampling plots at the two study sites comprised sugarcane stalk, okra fruits, tomato fruits, sweet potato leaves, Chinese cabbage leaves, Swiss chard leaves, pumpkin leaves, bean leaves and rape leaves. The eaves or fruits were collected randomly from the same l  E. M. KAPUNGWE 80 28 10’E 28 10’E 12 35’S12 35’S 0750 1500 metres Planne d Settlements Un-planned Settlements Small Holding Scattered Cultivation Waste Water Irrigated Area Commercial Farm Sewer Pond Water Bodies/Major River Floodplain Irrigation Channe l Stream Main Road Other Ro a d Footpath/Track Power Line Waste Water Channel Slope S t udy Site Boundary Water Pollution Sources Heavy Metal Sampling Plot Domestic Sewage Water Flow Mining Waste Water Flow KAWAMA WEST KANKOYO Kafue CEC Sub- station Data Source: Aerial photographs of Mufulira datedJuly/August 1993, Field Survey, 2006. NEW FARM TAILING TAILING DAM DAM N Figure 2. Location of Mufulira and Kafue study towns in Zambia [26]. plot where the soil samples were collected. 2.4. Preparation of Water, Soils and Crops Extracts Three standard preparation methods were used to prepare extracts of water, soils and crops. The water and soil sam- ples were prepared for analysis of bio-available heavy metals whilst the crop plant materials were prepared for analysis of total heavy metals [29]. The standard preparation method for preparation of extracts of water included: 1) Decanting of water into beaker: A total amount of 100 ml of water was decanted in a 100 ml beaker after water sample bottles were first shaken mechanically. 2) Filtration of water: The water was filtered using Double Ring No. 102 filter papers in order to remove fine particles and suspended materials which would have affected the reading of heavy metals by the Atomic Ab- sorption Spectrometer (AAS). The water filtrate was col- lected for determination of bio-available heavy metals in wastewater. The standard methods of preparation of soils com- prised of several stages ([29] which included): 1) Air drying and sieving of soil samples: The soil samples were dried by placing them on shallow mela- mine plastic trays in ambient air. The dried soils were crushed gently and sieved through a 2 mm mesh size steel sieve. The roots, gravel, stones, gravel and other materials that remained on the sieve were discarded. 2) Addition of extraction solution to soil: A total of forty milligrams (40 ml) of the Diethylene triamine pen- toacetic acid (DTPA) extracting solution was mixed with twenty grams (25 g) of dry soils sub-sample. Copyright © 2013 SciRes. OJMetal 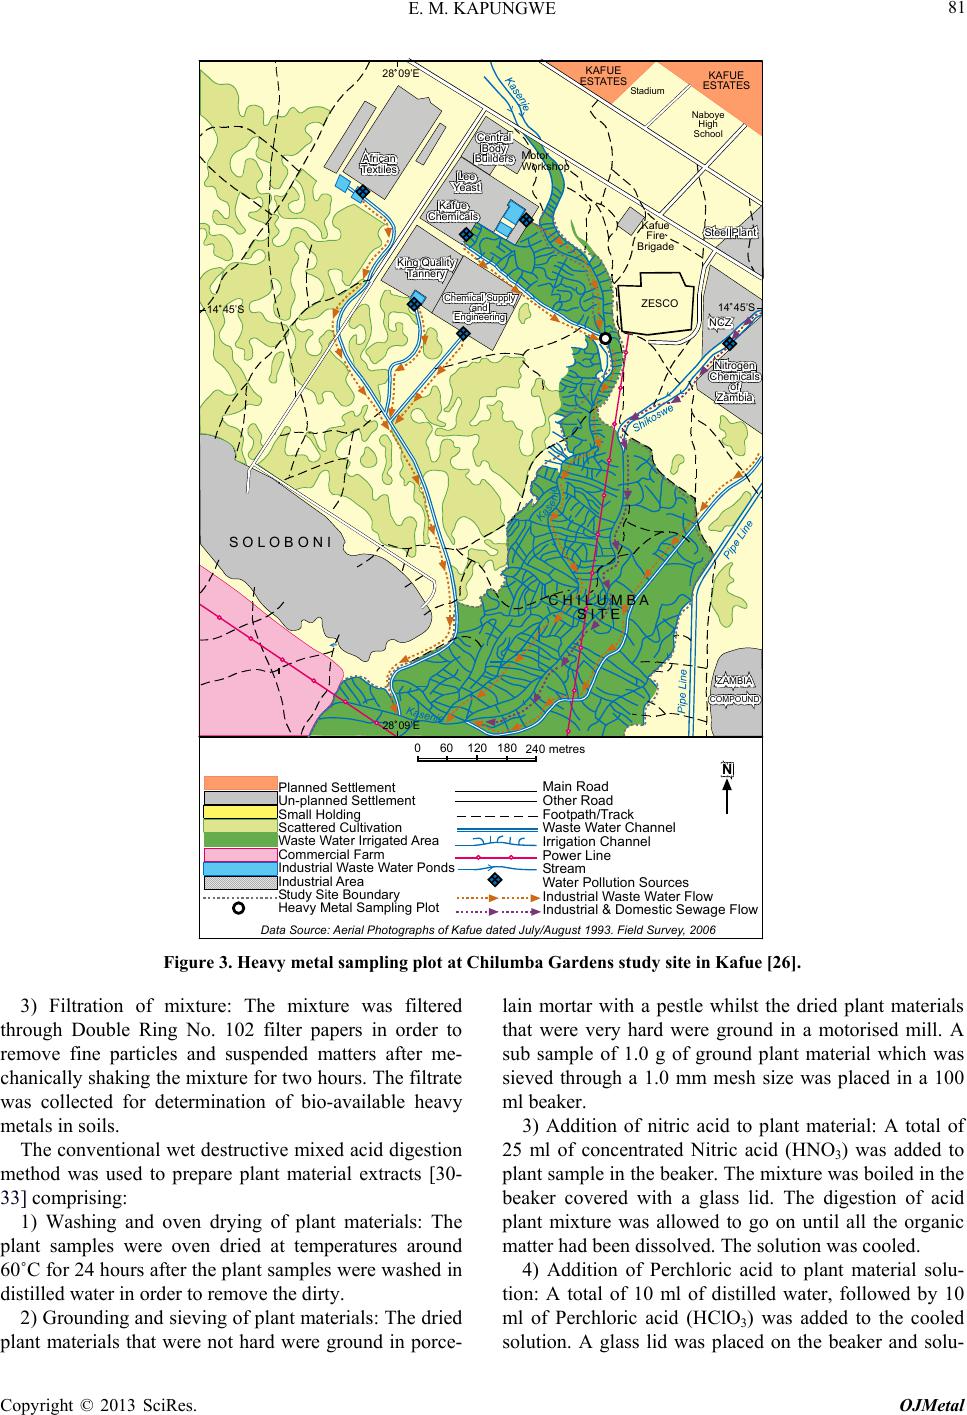 E. M. KAPUNGWE 81 0120 240 metres 18060 Data S ource: Aerial Photogr aphs of Kafu e dated July/August 1993. Field Survey, 2006 Planned Settlement Un-planned Settlement Small Holding Scattered Cultivation Waste Water Irrigated Area Commercial Farm Industrial Waste Water Ponds Industrial Area Study Site Boundary Heavy Metal Sampling Plot Main Road Other Road Footpath/Track W as t e Wa te r Channel Irrigation Channel Power Line Stream Water Pollution Sources Industrial Waste Water Flow Industrial & Domest ic Sewage Flow Naboye High School Stadium Kafue Fire Brigade Lee Yeast King Quality Tannery Central Body Builders Steel Plant Motor Workshop ZESCO S O L O B O N I 14 45’S 1445’S 28 09’E 28 09’E African Textiles NCZ Nitrogen Chemicals of Zambia Chem i c al Supp l y and Engineering Kafue Chemicals KAFUE ESTATES KAFUE ESTATES ZAMBIA COMPOUND C H I L U M B A S I T E N Figure 3. Heavy metal sampling plot at Chilumba Gardens study site in Kafue [26]. 3) Filtration of mixture: The mixture was filtered through Double Ring No. 102 filter papers in order to remove fine particles and suspended matters after me- chanically shaking the mixture for two hours. The filtrate was collected for determination of bio-available heavy metals in soils. The conventional wet destructive mixed acid digestion method was used to prepare plant material extracts [30- 33] comprising: 1) Washing and oven drying of plant materials: The plant samples were oven dried at temperatures around 60˚C for 24 hours after the plant samples were washed in distilled water in order to remove the dirty. 2) Grounding and sieving of plant materials: The dried plant materials that were not hard were ground in porce- lain mortar with a pestle whilst the dried plant materials that were very hard were ground in a motorised mill. A sub sample of 1.0 g of ground plant material which was sieved through a 1.0 mm mesh size was placed in a 100 ml beaker. 3) Addition of nitric acid to plant material: A total of 25 ml of concentrated Nitric acid (HNO3) was added to plant sample in the beaker. The mixture was boiled in the beaker covered with a glass lid. The digestion of acid plant mixture was allowed to go on until all the organic matter had been dissolved. The solution was cooled. 4) Addition of Perchloric acid to plant material solu- tion: A total of 10 ml of distilled water, followed by 10 ml of Perchloric acid (HClO3) was added to the cooled solution. A glass lid was placed on the beaker and solu- Copyright © 2013 SciRes. OJMetal  E. M. KAPUNGWE 82 tion was boiled on a hot plate until the solution was clear or when white fumes were seen coming from the solution which indicated that the digestion had been completed. The digested solution was cooled. 5) Addition of distilled water to digested solution: A total of twenty five (25) ml of distilled water was added to the cooled digested solution and the mixture boiled on a hot plate. The digested solution was again cooled. 6) Digested solution filtered: The cooled digested so- lution was filtered through the Double Ring No. 102 fil- ter papers into a 100 ml volumetric flask and made up to 100 ml with distilled water. The plant filtrate was trans- ferred into a 100 ml plastic container for the analysis of heavy metals in crop plant materials using the AAS ma- chine. 2.5. Determination of Heavy Metals in Water, Soils and Crops The water, soils and crops filtrates were taken to the Atomic Absorption Spectrometer (AAS) Perkin Elmer A Analyst 400 machine for reading of heavy metals [34]. The heavy metals analysed by the AAS included chro- mium, nickel, copper, lead and cobalt. The AAS proce- dures used to analyse heavy metals in the laboratory in- clude: 1) Calibration of ASS using standards for each ele- ment: The AAS was calibrated using standards for each element. The AAS was calibrated using standards for each element that are made in distilled water for water samples. The AAS was calibrated using standards for each element that are made in DTPA for soil samples. The AAS was calibrated using standards for each ele- ment made in 5% nitric acid for crop samples. 2) Reading of heavy metals in filtrates using the AAS machine: Each element was read using specific lamps depending on the elements (Table 2). For samples read- ing higher than the highest standard, a dilution was done and was used to bring to volume. A blank sample was also read and the value of the blank was used in correct- ing the readings of the samples. The machine was recali- brated after reading 20 samples. After the concentrations of the samples have been read on AAS, calculations were then made for the elements in the original sample. The details of AAS machine reading of levels of heavy metals in filtrates are explained in Table 2. 2.6. Control the Quality of Laboratory Analysis The quality of laboratory analysis of samples of soils, wastewater and edible crops was occasionally checked. Every 10th sample was a blank of distilled water but the technician did not know it was a blank. Furthermore, soil and hay reference samples were consistently place among the sample extracts from soil and crops. Table 2. Parameters set on the perkin elmer a analyst 400 atomic absorption spectrometer. Lamp specification Elements Band width (nm) Wavelength (nm) Lamp current (mɅ) Detection limits (mg/l) Flame type Copper 0.7 324.8 15 - 25 0.001 Air Lead 0.7 283.3 10 - 25 0.01 Air Cobalt 0.2 240.7 15 - 25 0.006 Air Chromium0.7 357.9 15 - 25 0.002 Air Nickel 0.2 232.0 30 - 35 0.004 Air 2.7. Analysis of Data The data analysis included: 1) Statistical analysis of data: The means and standard errors were calculated for levels of heavy metals in wastewater, soils and food crops which were presented in tables. The hypothesis was tested using T-test values at significance level of 0.05, two tailed [35,36]. 2) Acceptable limits for water, soils and crops: The levels of heavy metals in wastewater were compared with Food and Agriculture Organisation (FAO) irrigation water acceptable limits [37]. The levels of heavy metals in soils were compared to European Union/United King- dom legislative limits [38-40]. The levels of copper, lead in the food crops at the two sites were compared to ac- ceptable limits as set by Zambian legislative limits [41], FAO/WHO guidelines [42], EC Standards [43], and UK guidelines [44] and whilst chromium and nickel present in crops were compared to acceptable limits as outlined in the study on chemical speciation of heavy metals in sewage sludge and related matrice [45]. The Ministry of Environment Ontario Canada standards for cobalt in crops were used as acceptable limits [46]. 3. Results and Discussions 3.1. Heavy Metal Contamination of Wastewater The results on the levels of heavy metals in wastewater used to irrigate crops at the two study sites are shown in Table 3. The results indicated that levels of copper and chro- mium in wastewater at New Farm were above the ac- ceptable limits in the hot dry season (Tab le 3) whilst the levels of copper, cobalt, chromium and nickel in waste- water at Chilumba Gardens were above the acceptable limits in the cool dry and hot dry seasons (Table 3). In other words, there was heavy metal contamination of wastewater at the New Farm in Mufulira and Chilumba Gardens in Kafue. The levels of cobalt in water indicated that there were significant differences between New Farm and Chilumba Gardens (T test = −3.55, df = 69, P < 0.05). The levels of Copyright © 2013 SciRes. OJMetal  E. M. KAPUNGWE Copyright © 2013 SciRes. OJMetal 83 cobalt in water were relatively higher at Chilumba Gar- dens than New Farm because of the presences of the Ka- fue Chemical Factory in the Kafue Industrial Area which discharged the untreated effluents into the environment. The levels of chromium water were significantly differ- ent between New Farm and Chilumba Gardens (T test = −2.27, df = 69, P < 0.05). The levels of chromium in water were relatively higher at Chilumba Gardens than New Farm because of the presences of the leather tan- nery in the Kafue Industrial Area which discharged the effluents of chromate salts into the environment. The probable reason for heavy metal contamination of wastewater in the hot dry season at New Farm in Mufu- lira was that the domestic wastewater was laden with heavy metals from copper processing at Mopani Copper Mines in Mufulira. The probable reason for heavy metal contamination of wastewater at the Chilumba Gardens was that the main source of irrigation wastewater was untreated effluent from Lee Yeast Factory and Kafue Chemicals in Kafue Estate Industrial Area operated throughout the year. The relatively high levels of heavy metals in irrigation water at New Farm in Mufulira, Chi- lumba Gardens in Kafue indicated heavy metal contami- nation of water which was similar to the results from the study at Firle Farm in Harare, Zimbabwe where vegeta- bles were irrigated with admixtures of sewage and sew- age sludge contaminated with heavy metals [47]. Fur- thermore, the results from this study were similar to findings from study on the Mwambashi catchment area in the Copperbelt Province, Zambia which indicated that mining activities have negative affected the water quality along the Mwambashi River and its tributaries in both the dry and wet seasons [48]. 3.2. Heavy Metal Contamination of Soil The results on the levels of heavy metals in soils at the two study sites are shown in Table 4. The results indicated that levels of copper in soils at New Farm were above the acceptable limits whilst the levels of heavy metals in soils at Chilumba Gardens were within acceptable limits (Table 4). The levels of copper Table 3. Heavy metals (mg/l) in water at New Farm and Chilumba Gardens study sites. Seasons No. of samples Copper (Cu) Lead (Pb) Cobalt (Co) Chromium (Cr) Nickel (Ni) New Farm Extension study site in Mufulira Hot wet: Nov-Mar 13 0.08 ± 0.02 0.02 ± 0.01 ND ND 0.03 ± 0.01 Cool dry: Apr-Jul 7 0.04 ± 0.02 0.36 ± 0.25 0.03 ± 0.01 0.05 ± 0.02 ND Hot dry: Aug-Oct 12 0.53 ± 0.17* 0.02 ± 0.01 ND 0.18 ± 0.07* 0.01 ± 0.00 Chilumba Gardens study site in Kafue Hot wet: Nov-Mar 12 0.01 ± 0.02 0.03 ± 0.01 0.03 ± 0.02 ND 0.06 ± 0.01 Cool dry: Apr-Jul 19 0.06 ± 0.01 0.71 ± 0.33 0.09 ± 0.02* 0.21 ± 0.05 0.37 ± 0.17* Hot dry: Aug-Oct 13 0.23 ± 0.04* 0.08 ± 0.04 ND 0.33 ± 0.09* 0.12 ± 0.02 aAO Heavy metal acceptable limits 0.2 5.0 0.05 0.1 0.2 ND = not detected; *Heavy metals above acceptable limits; Source of data: Field data, 2004-2005. Table 4. Heavy metals (mg/kg) in soils at New Farm and Chilumba Gardens study sites. No. of samples Copper (Cu) Lead (Pb) Cobalt (Co) Chromium (Cr) Nickel (Ni) New Farm Extension study site in Mufulira Hot wet: Nov-Mar 8 219 ± 25.34* 0.06 ± 0.44 0.14 ± 0.03 0.34 ± 0.01 12.8 ± 8.14 Cool dry: Apr-Jul 6 31.72 ± 8.70 0.50 ± 0.31 0.32 ± 0.08 0.21 ± 0.14 1.37 ± 0.70 Hot dry: Aug-Oct 8 58.62 ± 9.97 0.13 ± 0.07 0.22 ± 0.09 0.11 ± 0.06 0.22 ± 0.07 Chilumba Gardens study site in Kafue Hot wet: Nov-Mar 10 6.48 ± 0.57 0.54 ± 0.94 0.38 ± 0.98 0.21 ± 0.00 0.52 ± 0.05 Cool dry: Apr-Jul 9 8.95 ± 1.67 2.08 ± 0.87 1.20 ± 0.18 0.11 ± 0.07 2.94 ± 1.23 Hot dry: Aug-Oct 8 6.15 ± 0.82 0.55 ± 0.20 0.23 ± 0.09 0.08 ± 0.06 0.35 ± 0.12 Heavy metal acceptable limits 130 - 140 450 - 300 240 130 - 150 50 - 75 ND = not detected; *Heavy metals above acceptable limits; Source of data: Field data, 2004-2005.  E. M. KAPUNGWE 84 were significantly different between New Farm and Chi- lumba Gardens (T test = 4.95, df = 45, P < 0.05). The relatively high levels of copper in soils at New Farm in Mufulira can be attributed to the use of heavy metal con- taminated wastewater in the irrigation of crops at the plot and the relatively higher natural background levels of copper in the soils which can contribute to high levels of copper in the soils at New Farm because the New Farm study site was located in copper ore mining areas in Mufulira. The relatively high levels of copper in the soil at New Farm can be compared to the average natural background levels of copper ranged from 141 to 150 mg/kg in the Copperbelt region where mining activities took place [49,50]. Generally, it can be argued that the levels of copper in soil at New Farm in Mufulira were greater than average background levels of copper in the Copperbelt region. The heavy metal contamination of soil at New Farm in Mufulira was similar to findings from the study on heavy metals in contaminated soils and food crops irrigated with wastewater in Beijing, China indicated a substantial build-up of heavy metals in wastewater irrigated soils [51]. 3.3. Heavy Metal Contamination of Crops The results on the levels of heavy metals in crops at the two study sites are shown in Table 5. The results indi- cated that the levels of copper, lead, chromium and nickel in the food crops exceeded acceptable limits. The levels of cobalt in the food crops did not exceeded ac- ceptable limits. It can be argued that there was heavy metal contamination of food crops at the two study sites. The highest levels of heavy metals in food crops were recorded during the wet season. Some crops were con- taminated by heavy metals whilst other crops were not contaminated with heavy metals at the two study sites (Table 5). The results from this study indicated that some crops are less sensitive and can grow where the metal loading rates are higher which confirmed that dif- ferent plant species have different capacity and capability to accumulate the heavy metals [52-54]. The levels of copper in sugarcane were significantly different at New Farm and Chilumba (T test = 5.64, df = 22, P < 0.05). The relatively high levels of copper in sugarcane stalk stem at New Farm in Mufulira can be attributed to domestic wastewater laden with copper from copper processing [55,56] and higher natural copper back- ground levels in the soils. The findings from this study indicated that there was heavy metal contamination of food crops at the two study sites were similar to the results from other studies in de- veloping countries. The study on wastewater irrigation farming in Varanasi, India which indicated that there were seasonal differences in the heavy metal concentra- tions in the edible portion of Beta vulgaris [57]. The re- sults from this study confirmed the findings from the study on heavy metals uptake by vegetable crops from metal contamination in Tehran, Iran [58]. It can be ar- gued that there are potential health risks for the urban population who consume these vegetables and other food crops which have high levels of heavy metals that above the maximum recommended values by relevant authori- ties. 4. Conclusion It can be concluded that there was heavy metal contami- nation of wastewater, soil and food crops at the two peri- urban areas in Zambia. The implications for the heavy metal contaminated of irrigation wastewater, soils and food crops are four fold. Firstly, the treated domestic sew- age wastewater and untreated industrial effluents were not suitable for crop irrigation. Secondly, there is the like- lihood of soil toxicity through accumulation of bio- available forms of heavy metals and fate of organics in soils; transfer of heavy metal contaminations to crops. Thirdly, the crops which recorded heavy metal contami- nation can be used as key indicators of heavy metal con- tamination in the cropping systems. Fourthly, there are potential health risks associated with consumption of heavy metal contaminated food crops grown in waste- water irrigation farming systems in peri-urban areas in Zambia. Despite the inherent dangers and the potential health risks associated with consumption of heavy metal contaminated food crops, it is a source of livelihood for a large number of the urban poor in towns of Copperbelt and Lusaka Provinces, Zambia. There were significant differences between New Farm and Chilumba Gardens in the levels of heavy metal contamination of wastewater, soil and crops in different seasons which implies that there were temporal and spatial variations in the levels of heavy metal contamination of water, soils and vegetables at the two study sites. Previous studies indicated that heavy metal contamination usually occurred mostly in the Copperbelt province, Zambia whilst this study inden- tified that heavy metal contamination took place in the Lusaka and Copperbelt provinces in Zambia .The results from this study confirmed the findings from other studies in developing countries. The information from this study can be used in the planning and development of safe wastewater irrigation farming systems in peri urban areas in Zambia. 5. Acknowledgements The DFID UK project R8160 provided the funds to fa- cilitate data collection. The Staff Development Office in the University of Zambia granted the study leave which Copyright © 2013 SciRes. OJMetal 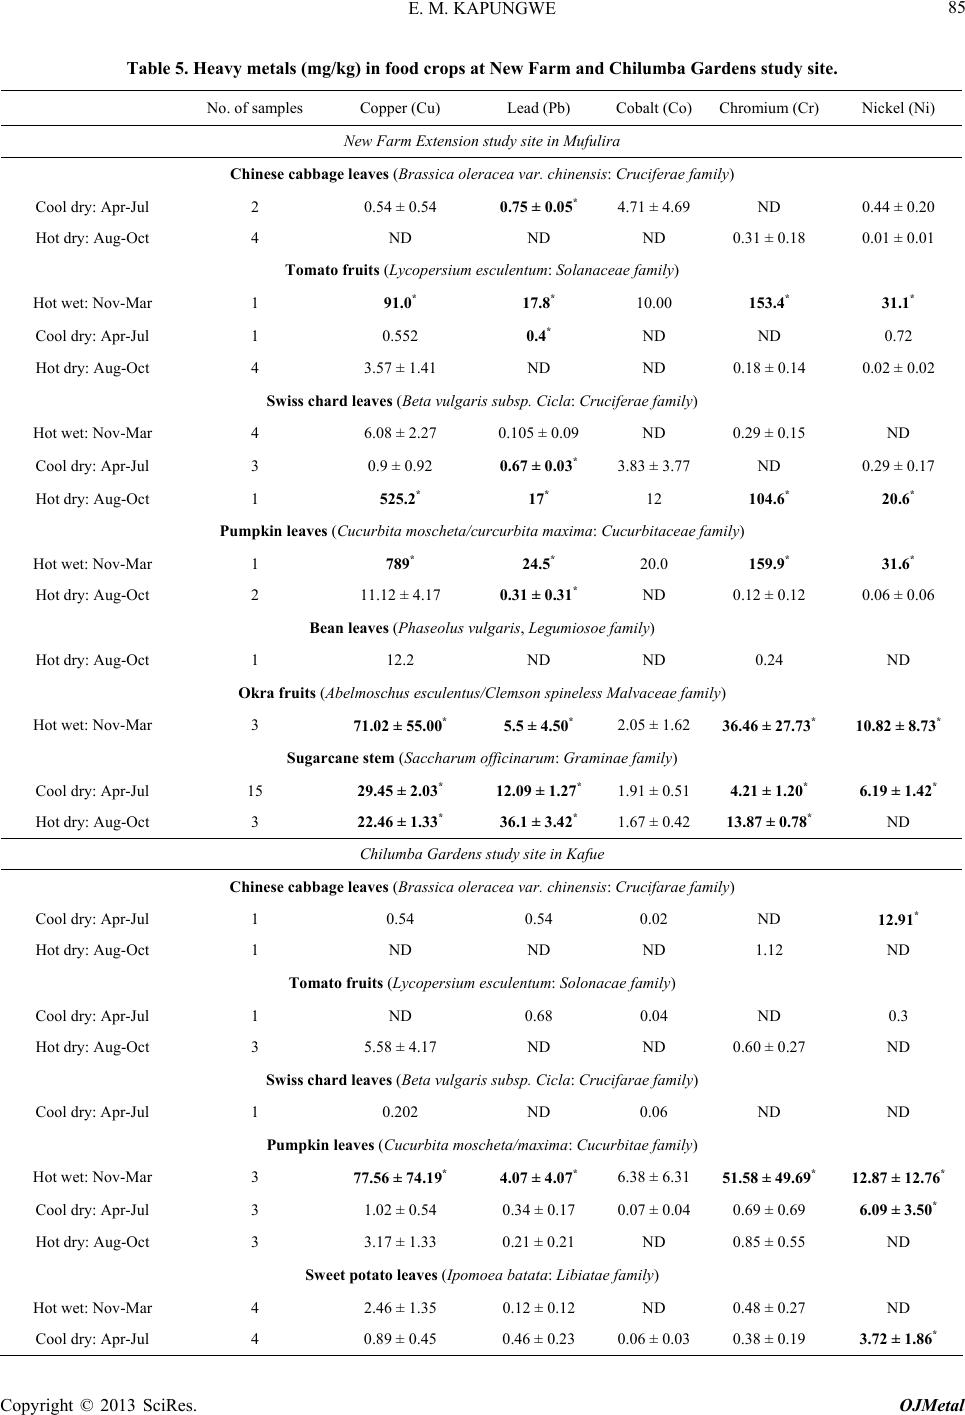 E. M. KAPUNGWE 85 Table 5. Heavy metals (mg/kg) in food crops at New Farm and Chilumba Gardens study site. No. of samples Copper (Cu) Lead (Pb) Cobalt (Co)Chromium (Cr) Nickel (Ni) New Farm Extension study site in Mufulira Chinese cabbage leaves (Brassica oleracea var. chinensis: Cruciferae family) Cool dry: Apr-Jul 2 0.54 ± 0.54 0.75 ± 0.05* 4.71 ± 4.69ND 0.44 ± 0.20 Hot dry: Aug-Oct 4 ND ND ND 0.31 ± 0.18 0.01 ± 0.01 Tomato fruits (Lycopersium esculentum: Solanaceae family) Hot wet: Nov-Mar 1 91.0* 17.8* 10.00 153.4* 31.1* Cool dry: Apr-Jul 1 0.552 0.4* ND ND 0.72 Hot dry: Aug-Oct 4 3.57 ± 1.41 ND ND 0.18 ± 0.14 0.02 ± 0.02 Swiss chard leaves (Beta vulgaris subsp. Cicla: Cruciferae family) Hot wet: Nov-Mar 4 6.08 ± 2.27 0.105 ± 0.09 ND 0.29 ± 0.15 ND Cool dry: Apr-Jul 3 0.9 ± 0.92 0.67 ± 0. 03* 3.83 ± 3.77ND 0.29 ± 0.17 Hot dry: Aug-Oct 1 525.2* 17* 12 104.6* 20.6* Pumpkin leaves (Cucurbita moscheta/curcurbita maxi ma: Cucurbitaceae family) Hot wet: Nov-Mar 1 789* 24.5* 20.0 159.9* 31.6* Hot dry: Aug-Oct 2 11.12 ± 4.17 0.31 ± 0.31* ND 0.12 ± 0.12 0.06 ± 0.06 Bean leaves (Phaseolus vulgaris, Legumiosoe family) Hot dry: Aug-Oct 1 12.2 ND ND 0.24 ND Okra fruits (Abelmoschus esculentus/Clemson spineless Malvaceae family) Hot wet: Nov-Mar 3 71.02 ± 55.00* 5.5 ± 4.50* 2.05 ± 1.6236.46 ± 27.73* 10.82 ± 8.73* Sugarcane stem (Saccharum officinarum: Graminae family) Cool dry: Apr-Jul 15 29.45 ± 2.03* 12.09 ± 1.27* 1.91 ± 0.514.21 ± 1.20* 6.19 ± 1.42* Hot dry: Aug-Oct 3 22.46 ± 1.33* 36.1 ± 3.42* 1.67 ± 0.4213.87 ± 0.78* ND Chilumba Gardens study site in Kafue Chinese cabbage leaves (Brassica oleracea var. chinensis: Crucifarae family) Cool dry: Apr-Jul 1 0.54 0.54 0.02 ND 12.91* Hot dry: Aug-Oct 1 ND ND ND 1.12 ND Tomato fruits (Lycopersium esculentum: Solonacae family) Cool dry: Apr-Jul 1 ND 0.68 0.04 ND 0.3 Hot dry: Aug-Oct 3 5.58 ± 4.17 ND ND 0.60 ± 0.27 ND Swiss chard leaves (Beta vulgaris subsp. Cicla: Crucifarae family) Cool dry: Apr-Jul 1 0.202 ND 0.06 ND ND Pumpkin leaves (Cucurbita moscheta/maxima: Cucurbitae family) Hot wet: Nov-Mar 3 77.56 ± 74.19* 4.07 ± 4.07* 6.38 ± 6.3151.58 ± 49.69* 12.87 ± 12.76* Cool dry: Apr-Jul 3 1.02 ± 0.54 0.34 ± 0.17 0.07 ± 0.040.69 ± 0.69 6.09 ± 3.50* Hot dry: Aug-Oct 3 3.17 ± 1.33 0.21 ± 0.21 ND 0.85 ± 0.55 ND Sweet potato leaves (Ipomoea batata: Libiatae family) Hot wet: Nov-Mar 4 2.46 ± 1.35 0.12 ± 0.12 ND 0.48 ± 0.27 ND Cool dry: Apr-Jul 4 0.89 ± 0.45 0.46 ± 0.23 0.06 ± 0.030.38 ± 0.19 3.72 ± 1.86* Copyright © 2013 SciRes. OJMetal  E. M. KAPUNGWE 86 Continued Hot dry: Aug-Oct 5 62.98 ± 61.76* 10.02 ± 10.20* 1.83 ± 1.7942.94 ± 36.90* 6.34 ± 6.22* Rape leaves (B rassica napus: Cruciferae family) Hot wet: Nov-Mar 3 1.64 ± 1.50 ND ND 0.82 ± 0.41 0.03 ± 0.02 Cool dry: Apr-Jul 4 0.71 ± 0.60 0.40 ± 0.16 0.06 ± 0.030.32 ± 0.32 1.95 ± 0.75 Sugarcane stem (Saccharum officinarum: Graminae family) Cool dry: Apr-Jul 3 3.97 ± 1.58 9.07 ± 5.68* ND ND ND Hot dry: Aug-Oct 3 12.77 ± 1.78 35. 57 ± 1.24* 1.27 ± 0.6611.43 ± 1.45* ND Heavy metal acceptable limits 20 - 50.0 0.3 - 2.0 50 1.0 2.0 ND = not detected; *Heavy metals above acceptable limits; Source of data: Field data, 2004-2006. facilitated the author to conduct research. The Chief Car- tographer Mr. J. Chilila and Assistant cartographer Ms A. Nguluwe assisted in the drawing the maps. The Techni- cians in the Department of Soil Science laboratory in the School of Agricultural Sciences at the University of Zambia assisted in the analysis of heavy metals in waste- water, soil and crops. REFERENCES [1] J. Parkinson and K. Tayler, “Decentralized Wastewater Management in Peri-Urban Areas in Low-Income Coun- tries,” Environm ent and Urbanization, Vol. 8, No. 1, 2003, pp. 75-89. [2] E. Obuobie, B. Keraita, G. Danso, P. Amoah, O. Cofie, L. Raschid-Sally and P. Drescher, “Irrigated Urban Vegeta- ble Production in Ghana: Characteristics, Benefits and Risks,” International Water Management Institute, Accra, 2006. [3] S. Buechler, W. Hertog and R. Van Veenhuizen, “Waste- water Use for Urban Agriculture,” Urban Agriculture Ma- gazine, No. 8, 2002, pp. 1-4. [4] L. Raschid-Sally and P. Jayakody, “Drivers and Charac- teristics of Wastewater Agriculture in Developing Coun- tries-Results from Global Assessment,” Water Manage- ment Institute (IWMI), Stockholm, 2008. [5] M. B. Pescod, “Wastewater Treatment and Use in Agri- culture,” FAO Irrigation and Drainage Paper 47, Rome, 1992. [6] S. Buechler, G. Devi and L. Raschid, “Livelihoods and Wastewater Irrigated Agriculture: Musi River in Hydera- bad City, Andhra Pradesh, India,” Urban Agriculture Ma- gazine, No. 8, 2002, pp. 14-17. [7] J. Kaspersma, “Electronic Conference: Agricultural Use of Untreated Urban Wastewater in Low Income Coun- tries,” Urban Agriculture Magazine, No. 8, 2002, pp. 5-6. [8] P. Dreschel, U. J. Blumanthal and B. Keraita, “Balancing Health and Livelihoods: Adjusting Wastewater Irrigation Guidelines for Resource Poor Countries,” Urban Agri- culture Magazine, No. 8, 2002, pp. 7-9. [9] M. Dubbeling, “Policy Brief: Treatment and Use of Waste- water in Urban Agriculture,” Urban Agriculture Maga- zine, No. 8, 2002, p. 41. [10] S. Guendel, “Livestock and Urban Waste in East Africa,” Urban Agriculture Magazine, No. 8, 2002, p. 42. [11] L. Chibesa, S. Mukuka, H. A. Mwankanye, J. Nsowela, L. Sakanta and D. Shebele, “Small Scale Cultivation around Kalingalinga,” In: L. Van Den Berg, Ed., In the Shadow of Lusaka: Studies in Zambian Society Number 6, Univer- sity of Zambia, Lusaka, 1982, pp. 13-21. [12] K. V. Kalumba, “Ten Case Studies of Small Scale Gar- dening in Thornpark-Villa Elizabetta Area of Lusaka,” In: L. Van Den Berg, Ed., In the Shadow of Lusaka: Studies in Zambian Society Number 6, University of Zambia, Lu- saka, 1982. [13] M. N. Saasa, “Uses of Vacant Land in Kaunda Square- Munali Area of Lusaka,” In Van Den Berg, L. Ed., In the Shadow of Lusaka: Studies in Zambian Society Number 6, University of Zambia, Lusaka, 1982. [14] L. van den Berg, Ed., In the Shadow of Lusaka: Studies in Zambian Society Number 6, University of Zambia, Lu- saka, 1982. [15] D. Jaeger and J. D. Huckabay, “The Garden City of Lu- saka: Urban Agriculture,” In G. F. Williams, Ed., Lusaka and Its Environs: A Geographical Study of a Planned Capital in Tropical Africa, Zambia Geographical Asso- ciation, Handbook Series No. 9, University of Zambia, Lusaka, 1986, pp. 266-277. [16] M. C. Mulenga, “Peri-Urban Farming: A Study of Agri- culture under Pressure of Urban Growth in Lusaka, Zam- bia,” Ph.D. Dissertation, University of London, London, 1991. [17] M. C. Mulenga and A. Dubresson, Eds., Proceeding of International Symposium on Government, Governance, Urban Territories in Southern Africa, University of Zam- bia, Lusaka, 21-22 November 2001. [18] M. C. Mulenga, “Peasant Cultivation in and around the Municipal Area of Chipata,” In M .C. Mulenga and A. Dubresson, Eds., Proceeding of International symposium on Government, Governance, Urban Territories in South- ern Africa, University of Zambia, Lusaka, 21-22 Novem- ber, 2001, pp. 81-95. [19] B. Marshall, T. Bowyer-Bower, B. H. Chishala, E. M. Kapungwe, M. Agrawal, R. Agrawal, D. Lintelo, J. Hol- den, M. Macwani, J. Volk, V. Krishnan and R. Sharma, Copyright © 2013 SciRes. OJMetal  E. M. KAPUNGWE 87 “Contaminated Irrigation Water and Food Safety for the Urban and Peri-Urban Poor: Appropriate Measures for Monitoring and Control from Field Research in India and Zambia,” Main Inception Report: Department for Interna- tional Development (DFID) Project No. R8160, Depart- ment for International Development (DFID-UK), London, 2004. [20] B. Sanyal, “Urban Agriculture: Who Cultivates and Why? A Case-Study of Lusaka, Zambia,” Food and Nutrition Bulletin, Vol. 7, No. 3, 1985, pp. 15-24. [21] C. Rakodi, “Urban Agriculture—Research Questions and Zambian Evidence,” Journal of Modern African Studies, Vol. 26, No. 3, 1988, pp. 495-515. doi:10.1017/S0022278X00011745 [22] G. Hampwaye, E. Nel and C.M. Rogerson,, “Urban agri- culture as local initiative in Lusaka, Zambia,” Environ- ment and Planning C: Government and Policy, Vol. 23, 2007, pp. 553-572. doi:10.1068/c7p [23] M. Gabi and J. S. Simwinga, “Future Development of Vacant Land in and around Lusaka,” In: L. Van Den Berg, Ed., In the Shadow of Lusaka: Studies in Zambian Society Number 6, University of Zambia, Lusaka, 1982, pp. 1-12. [24] T. Sinkala, L. Kanyomeka, S. Simukanga, M. Mwasa, O. N. Sikazwe, C. M. Nsomi, E. T. Mwase-Ngulube, M. Le- wanika, E. Kasuta, M. S. Mwala and M. M. Musonda, “Control of Aquatic Weeds in Kafue River. Phase1: En- vironmental Impact Assessment of the Kafue River Basin between Itezhi-Tezhi Dam and Kafue Gorge,” Ministry of Environment and Natural Resources, Lusaka, 1998. [25] T. Sinkala, “State of Water Quality of Kafue River 1971- 1997: Literature Review,” Environmental Council of Zam- bia, Lusaka, 1998. [26] E. M. Kapungwe, “Industrial Land Use and Heavy Metal Contaminated Wastewater Used for Irrigation in Peri- Urban Zambia,” Singapore Journal of Tropical Geogra- phy, Vol. 32, No. 1, 2011, pp. 71-84. doi:10.1111/j.1467-9493.2011.00422.x [27] A. K. Gupta and M. L. Varshney, “Practical Manual for Agricultural Chemistry,” Kalyani, New Delhi, 1989. [28] D. J. Reuter, J. B. Robinson, K. I. Peverill and G. H. Price, “Guidelines for Collecting, Handling and Analysis of Plant Materials,” In: D. J. Reuter and J. B. Robinson, Eds., Plant Analysis: An Interpretation Manual, Inkata Press, Melbourne, 1986. [29] Y. P. Kalra and D. G., Maynard, “Methods Manual for Forest Soil and Plant Analysis,” Northern Forestry Centre, Edmonton, 1991. [30] R. D. E. Bake and M. C. Amacher, “Nickel, Copper, Zinc and Cadmium,” In: A. L. Page, R. H. Miller and D. R. Reeney, Eds., Methods for Soil Analysis, American Soci- ety of Agronomy, Madison, 1982. [31] R. G. Burau, “Lead,” In: A. L. Page, R. H. Miller and D. R. Reeney, Methods for Soil Analysis, American Society of Agronomy, Madison, 1982. [32] H. M. Reisenaurer, “Chromium,” In A. L. Page, R. H. Miller and D. R. Reeney, Methods for Soil Analysis, American Society of Agronomy, Madison, 1982. [33] J. Kubota and E. E. Cary, “Cobalt, Molybdenium and Se- lenium,” In: A. L. Page, R. H. Miller and D. R. Reeney, Methods for Soil Analysis, American Society of Agron- omy, Madison, 1982. [34] E. van Ranst, M. Verloo, A. Demeyer and J. M. Pauwels, “Manual for the Soil Chemistry and Fertility Chemistry,” University of Ghent, Gent, 1999. [35] D. Ebdon, “Statistics in Geography,” Basil Blackwell, Oxford, 1985. [36] C. Bless and R. Kathuria, “Fundamentals of Social Statis- tics: An African Perspective,” Juta and Company, Cape Town, 1993. [37] R. S. Ayers and D. W. Westcot, “Water Quality for Ag- riculture,” Food and Agriculture Organisation, Rome, 1985. [38] P. Papapreponis, R. Robertson, M. Roworth, S. A. Ogston and F. L. R. William, “Levels of Inorganics and Organics in Soils: When Is High, High?” Environment and Health International, Vol. 8, No. 1, 2006, pp. 4-12. [39] Department of Environment, Food and Rural Affairs- United Kingdom, DEFRA Report Series on Soil Guide- line Values, DEFRA, London, 1989. [40] Department of Environment, Food and Rural Affairs- United Kingdom), DEFRA Report Series on Soil Guide- line Values, DEFRA, London, 2002. [41] Government of Republic of Zambia, “The Food and Drugs Act,” Laws of the Republic of Zambia, Act No 17, 1995. [42] FAO/WHO, Joint FAO/WHO Expert Committee on Food Additives (JECFA) FAO, Rome, 2002. [43] European Commission, “Commission Regulation (EC) 466/2001: Setting Maximum Levels for Certain Conta- minants in Foodstuffs,” Official Journal of the European Communities, Brussels, 2001. [44] United Kingdom Regulation, Statutory Instrument 1989 No. 1263 Sludge (Use in Agriculture) Regulation, Minis- try of Agriculture Food and Fisheries, London, 1989. [45] D. L. Lake, “Chemical Speciation of Heavy Metals in Sewage Sludge and Related Matrices,” In: J. N. Lester, Ed., Heavy Metals in Wastewater and Sludge Treatment Process, CRC Press Inc, Boca Raton, 1987. [46] Ministry of Environment (Ontario Canada), “Green Facts: Cobalt in the Environment,” 2011. http://www.archive.org/greenfactscobalt [47] M. Muchuweti,, J. W. Birkett, E. Chinyanga, R. Zvauya, M. D. Scrimshaw and J. N. Lester, “Heavy Metal Content of Vegetables Irrigated with Mixtures of Wastewater and Sewage Sludge in Zimbabwe: Implications for Human Health,” Agriculture, Ecosystems & Environment, Vol. 112, No. 1, 2006, pp. 41-48. doi:10.1016/j.agee.2005.04.028 [48] S. Simukanga, V. Shitumbanuma and T. Kalinda, “Im- pacts of Mining Effluents on the Water Quality, Sedi- ments, Soils and Crops in the Mwambashi Catchment Area of the Copperbelt of Zambia,” Ministry of Tourism, Environment and Natural Resources Pilot Environmental Fund, Lusaka, 2002. [49] S. C. Maree, “Soil,” In: F. Mendelssohn, Ed., The Geol- ogy of the Northern Rhodesian Copperbelt, MacDonald Copyright © 2013 SciRes. OJMetal  E. M. KAPUNGWE Copyright © 2013 SciRes. OJMetal 88 and Company, London, 1961. [50] V. Shitumbanuma and J. M. Tembo, “Characterization of Soils at No.1 Nkana Cobalt Plant, OBD 53 and the Mwekera Area in Kitwe, Zambia: A Report for ZCCM Investment Holding Plc,” University of Zambia, Lusaka, 2006. [51] S. Khan, Q. Cao and Y. M. Zheng, Y. Z. Huang and Y. G. Zhu, “Health Risks of Heavy Metals in Contaminated Soils and Food Crops Irrigated with Wastewater in Bei- jing, China,” Environmental Pollution, Vol. 152, No. 3, 2008, pp. 686-692. doi:10.1016/j.envpol.2007.06.056 [52] R. J. Hobbs and B. Streit, “Heavy Metal Concentrations in Plants Growing on a Copper Mine Spoil in the Grand Canyon, Arizona,” American Midland Naturalist, Vol. 115, No. 2, 1986. pp. 277-281. doi:10.2307/2425864 [53] F. Gharbi, S. Rejeb, M. H. Ghorbal and J. L. Morel, “Plant Response to Copper Toxicity as Affected by Plant Species and Soil Type,” Journal of Plant Nutrition, Vol. 28, No. 3, 2009, pp. 379-392. doi:10.1081/PLN-200049147 [54] J. I. Nirmal Kumar, H. Soni, R. N. Kumar and I. Bhatt, “Hyper Accumulation and Mobility of Heavy Metals in Vegetable Crops in India,” The Journal of Agriculture and Environment, Vol. 10. No. 29, 2009, pp. 29-38. [55] Times of Zambia, “Mufulira Water Contaminated,” Chi- shimba C., 3 January 2008. [56] Times of Zambia, “Mine Water Pollution Cases Need Decisive Measures,” Mulenga N., 11 January 2008. [57] R. J. Sharma, M. Agrawal and F. Marshall, “Heavy Metal Contamination of Soil and Vegetables in Suburban Areas of Varanasi, India,” Ecotoxicology and Envrionmental Safety, Vol. 66, No. 2, 2007, pp. 258-266. doi:10.1016/j.ecoenv.2005.11.007 [58] A. Behbahaninia and S. A. Mirbagheri, “Investigation of Heavy Metals Uptake by Vegetable Crops from Metal Contaminated Soil,” World Academy of Science, Engi- neering and Technology, Vol. 45, 2008, pp. 56-58.
|