C. V. Gonzalez et al. / Modern Chemotherapy 2 (2013) 51-56 53
2
jjj iijiigiiiii
i1, D
ˆ
SWtYYYYYdY1
jg
d,
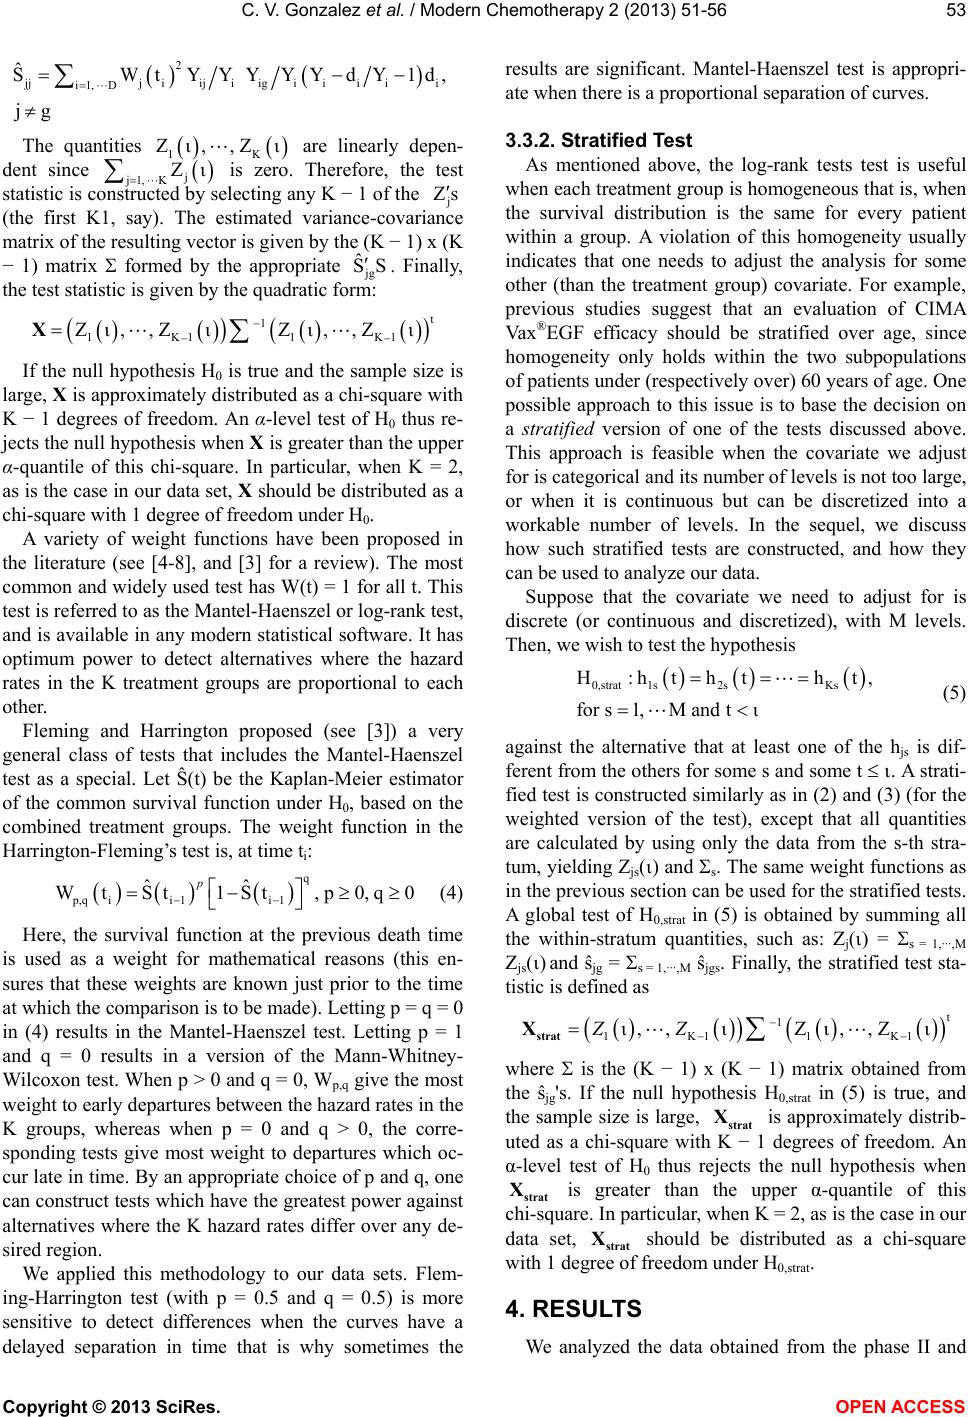
The quantities are linearly depen-
dent since j1
, K is zero. Therefore, the test
statistic is constructed by selecting any K − 1 of the j
1K
Zι,,Zι
j
Zι
Zs
(the first K1, say). The estimated variance-covariance
matrix of the resulting vector is given by the (K − 1) x (K
− 1) matrix formed by the appropriate jg . Finally,
the test statistic is given by the quadratic form:
ˆ
SS
t
1
1K1 1K1
Zι,,ZιZι,,Zι
X
If the null hypothesis H0 is true and the sample size is
large, X is approximately distributed as a chi-square with
K − 1 degrees of freedom. An α-level test of H0 thus re-
jects the null hypothesis when X is greater than the upper
α-quantile of this chi-square. In particular, when K = 2,
as is the case in our data set, X should be distributed as a
chi-square with 1 degree of freedom under H0.
A variety of weight functions have been proposed in
the literature (see [4-8], and [3] for a review). The most
common and widely used test has W(t) = 1 for all t. This
test is referred to as the Mantel-Haenszel or log-rank test,
and is available in any modern statistical software. It has
optimum power to detect alternatives where the hazard
rates in the K treatment groups are proportional to each
other.
Fleming and Harrington proposed (see [3]) a very
general class of tests that includes the Mantel-Haenszel
test as a special. Let Ŝ(t) be the Kaplan-Meier estimator
of the common survival function under H0, based on the
combined treatment groups. The weight function in the
Harrington-Fleming’s test is, at time ti:
q
p,qii 1i 1
ˆˆ
Wt St1St,p0,q0
p
(4)
Here, the survival function at the previous death time
is used as a weight for mathematical reasons (this en-
sures that these weights are known just prior to the time
at which the comparison is to be made). Letting p = q = 0
in (4) results in the Mantel-Haenszel test. Letting p = 1
and q = 0 results in a version of the Mann-Whitney-
Wilcoxon test. When p > 0 and q = 0, Wp,q give the most
weight to early departures between the hazard rates in the
K groups, whereas when p = 0 and q > 0, the corre-
sponding tests give most weight to departures which oc-
cur late in time. By an appropriate choice of p and q, one
can construct tests which have the greatest power against
alternatives where the K hazard rates differ over any de-
sired region.
We applied this methodology to our data sets. Flem-
ing-Harrington test (with p = 0.5 and q = 0.5) is more
sensitive to detect differences when the curves have a
delayed separation in time that is why sometimes the
results are significant. Mantel-Haenszel test is appropri-
ate when there is a proportional separation of curves.
3.3.2. Stratifi ed Test
As mentioned above, the log-rank tests test is useful
when each treatment group is homogeneous that is, when
the survival distribution is the same for every patient
within a group. A violation of this homogeneity usually
indicates that one needs to adjust the analysis for some
other (than the treatment group) covariate. For example,
previous studies suggest that an evaluation of CIMA
Vax®EGF efficacy should be stratified over age, since
homogeneity only holds within the two subpopulations
of patients under (respectively over) 60 years of age. One
possible approach to this issue is to base the decision on
a stratified version of one of the tests discussed above.
This approach is feasible when the covariate we adjust
for is categorical and its number of levels is not too large,
or when it is continuous but can be discretized into a
workable number of levels. In the sequel, we discuss
how such stratified tests are constructed, and how they
can be used to analyze our data.
Suppose that the covariate we need to adjust for is
discrete (or continuous and discretized), with M levels.
Then, we wish to test the hypothesis
0,strat 1s2sKs
H:htht ht,
for s1,M andtι
(5)
against the alternative that at least one of the hjs is dif-
ferent from the others for some s and some t . A strati-
fied test is constructed similarly as in (2) and (3) (for the
weighted version of the test), except that all quantities
are calculated by using only the data from the s-th stra-
tum, yielding Zjs() and s. The same weight functions as
in the previous section can be used for the stratified tests.
A global test of H0,strat in (5) is obtained by summing all
the within-stratum quantities, such as: Zj() = s = 1,···,M
Zjs() and ŝjg = s = 1,···,M ŝjgs. Finally, the stratified test sta-
tistic is defined as
t
1
1K1 1K1
ι,, ιZι,,ZιZZ
strat
X
where is the (K − 1) x (K − 1) matrix obtained from
the ŝjg's. If the null hypothesis H0,strat in (5) is true, and
the sample size is large, strat is approximately distrib-
uted as a chi-square with K − 1 degrees of freedom. An
α-level test of H0 thus rejects the null hypothesis when
strat is greater than the upper α-quantile of this
chi-square. In particular, when K = 2, as is the case in our
data set, strat should be distributed as a chi-square
with 1 degree of freedom under H0,strat.
X
X
X
4. RESULTS
We analyzed the data obtained from the phase II and
Copyright © 2013 SciRes. OPEN A CCESS