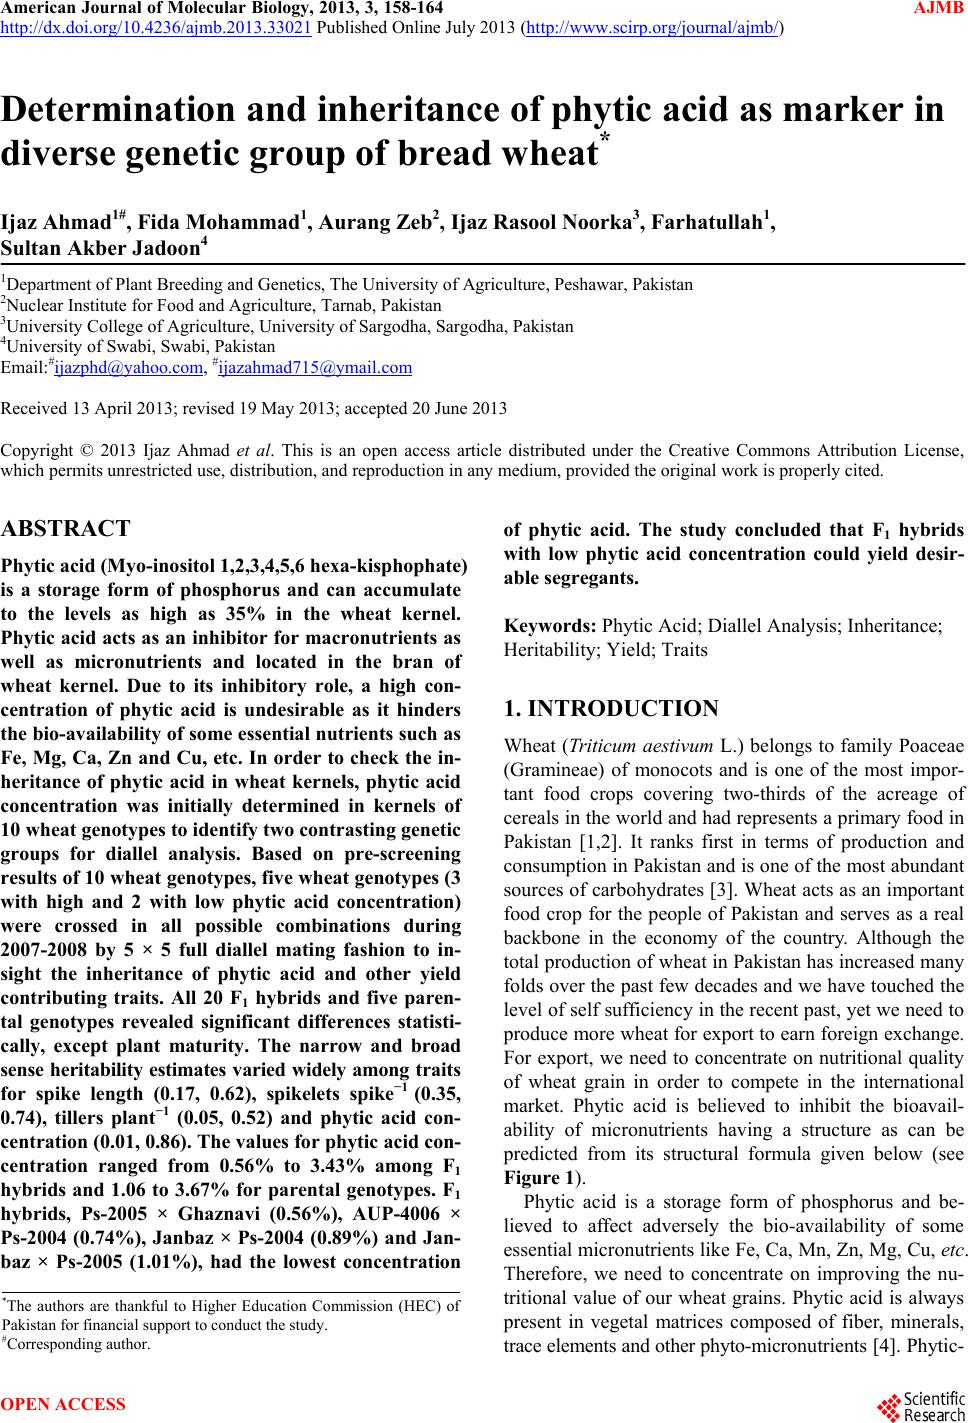
 American Journal of Molecular Biology, 2013, 3, 158-164 AJMB http://dx.doi.org/10.4236/ajmb.2013.33021 Published Online July 2013 (http://www.scirp.org/journal/ajmb/) Determination and inheritance of phytic acid as marker in diverse genetic group of bread wheat* Ijaz Ahmad1#, Fida Mohammad1, Aurang Zeb2, Ijaz Rasool Noorka3, Farhatullah1, Sultan Akber Jadoon4 1Department of Plant Breeding and Genetics, The University of Agriculture, Peshawar, Pakistan 2Nuclear Institute for Food and Agriculture, Tarnab, Pakistan 3University College of Agriculture, University of Sargodha, Sargodha, Pakistan 4University of Swabi, Swabi, Pakistan Email:#ijazphd@yahoo.com, #ijazahmad715@ymail.com Received 13 April 2013; revised 19 May 2013; accepted 20 June 2013 Copyright © 2013 Ijaz Ahmad et al. This is an open access article distributed under the Creative Commons Attribution License, which permits unrestricted use, distribution, and reproduction in any medium, provided the original work is properly cited. ABSTRACT Phytic acid (Myo-inositol 1,2,3,4,5,6 hexa-kisphophate) is a storage form of phosphorus and can accumulate to the levels as high as 35% in the wheat kernel. Phytic acid acts as an inhibitor for macronutrients as well as micronutrients and located in the bran of wheat kernel. Due to its inhibitory role, a high con- centration of phytic acid is undesirable as it hinders the bio-availability of some essential nutrients such as Fe, Mg, Ca, Zn and Cu, etc. In order to check the in- heritance of phytic acid in wheat kernels, phytic acid concentration was initially determined in kernels of 10 wheat genotypes to identify two contrasting genetic groups for diallel analysis. Based on pre-screening results of 10 wheat genotypes, five wheat genotypes (3 with high and 2 with low phytic acid concentration) were crossed in all possible combinations during 2007-2008 by 5 × 5 full diallel mating fashion to in- sight the inheritance of phytic acid and other yield contributing traits. All 20 F1 hybrids and five paren- tal genotypes revealed significant differences statisti- cally, except plant maturity. The narrow and broad sense heritability estimates varied widely among traits for spike length (0.17, 0.62), spikelets spike−1 (0.35, 0.74), tillers plant−1 (0.05, 0.52) and phytic acid con- centration (0.01, 0.86). The values for phytic acid con- centration ranged from 0.56% to 3.43% among F1 hybrids and 1.06 to 3.67% for parental genotypes. F1 hybrids, Ps-2005 × Ghaznavi (0.56%), AUP-4006 × Ps-2004 (0.74%), Janbaz × Ps-2004 (0.89%) and Jan- baz × Ps-2005 (1.01%), had the lowest concentration of phytic acid. The study concluded that F1 hybrids with low phytic acid concentration could yield desir- able segregants. Keywords: Phytic Acid; Diallel Analysis; Inheritance; Heritability; Yield; Traits 1. INTRODUCTION Wheat (Triticum aestivum L.) belongs to family Poaceae (Gramineae) of monocots and is one of the most impor- tant food crops covering two-thirds of the acreage of cereals in the world and had represents a primary food in Pakistan [1,2]. It ranks first in terms of production and consumption in Pakistan and is one of the most abundant sources of carbohydrates [3]. Wheat acts as an important food crop for the people of Pakistan and serves as a real backbone in the economy of the country. Although the total production of wheat in Pakistan has increased many folds over the past few decades and we have touched the level of self sufficiency in the recent past, yet we need to produce more wheat for export to earn foreign exchange. For export, we need to concentrate on nutritional quality of wheat grain in order to compete in the international market. Phytic acid is believed to inhibit the bioavail- ability of micronutrients having a structure as can be predicted from its structural formula given below (see Figure 1). Phytic acid is a storage form of phosphorus and be- lieved to affect adversely the bio-availability of some essential micronutrients like Fe, Ca, Mn, Zn, Mg, Cu, etc. Therefore, we need to concentrate on improving the nu- tritional value of our wheat grains. Phytic acid is always present in vegetal matrices composed of fiber, minerals, trace elements and other phyto-micronutrients [4]. Phytic- *The authors are thankful to Higher Education Commission (HEC) o Pakistan for financial support to conduct the study. #Corresponding author. OPEN ACCESS  I. Ahmad et al. / American Journal of Molecular Biology 3 (2013) 158-164 159 Figure 1. (1r,2R,3S,4s,5R, 6S)-cyclohexane-1,2,3,4,5,6- hexayl hexakis [dihydrogen (phosphate)] name (IUPAC) International Union of Pure and Applied Chemistry. acid is an anti-nutrient that hinders the bio-availability of nutrients and the lowest quantity desirable in wheat. Phytic acid contents can be decreased by fortification which changes oxidation state of Fe [5]. Phytic acid concentration is negatively correlated with Ca, Mg, Zn, Mn and Fe concentrations [6]. Phytic acid is the main source of phosphorus in cereal grains and in bakery pro- ducts [7]. Phosphorus mainly stores in the form of phytic acid in seed and has a profound effect on the seed used as a food commodity. Phytic acid is a potent inhibitor of mineral and trace element absorption occurs in all cereal grains and legume seeds. Reducing phytic acid content by soaking and germination was studied in a wide range of grains and seeds. Germination increased phytase ac- tivity 3 to 5-fold in some cereal grains and legume seeds, while the influence on phytic acid content was insignifi- cant in most materials tested. Highly apparent phytase activity was found in untreated whole grain rye, wheat, triticale, buckwheat, and barley [8]. Identification of wheat with relatively low phytic acid would be a step towards development of wheat cultivars with low phytic acid. Keeping in view the importance of phytic acid as a potent inhibitor for the bioavailability of micronutrients viz. Fe, Ca, Mn, Zn, Mg, Cu, etc., a study was conducted. This study was initiated by crossing two contrasting groups of wheat genotypes (2 with low and 3 with high phytic acid concentrations), selected on the basis of 10 wheat genotypes preliminary screening for phytic acid concentration in bread wheat. Therefore, it is the need of hour to ensure the nutritional quality of bread wheat [9]. Five wheat genotypes were crossed in 5 × 5 full diallel with the objective of developing low phytic acid segre- gants of wheat, decreasing the inhibitory effect of phytic acid and enhancing the bioavailability of micronutrients and macronutrients to humans. The specific objectives of the present project were to determine the phytic acid pro- file and other agronomic traits of different bread wheat genotypes and to estimate of their heritability. 2. MATERIALS AND METHODS The experiment was conducted in the department of plant breeding and genetics, The University of Agricul- ture Peshawar, Khyber Pakhtunkhwa Pakistan during the year 2007-09. Ten wheat genotypes, Uqab, Tatara, AUP- 5006, Ghaznavi, Saleem-2000, Pirsabak-2004, Fakhre Sarhad, Pirsabak-2005, Janbaz and AUP-4006 were scre- ened for phytic acid concentration in 2007 at the Nuclear Institute for Food and Agriculture (NIFA) Peshawar ac- cording to [10]. Based on the results of preliminary study of ten bread wheat genotypes, two contrasting groups (one group with high phytic acid genotypes i.e. Pirsa- bak-2005 (2.89%), Janbaz (3.67%) and AUP-4006 (2.83%) and the other group with low phytic acid genotypes i.e. Pirsabak-2004 (1.77%) and Ghaznavi (1.06%) were iden- tified. These five genotypes were crossed in all possible combinations in 2007 using 5 × 5 full diallel mating de- sign. Fifteen spikes of each genotype was manually emas- culated and bagged in order to prevent contamination by foreign pollens. After two days, emasculated female spikes were pollinated by applying fresh pollen from the desirable male spike. By this method 20 F1 hybrids (both direct and reciprocal) were made to get enough seed for further planting experiment in 2008-2009. All F1 hybrids along with parental genotypes were planted with a dis- tance of plant to plant and row to row 25 cm investigate phytic acid and other agronomic traits. The experiment was laid down in randomized complete block design with three replicates. Each replication was assigned with 20 F1s and 5 parental genotypes. Each entry consisted of one row with a row length of 3.75 m. Plant to plant and row to space of 25 cm was maintained. Urea and DAP fertilizers were applied at 120 and 60 kg ha−1, respec- tively, to crop for maintaining normal nutrients status of the soil. Half dose of urea and full dose of DAP were applied at the time of seed bed preparation while re- maining half dose of urea was applied at the time of first irrigation. Standard practices including hoeing, weeding, irrigation etc were carried out for the experiment to re- duce experimental error. Data were recorded on five randomly selected plants from each population for spike length, total tillers plant−1, days to maturity, spikelets spike−1, and phytic acid. The grain samples were prop- erly threshed and drawn from each entry of the study of phytic acid determination at Nuclear Institute of Food and Agriculture (NIFA) Peshawar, human nutrition lab. The sensitive method of [10] was adopted for the deter- mination of phytic acid in the whole wheat flour samples. 2.1. Determination of Phytic Acid The sample was extracted with 0.2 N HCl and heated with an acidic iron-III solution of known iron content. The decrease in the iron content was the measure of free Copyright © 2013 SciRes. OPEN ACCESS  I. Ahmad et al. / American Journal of Molecular Biology 3 (2013) 158-164 160 phytic acid in supernatant [10]. The reagents are as follows. 2.1.1. Phytic Acid Reference Solution Sodium salt of phytic acid (C6H6O24P6Na12) was used for reference. Stock solution was prepared by dissolving 0.15 g sodium phytate in 100 ml distilled water. The ref- erence solution was prepared by diluting the stock solu- tion with HCl in a range from 3 to 30 micro-grams (ug ml−1) phytic acid phosphorus. 2.1.2. Ferric Solution Ammonium Iron-III Sulphate. 12H2O. Ferric solution was prepared by dissolving 0.2 g of Ammonium Iron-III sulphate. 12H2O in 100 ml of 2 N HCl and the volume was made up to 1000 ml with distilled water. 2.1.3. 2,2-Bipyridine Solution Ten grams of 2,2-bipyridine and 10 ml of Thioglycolic acid was dissolved in distilled water and the volume was made upto 1000 ml. 2.1.4. Protocol Grain sample (10 g) of each genotype was finely grinded by grinder and a fine grade of dried flour was obtained. The defatted and finely ground wheat flour sample (0.06 g) was weighed and added in dry and clean screw cap test tube (15 ml). Sample was extracted with 10 ml of 0.1 N HCl for 1 hour shaking in shaker. From this extract 0.5 ml in duplicate was taken into dry and clean screw cap test tubes. A quantity of 1 ml Ferric solution (concentra- tion = 23 μg ml−1 or 23 ppm solution) was added to these test tubes and closed by screw caps. These tubes were heated (105˚C) in boiling water bath for 30 minutes and were allowed to cool at room temperature. Reaction mixture was provided by 2 ml of 2,2-biphyridine solution (concentration = 1% 2,2 bipyridine solution) and mixed thoroughly by shaking. Reaction mixture was transferred to cuvet of spectrophotometer (UV-1800, Made in Japan) and optical density (OD 510 nm) was recorded. The ab- sorbance was measured within 4 minutes according to the method delineated by [10]. 2.2. Statistical Analysis 2.2.1. Analysis of Variance For analysis of variance data were subjected to Stateview software version 5, developed by SAS Institute Inc. USA which is based on the statistical model of [11]. 2.2.2. Diallel Analysis Diallel analysis for 5 × 5 diallel cross was conducted by using Diallel-98 soft ware developed by Tokyo Univer- sity of Japan. Soft ware yielded Griffing, s Anova, Esti- mates of genetic parameters. 3. RESULTS AND DISCUSSION Data of phytic acid and important yield traits for five parental genotypes and all possible crosses (20 F1) were subjected to biometrical analysis for getting genetic in- formation about various aspects. The null hypothesis for equality of means was tested through F-distribution of [11] in analysis of variance. In case of rejection of null hypothesis further evaluation of means and diallel analy- sis [12] was studied. The results of analysis of variance and diallel analysis are presented and discussed. 3.1. Mean Performance of F1 and Parental Genotypes Analysis of variance revealed that genotypes had sig- nificant differences for all traits (Table 1). Means of the genotypes (parents + crosses) for the traits studied are presented (Table 2). Data regarding spike length re- vealed that parental genotype Janbaz appeared with long spike followed by Ghaznavi while Ps-2005 and Ps-2004 yielded short spikes. Long spikes were produced by cross Ghaznavi × Janbaz while short spikes by Ps-2005 × AUP-4006 among the F1 hybrids. Some F1 crosses like AUP-4006 × Ps-2004, Ps-2004 × Ps-2005, AUP-4006 × Janbaz and Janbaz × Ps-2004 were at par for the said trait. Data concerning total tillers plant−1 showed that among parental genotypes Ps-2004 produced more total tillers plant−1 while less total tillers plant−1 was recorded for parental genotype AUP-4006. Ghaznavi × Janbaz ap- peared with maximum total tillers plant μ1 while cross Ps-2005 × Janbaz with minimum total tillers plant−1 among the F1 crosses. Among F1 crosses Ps-2004 × Ghaznavi, AUP-4006 × Ps-2005, Janbaz × Ps-2004, Ghaznavi × Ps-2005 and Ghaznavi × Ps-2004 were at par for total tillers plant−1. Data regarding plant maturity is presented in Table 2: which indicated that among the parental genotype, AUP-4006 took maximum number of days for maturity while Ps-2005 minimum number of days for the said trait. Among the F1 hybrids, AUP-4006 × Ps-2004 and Ps-2005 × Janbaz showed late maturity by taking more number of days for maturity whereas Ps-2004 × Ghaznavi showed early maturity by taking less number Table 1. Mean squares for phytic acid and other agronomic traits in bread wheat. Genotypes Replications Traits df MS Rep df MS Total tillers plant−124 7.43** 2 0.36 NS Spike length 24 3.72** 2 15.34 NS Days to maturity24 10.99** 2 3.41 NS Spikelets spike−1 24 6.41** 2 2.09* Phytic acid 24 1.651** 2 0.32NS *,**Indicates significance at 0.05 and 0.01, respectively; NS shows non- significant. Copyright © 2013 SciRes. OPEN ACCESS  I. Ahmad et al. / American Journal of Molecular Biology 3 (2013) 158-164 161 Table 2. Means of Parents and F1s for spike length, (SL), total tillers plant−1 (TTP-1) days to maturity (DM), spikelets spike−1 (SSP-1) and phytic acid in 5 × 5 diallel cross of bread wheat. S.No Genotypes DMTTP−1 SL (cm) SSP−1PA% 1 AUP-4006 170.677.87 9.00 23.673.42 2 Janbaz 170.6611.57 11.67 24.671.61 3 Ghaznavi 169.6610.06 11.13 24.671.25 4 Ps-2004 169.0011.92 9.00 24.001.66 5 Ps-2005 167.3310.80 9.00 23.002.48 6 AUP-4006 × Ps-2004 170.338.33 12.40 22.330.74 7 Ps-2004 × AUP-4006 167.009.00 11.30 22.002.60 8 Ps-2004 × Ghaznavi 164.0011.73 11.13 23.332.48 9 Ps-2004 × Ps-2005 167.009.67 12.60 22.001.46 10 AUP-4006 × Janbaz 165.009.13 12.20 26.332.83 11 AUP-4006 × Ghaznavi 167.007.93 11.80 25.002.81 12 AUP-4006 × Ps-2005 170.0011.67 11.73 26.002.55 13 Janbaz × AUP-4006 170.0010.57 11.00 23.002.65 14 Janbaz × Ghaznavi 164.6610.40 11.33 26.001.63 15 Janbaz × Ps-2004 165.6611.67 12.60 25.330.89 16 Janbaz × Ps-2005 170.668.20 11.60 26.331.01 17 Ghaznavi × AUP-4006 170.339.06 11.00 25.003.43 18 Ghaznavi × Janbaz 165.6613.60 13.40 25.001.52 19 Ghaznavi × Ps-2005 166.3311.13 11.93 24.002.81 20 Ghaznavi × Ps-2004 166.0011.93 10.73 25.002.32 21 Ps-2004 × Janbaz 167.668.77 12.27 23.002.53 22 Ps-2005 × AUP-4006 167.3310.76 10.53 24.002.83 23 Ps-2005 × Janbaz 171.007.66 11.56 23.662.77 24 Ps-2005 × Ghaznavi 170.0010.60 11.80 23.330.56 25 Ps-2005 × Ps-2004 168.0011.37 10.47 21.661.58 of days for completing life span. Main purpose in many plant breeding programs is to develop wheat cultivars with optimum days to maturity which can reduce fertil- izer and irrigation application cost [13]. Data pertaining to spikelets spike−1 showed highly significant differences. Maximum spikelets sipke−1 was observed for parental genotypes (Table 2), Janbaz and Ghaznavi whereas less spikelets spike−1 was recorded for parental genotype Ps-2005. Among the F1 progenies two crosses i.e. AUP- 4006 × Janbaz and Janbaz × Ps-2005 yielded maximum spikelets spike−1 whereas minimum spikelets spike−1 was shown by cross Ps-2005 × Ps-2004. Some F1 crosses like AUP-4006 × Ghaznavi, Janbaz × Ps-2004, Ghaznavi × AUP-4006, Ghaznavi × Janbaz and Ghaznavi × Ps-2004 were at par for spikelets spike−1. Phytic acid concentra- tion was determined by the sensitive method of [10]. Analysis of variance showed highly significant differ- ences (Table 1). Maximum phytic acid concentration was found in AUP-4006 while minimum in Ghaznavi among the parental genotype (Table 2). F1 hybrids showed a wider range for phytic acid. Highest phytic acid con- centration was observed in cross combination Ghaznavi × AUP-4006, followed by AUP-4006 × Janbaz whereas lower concentration was recorded for Ps-2005 × Ghaz- navi and AUP-4006 × Ps-2004 among the F1 hybrids. Many genotypes among the F1 hybrids were at par for phytic acid concentration. 3.2. Diallel Analysis Data collected for phytic acid and all agronomic traits were subjected to analysis of variance following [11], before conducting diallel analysis by using State view software version 5, developed by SAS Institute Inc. USA. Significant genotypic differences were found for all the traits except plant maturity which provided justification for diallel analysis. Diallel analysis (5 × 5 diallel analysis) was carried using a software Dial-98. Genetic parameters were also calculated by the same software. 3.2.1. Spike Length Complete analysis of variance for 5 × 5 diallel cross was carried out for spike length which indicated (Table 3) that item a, which was the measure of additive gene ef- fect appeared with significant differences and thus con- sidered as a major contributing factor towards the total variation due to additive gene effect. Genetic component b which was used for the measurement of overall domi- nance also yielded significant variation, showed the im- portant role of dominance. Highly significant differences in the value of b1 indicated the presence of directional genes for spike length. Asymmetrical genes distribution among the parents was supported by the non-significant value of b 2. Specific gene effect was lacking due to non-significant value of b3. The values of c (maternal effect) and reciprocal effect (d) were non-significant. Regression analysis and t2 tests of adequacy showed that the data was adequate for diallel analysis for the trait of spike length (Table 4). For spike length, genetic component, H2, F, h2 and E revealed significant differ- Table 3. Mean squares and degree of freedom for the analysis of variance of 5 × 5 diallel for spike length, tillers plant−1, spikelets spike−1 and phytic acid. Spike lengthTotal tillers palnt−1 Spikelets spike−1 Phytic acid SOV dfMs dfMs df Ms df Ms a4 5.33*44.88 NS 4 11.21** 4 0.39NS b105.05 ** 10 8.30** 10 5.68** 10 2.92** b11 34.54** 15.94 NS 1 1.47NS 1 3.85** b241.60 NS 49.01 * 4 6.25** 4 3.39** b3 51.92 NS 58.20 * 5 6.06** 5 2.36** c4 2.68NS 48.61 * 4 6.38** 4 4.29** d61.12NS 63.87 NS 6 4.44** 6 1.65** *P: 0.05; **P: 0.01; a = additive gene effect, b = dominance gene effect, b1 = directional dominance deviation, b2 = genes distribution among parents, b3 = effect of specific gene, c = maternal effect, d = reciprocal effect. Copyright © 2013 SciRes. OPEN ACCESS 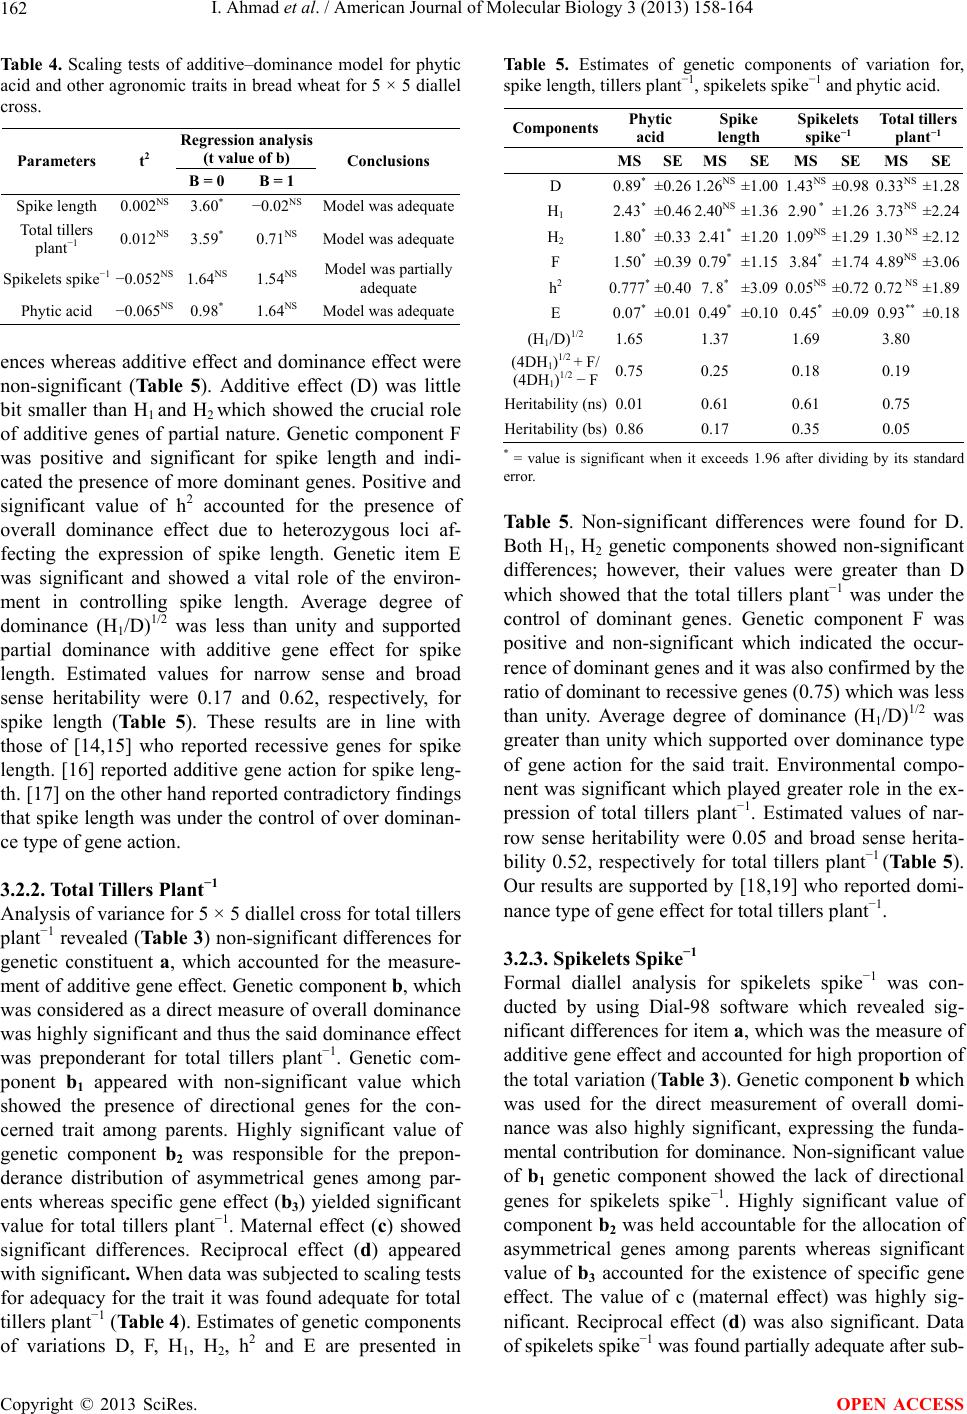 I. Ahmad et al. / American Journal of Molecular Biology 3 (2013) 158-164 162 Table 4. Scaling tests of additive–dominance model for phytic acid and other agronomic traits in bread wheat for 5 × 5 diallel cross. Regression analysis (t value of b) Parameters t2 B = 0 B = 1 Conclusions Spike length 0.002NS 3.60* −0.02NS Model was adequate Total tillers plant−1 0.012NS 3.59* 0.71NS Model was adequate Spikelets spike−1 −0.052NS 1.64NS 1.54NS Model was partially adequate Phytic acid −0.065NS 0.98* 1.64NS Model was adequate ences whereas additive effect and dominance effect were non-significant (Table 5). Additive effect (D) was little bit smaller than H1 and H2 which showed the crucial role of additive genes of partial nature. Genetic component F was positive and significant for spike length and indi- cated the presence of more dominant genes. Positive and significant value of h2 accounted for the presence of overall dominance effect due to heterozygous loci af- fecting the expression of spike length. Genetic item E was significant and showed a vital role of the environ- ment in controlling spike length. Average degree of dominance (H1/D)1/2 was less than unity and supported partial dominance with additive gene effect for spike length. Estimated values for narrow sense and broad sense heritability were 0.17 and 0.62, respectively, for spike length (Table 5). These results are in line with those of [14,15] who reported recessive genes for spike length. [16] reported additive gene action for spike leng- th. [17] on the other hand reported contradictory findings that spike length was under the control of over dominan- ce type of gene action. 3.2.2. Total Tillers Plant−1 Analysis of variance for 5 × 5 diallel cross for total tillers plant−1 revealed (Table 3) non-significant differences for genetic constituent a, which accounted for the measure- ment of additive gene effect. Genetic component b, which was considered as a direct measure of overall dominance was highly significant and thus the said dominance effect was preponderant for total tillers plant−1. Genetic com- ponent b1 appeared with non-significant value which showed the presence of directional genes for the con- cerned trait among parents. Highly significant value of genetic component b2 was responsible for the prepon- derance distribution of asymmetrical genes among par- ents whereas specific gene effect (b3) yielded significant value for total tillers plant−1. Maternal effect (c) showed significant differences. Reciprocal effect (d) appeared with significant. When data was subjected to scaling tests for adequacy for the trait it was found adequate for total tillers plant−1 (Table 4). Estimates of genetic components of variations D, F, H1, H2, h2 and E are presented in Table 5. Estimates of genetic components of variation for, spike length, tillers plant−1, spikelets spike−1 and phytic acid. Components Phytic acid Spike length Spikelets spike−1 Total tillers plant−1 MSSEMSSE MS SE MSSE D 0.89*±0.26 1.26NS ±1.00 1.43NS ±0.98 0.33NS ±1.28 H1 2.43*±0.46 2.40NS ±1.36 2.90 * ±1.26 3.73NS ±2.24 H2 1.80*±0.332.41* ±1.20 1.09NS ±1.29 1.30 NS±2.12 F 1.50*±0.39 0.79* ±1.15 3.84* ±1.74 4.89NS ±3.06 h2 0.777*±0.40 7. 8* ±3.09 0.05NS ±0.72 0.72 NS±1.89 E 0.07*±0.01 0.49* ±0.10 0.45* ±0.09 0.93** ±0.18 (H1/D)1/2 1.65 1.37 1.69 3.80 (4DH1)1/2 + F/ (4DH1)1/2 − F0.75 0.25 0.18 0.19 Heritability (ns)0.01 0.61 0.61 0.75 Heritability (bs)0.86 0.17 0.35 0.05 * = value is significant when it exceeds 1.96 after dividing by its standard error. Table 5. Non-significant differences were found for D. Both H1, H2 genetic components showed non-significant differences; however, their values were greater than D which showed that the total tillers plant−1 was under the control of dominant genes. Genetic component F was positive and non-significant which indicated the occur- rence of dominant genes and it was also confirmed by the ratio of dominant to recessive genes (0.75) which was less than unity. Average degree of dominance (H1/D)1/2 was greater than unity which supported over dominance type of gene action for the said trait. Environmental compo- nent was significant which played greater role in the ex- pression of total tillers plant−1. Estimated values of nar- row sense heritability were 0.05 and broad sense herita- bility 0.52, respectively for total tillers plant−1 (Table 5). Our results are supported by [18,19] who reported domi- nance type of gene effect for total tillers plant−1. 3.2.3. Spikelets Spike−1 Formal diallel analysis for spikelets spike−1 was con- ducted by using Dial-98 software which revealed sig- nificant differences for item a, which was the measure of additive gene effect and accounted for high proportion of the total variation (Table 3). Genetic component b which was used for the direct measurement of overall domi- nance was also highly significant, expressing the funda- mental contribution for dominance. Non-significant value of b1 genetic component showed the lack of directional genes for spikelets spike−1. Highly significant value of component b2 was held accountable for the allocation of asymmetrical genes among parents whereas significant value of b3 accounted for the existence of specific gene effect. The value of c (maternal effect) was highly sig- nificant. Reciprocal effect (d) was also significant. Data of spikelets spike−1 was found partially adequate after sub- Copyright © 2013 SciRes. OPEN ACCESS 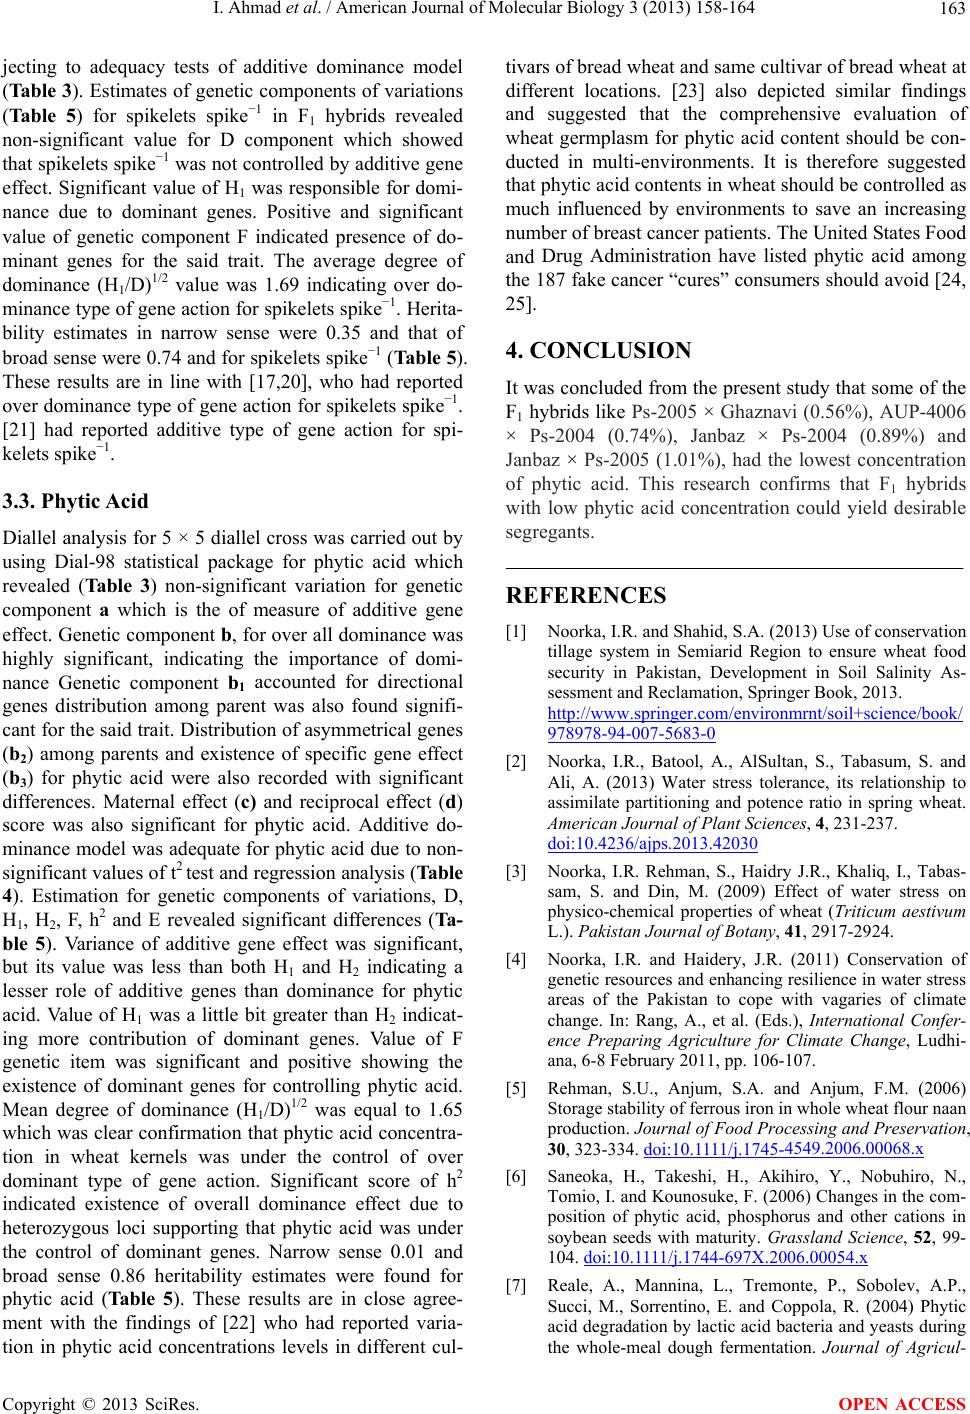 I. Ahmad et al. / American Journal of Molecular Biology 3 (2013) 158-164 163 jecting to adequacy tests of additive dominance model (Table 3). Estimates of genetic components of variations (Table 5) for spikelets spike−1 in F1 hybrids revealed non-significant value for D component which showed that spikelets spike−1 was not controlled by additive gene effect. Significant value of H1 was responsible for domi- nance due to dominant genes. Positive and significant value of genetic component F indicated presence of do- minant genes for the said trait. The average degree of dominance (H1/D)1/2 value was 1.69 indicating over do- minance type of gene action for spikelets spike−1. Herita- bility estimates in narrow sense were 0.35 and that of broad sense were 0.74 and for spikelets spike−1 (Table 5). These results are in line with [17,20], who had reported over dominance type of gene action for spikelets spike−1. [21] had reported additive type of gene action for spi- kelets spike−1. 3.3. Phytic Acid Diallel analysis for 5 × 5 diallel cross was carried out by using Dial-98 statistical package for phytic acid which revealed (Table 3) non-significant variation for genetic component a which is the of measure of additive gene effect. Genetic component b, for over all dominance was highly significant, indicating the importance of domi- nance Genetic component b1 accounted for directional genes distribution among parent was also found signifi- cant for the said trait. Distribution of asymmetrical genes (b2) among parents and existence of specific gene effect (b3) for phytic acid were also recorded with significant differences. Maternal effect (c) and reciprocal effect (d) score was also significant for phytic acid. Additive do- minance model was adequate for phytic acid due to non- significant values of t2 test and regression analysis (Table 4). Estimation for genetic components of variations, D, H1, H2, F, h2 and E revealed significant differences (Ta- ble 5). Variance of additive gene effect was significant, but its value was less than both H1 and H2 indicating a lesser role of additive genes than dominance for phytic acid. Value of H1 was a little bit greater than H2 indicat- ing more contribution of dominant genes. Value of F genetic item was significant and positive showing the existence of dominant genes for controlling phytic acid. Mean degree of dominance (H1/D)1/2 was equal to 1.65 which was clear confirmation that phytic acid concentra- tion in wheat kernels was under the control of over dominant type of gene action. Significant score of h2 indicated existence of overall dominance effect due to heterozygous loci supporting that phytic acid was under the control of dominant genes. Narrow sense 0.01 and broad sense 0.86 heritability estimates were found for phytic acid (Table 5). These results are in close agree- ment with the findings of [22] who had reported varia- tion in phytic acid concentrations levels in different cul- tivars of bread wheat and same cultivar of bread wheat at different locations. [23] also depicted similar findings and suggested that the comprehensive evaluation of wheat germplasm for phytic acid content should be con- ducted in multi-environments. It is therefore suggested that phytic acid contents in wheat should be controlled as much influenced by environments to save an increasing number of breast cancer patients. The United States Food and Drug Administration have listed phytic acid among the 187 fake cancer “cures” consumers should avoid [24, 25]. 4. CONCLUSION It was concluded from the present study that some of the F1 hybrids like Ps-2005 × Ghaznavi (0.56%), AUP-4006 × Ps-2004 (0.74%), Janbaz × Ps-2004 (0.89%) and Janbaz × Ps-2005 (1.01%), had the lowest concentration of phytic acid. This research confirms that F1 hybrids with low phytic acid concentration could yield desirable segr egants. REFERENCES [1] Noorka, I.R. and Shahid, S.A. (2013) Use of conservation tillage system in Semiarid Region to ensure wheat food security in Pakistan, Development in Soil Salinity As- sessment and Reclamation, Springer Book, 2013. http://www.springer.com/environmrnt/soil+science/book/ 978978-94-007-5683-0 [2] Noorka, I.R., Batool, A., AlSultan, S., Tabasum, S. and Ali, A. (2013) Water stress tolerance, its relationship to assimilate partitioning and potence ratio in spring wheat. American Journal of Plant Sciences, 4, 231-237. doi:10.4236/ajps.2013.42030 [3] Noorka, I.R. Rehman, S., Haidry J.R., Khaliq, I., Tabas- sam, S. and Din, M. (2009) Effect of water stress on physico-chemical properties of wheat (Triticum aestivum L.). Pakistan Journal of Botany, 41, 2917-2924. [4] Noorka, I.R. and Haidery, J.R. (2011) Conservation of genetic resources and enhancing resilience in water stress areas of the Pakistan to cope with vagaries of climate change. In: Rang, A., et al. (Eds.), International Confer- ence Preparing Agriculture for Climate Change, Ludhi- ana, 6-8 February 2011, pp. 106-107. [5] Rehman, S.U., Anjum, S.A. and Anjum, F.M. (2006) Storage stability of ferrous iron in whole wheat flour naan production. Journal of Food Processing and Preservation, 30, 323-334. doi:10.1111/j.1745-4549.2006.00068.x [6] Saneoka, H., Takeshi, H., Akihiro, Y., Nobuhiro, N., Tomio, I. and Kounosuke, F. (2006) Changes in the com- position of phytic acid, phosphorus and other cations in soybean seeds with maturity. Grassland Science, 52, 99- 104. doi:10.1111/j.1744-697X.2006.00054.x [7] Reale, A., Mannina, L., Tremonte, P., Sobolev, A.P., Succi, M., Sorrentino, E. and Coppola, R. (2004) Phytic acid degradation by lactic acid bacteria and yeasts during the whole-meal dough fermentation. Journal of Agricul- Copyright © 2013 SciRes. OPEN ACCESS  I. Ahmad et al. / American Journal of Molecular Biology 3 (2013) 158-164 Copyright © 2013 SciRes. 164 OPEN ACCESS tural and Food Chemistry, 52, 6300-6305. doi:10.1021/jf049551p [8] Szkudelski, T. (2005) Phytic acid induced metabolic changes in the rat. Journal of Animal Physiology and Animal Nutrition, 89, 397-402. doi:10.1111/j.1439-0396.2005.00532.x [9] Noorka, I.R. and Teixeira da Silva, J.A. (2012) Mecha- nistic insight of water stress induced aggregation in wheat (Triticum aestivum L.) quality: The protein paradigm shift. Notulae Scientia Biologicae, 4, 32-38. [10] Haug, W. and Lantzsch, H.J. (1983) Sensitive method for the rapid determination of phytic acid in cereals and cere- als products. Journal of the Science of Food and Agricul- ture, 34, 1423-1426. doi:10.1002/jsfa.2740341217 [11] Steel, R.G.D., Torrie, J.H. and Dicky, D.A. (1997) Prin- ciples and procedures of statistics. A biological approach. McGraw Hill Brook Co., New York, 336-354. [12] Hayman, B.I. (1954) The theory and analysis of diallel crosses. Genetics, 39, 789-809. [13] Khan, I. and Khalil, I.H. (2006) Selection response for yield and yield related traits in bread wheat. M.Sc. Thesis, University of Agriculture, Faisalabad. [14] Lonc, W. (1989) Types of gene effects governing quan- tattive characters in winter wheat. Hodawla Roslin, Akii- matyazacja I Nasiennictwo, Poland, 29, 1-11. [15] Noorka, I.R., Batool, A., Rauf, S., Teixeira da Silva, J.A. and Ashraf, E. (2013) Estimation of heterosis in wheat (Triticum aestivum L.) under contrasting water regimes. International Journal of Plant Breeding, 7, 55-60. [16] Li, L.Z., Lu, D.B. and Cui, D.Q. (1991) Study on the combining ability for yield and quality characters in win- ter wheat. Acta Agriculture. Universitatis Henaanesis, 25. 372-378. [17] Iqbal, M., Alam, K. and Chowdhry, M.A. (1991) Genetic analysis of plant height and the trait above the flag area node in bread wheat. Sarhad Journal of Agriculture, 7, 131-134. [18] Bebyakin, V.M. and Tsitologlya, N.I. and Korobova, I.G. (1989) Gene interaction and combining ability effects of winter wheat varieties for yield components. Tsitologlya i Genetica, 23, 23-26. [19] Prodanovic, S. (1993) Genetic values of F1 wheat hybrids obtained in diallel crosses. Review of Research Work at the Faculty of Agricult u re, Belgrade, 38, 25-37. [20] Haug, W. and Lantzsch, H. (2006) Sensitive method for the rapid determination of phytate in cereals and cereal products. The Journal of the Science of Food and Agri- culture, 34, 1423-1426. doi:10.1002/jsfa.2740341217 [21] Rasal, P.N., Patil, H.S., Chavan, V.W. and Manake, B.S. (1991) Combining ability studies for certain quantitative traits in wheat. Journal of Maharashtra Agricultural Uni- versities, 16, 206-208. [22] Masud, T., Mahmood, T., Latif, A., Sammi, S. and Ha- meed, T. (2007) Influence of processing and cooking me- thodologies for reduction of phytic acid content in wheat (Triticum aestivum) varieties. Journal of Food Processing and Preservation, 31, 583-594. doi:10.1111/j.1745-4549.2007.00147.x [23] Khan, A.J., Ali, A., Farooq-i-Azam and Aurang Zeb (2007) Identification and isolation of low phytic acid wheat (Triticum aestivum L.) inbred lines/mutants. Paki- stan Journal of Botany, 39, 2051-2058. [24] Dendougui, F. and Schwedt, G. (2004) In vitro analysis of binding capacities of calcium to phytic acid in different food samples. European Food Research and Technology, 219, 409-415. doi:10.1007/s00217-004-0912-7 [25] Bacić, I., Druzijanić, N., Karlo, R., Skifić, I., & Jagić, S. (2010) Efficacy of IP6 + inositol in the treatment of breast cancer patients receiving chemotherapy: Prospec- tive, randomized, pilot clinical study. Journal of Experi- mental & Clinical Cancer Research, 29, 12. doi:10.1186/1756-9966-29-12
|