International Journal of Geosciences, 2013, 4, 904-918
http://dx.doi.org/10.4236/ijg.2013.45085 Published Online July 2013 (http://www.scirp.org/journal/ijg)
Landslide Characterization Using Satellite Interferometry
(PSI), Geotechnical Investigations and Numerical
Modelling: The Case Study of Ricasoli Village (Italy)
Ascanio Rosi, Pietro Vannocci, Veronica Tofani, Giovanni Gigli, Nicola Casagli
Department of Earth Sciences, University of Florence, Florence, Italy
Email: ascanio.rosi@unifi.it
Received April 19, 2013; revised May 22, 2013; accepted June 20, 2013
Copyright © 2013 Ascanio Rosi et al. This is an open access article distributed under the Creative Commons Attribution License,
which permits unrestricted use, distribution, and reproduction in any medium, provided the original work is properly cited.
ABSTRACT
Ricasoli is a village located in a morphological high in the Upper Arno river Valley (Tuscany), an area historically sub -
ject to widespread slope instability phenomena. This morphological high and the surrounding slopes result to be af-
fected by numerous land slides, which cau se the retreat of the escarpments surrounding th e village, involving infrastruc-
tures and buildings. To better understand the behaviour of these phenomena a complete characterization, in terms of
kinematics, mechanical properties and triggering conditions, of the landslides has been carried out. With this aim sev-
eral boreholes, equipp ed both with inclinometer and p iezometers, have been drilled and a number of samples hav e been
collected and analysed . In addition to the trad ition al an alysis, the rad ar satellite interferometry h as b een us ed to ev aluate
the evolution of the land slides and its co rrelation with rainfalls; furthermore a finite difference numerical modelling has
been carried out to investigate the kin e matics of the landslides and the deformation pattern.
Keywords: Landslide; Geotechnical Characterization; Interferometry; PSInSAR
1. Introduction
Landslide occurrence can vary depending on different
causes such as geology, topography, tectonic history, wea-
thering and land use [1]. Moreover the triggering of
landslides can be due to a variety of factors both natural
such as rainfall, earthquakes, water level changes or an-
thropogenic (deforestation, excavation of slope).
During the time, urbanization has developed in land-
slide-prone areas and numerous villages and buildings
have been built either near or on large landslides, there-
fore landslides result to be one of the main causes of
casualties and economic losses.
In such areas, solutions usually are focused on slopes
stabilization or on the development of early warning sys-
tems, when costs of the stabilization works are unafford-
able, since moving the entire population in more stable
areas can lead to several social and economic problems
[2,3] Thus a good knowledge of landslides behaviour is
required to reduce the risk posed by such phenomena.
In order to increase this knowledge, a complete analy-
sis of geological setting, geotechnical properties and trig-
gering factors of landslides are necessary.
The aim of this work is to characterize, in terms of
kinematics, mechanical properties and triggering condi-
tions, the landslide phenomena affecting the area of Ri-
casoli village, that is located in a morphological high in
the Upper Arno river Valley (Tuscany), an area histori-
cally subject to widespread slope instability phenomena
[4], due to its geological and geomorphological setting.
First reports of landslides involving this town date back
to the eighteenth century, when the local church was de-
stroyed.
In the year 2001 a 15-meter-wide landslide involved
the northern side of the village and a part of a street col-
lapsed; after this event several studies have been accom-
plished, to define the nature and the extent of the acting
phenomena.
To perform the characterization of the landslide phe-
nomena several boreholes, equipped both with incli-
nometer and piezometers, have been drilled and a num-
ber of samples have been collected and analysed.
In this work, in addition to the traditional analysis, ra-
dar satellite interferometry [5-9] has been used to evalu-
ate the evolution of the landslides and its correlation with
rainfalls.
Furthermore, in order to investigate the kinematics of
the landslides and the deformation pattern, a numerical
C
opyright © 2013 SciRes. IJG
A. ROSI ET AL. 905
modelling with FLAC has been carried out.
2. Study Area
2.1. Geological and Geomorphological Setting
Ricasoli is located on a morphological high rising from
227 m a.s.l to 246 m a.s.l. formed by sands, overlying
silts and clayey silts (Figure 1).
The village is located in a typical intramontane basin
oriented from NW to SE and formed during the exten-
sional phase of the Neogene-Quaternary evolution of the
Tyrrhenian side of the Northern Apennines [10].
The substrate of the basin consists of the Cervarola-
Falterona Unit in the eastern side and of the Macigno
formation on the western side. This area has been filled
from fluvia-lacustrine sediments that were deposited in
three phases between Lower Pliocene and Upper Pleis-
tocene and can reach a 500 m thickness [11].
Ricasoli village is located above sediments of the sec-
ond phase (fluvial-lacustrine phase) and the third phase
(fluvial phase). From the bottom to the top, the strati-
graphic sequence is made of by the sediments of the se-
cond phase (Terranova Silt, Ascione Stream clay, Silt
and Sands of Oreno Stream), overcame by the sediments
of the third phase (Sands of Casa La Loccaia and La-
tereto silts). In particular:
Terranova silt (TER): grey clayey silts in lower part
followed upward by medium-fine clayey sands. These
sediments have been deposited in a lacustrine environ-
ment and the maximum outcrop thickness is 25 - 30 m.
Ascione Stream clay (ASC): this unit consists of peaty-
silty clays deposited in lacustrine environment and they
are characterized by the presence of decimetric layers of
lignite. The thickness of the outcrops is 15 m.
Silt and Sand of Oreno Stream (LSO): grey silts, occa-
sionally clayey silts or arenaceous silts, which superim-
pose yellowish fine and medium grained sands. In the
inner part of these sediments residual paleosoils and
some levels of conglo merates with pebbles of sandstones
are present. The origin of this unit can be referred to a
lacustrine environment subject to recurrent fluvial epi-
sodes and emersion stages. The thickness of the outcrops
is 50 m.
Casa La Loccaia Sands (LOC): Sands and gravels
with arenaceous clasts with intercalations of reddish
arenaceous silts that often present pedogenesis phenom-
ena.
Latereto silt (LAT): massive silts highly pedogenized,
these sediments are deposited in a fluvial plain environ-
ment.
2.2. Landslide Phenomena
The instability phenomena involve the slopes surround-
ing the village and have been recorded from XVIII cen-
tury. According to what inhabitants refer, streets and
buildings that now rise close to the escarpments were
several meters far from them in the past decades. Some
people also refer the presence of a major road that now
totally disappeared in the Southern part of the village.
According to [12], the escarpments surrounding the vil-
lage moved back of 7 - 8 meters from year 1976 to 2001.
According to the classification proposed by [13], in the
area two main types of landslides can be recognized:
compound slides and falls.
Compound landslides affect the slope surrounding the
village (Figure 2), while minor detachment trigger on the
escarpment of the morphological high of Ricasoli. In the
Figure 1. Geological map and localization of Ricasoli.
Copyright © 2013 SciRes. IJG
A. ROSI ET AL.
906
Figure 2. Regional landslide inventory map for the area of Ricasoli.
regional landslide inventory map the slides have been
mapped as dormant.
In the area many evidences of landslide activity can be
recognized (Figure 3), in particular in the northern slope,
where cracks, small escarpments, counterslopes and cor-
rugations of the soil surface are present.
These cracks are mainly linear and perpendicular to
the maximum slope direction; they develop for a length
of 15 - 20 meters and in some cases show a vertical dis-
placement of 2 - 3 cm. Moreover this area is affected by
water surficial erosion of the soils, as attested by the
presence of sheet and rill erosion phenomena, as well as
siphoning, due to hydraulic circulation after heavy rain-
fall.
During the field surveys, several fissures have been
recorded on the wall of buildings and on the streets sur-
rounding the village, both in the northern and in the
southern side of the village, where the local school has
been heavily damaged.
In 2001, a landslide triggered by heavy rainfall dam-
aged a street in the northern side of Ricasoli: after this
event a concrete wall and several piles reaching a depth
of 18 m have been built to preserv e houses an d the street.
This retaining structure is currently damaged and only
partially working.
After the rainfalls and snowfalls occurred in Decem-
ber 2009 and January 2010, 3 new landslides have been
recorded and one more landslide triggered after the rain-
falls of March-April 2010. These events involved the
NW escarpment and the biggest landslide involved 70 m3
of soil in the slope underneath the church of Ricasoli.
3. Geotechnical Characterization
In 2004, 12 boreholes have been realized in the area and
15 undisturbed samples were collected at different depths
(Table 1); 7 boreholes have been equipped with incli-
nometers and 3 with piezometers (Figure 4).
On 11 samples of the collected ones a geotechnical
characterization ha s b een performed .
In particular granulometric distribution analysis was
performed by sieving as defined by the ASTM D2217
standards (Figure 5) and the samples were classified by
USCS system (Table 2).
The Attenberg limits analysis have been performed
following the ASTM D 4318-93, CNR-UNI 10014 stan-
dards for the Plastic limit (WP) and the BS 1377:1975
standard for the liquid limit (WL) which has been deter-
mined by conical penetrometer test. WL values range
from 23% to 35% and WP values range from 17% to 36%
(Figure 6).
In order to retrieve information on the shear strength
parameters, direct shear tests have been performed on all
samples, following the procedure described by ASTM
D3080-90 standards. The lowest shear strength values
were recorded in the Ascione Stream clay formation,
where the values of friction angle (φ’) range from 15˚ to
24˚ and values of effective cohesion (c’) range from 4 to
17 kPa.
Copyright © 2013 SciRes. IJG
A. ROSI ET AL. 907
Figure 3. Evidences and effects of landslides. (a) counter-
slope; (b) crack; (c) landslide on the northern escarpment;
(d) fissured street; (e) damaged wall; (f) damaged school.
Figures (a)-(d) are referred to evidences in the Northern
side of the village; Figures (e) and (f) are referred to the
Southern side.
Figure 4. Location of the sampling points, inclinometers,
piezometers and wells used for analyses.
Table 1. Depth of the collected samples.
Borehole 1 2 3 4 56 7 8 9 101112
Core
depth (m) 30 30 21 30 3020 30 30 30 303530
Sample 1
depth (m) 15 - 10 8 515 10 20 25 10--
Sample
2 depth (m) 28 - 18 24 27 28 - - 25--
Although the terrain of this formation has poor me-
chanical characteristics, these values seem to be referred
to residual values, i.e. the material was already involved
by shear bands.
Samples collected from the other formations show
friction angles usually higher than the Ascione Stream
clay, with φ’ ranging from 21˚ to 32˚ and c’ ranging from
2 kPa to 5 kPa.
Sample 1 of Core 8 has been used to perform torsional
shear test, to evaluate the residual shear strength.
This sample is located in the Ascione Stream clay
formation, where shear bands of wide rotational slides
can form, and shows a residual friction angle
r = 9˚.
Results of the geotechnical analyses are summarized in
Table 2.
The geotechnical characterization allowed to notice
that the materials involved in compound landslides are
mainly silts and fine sands, conversely the terrains close
to and forming the escarpments surrounding the village,
affected by falls phenomena, are mainly composed of
medium grained sands.
4. Instrumental Monitoring
4.1. Inclinometers
To monitor the evolution of landslides and to locate the
main slip surfaces, 8 inclinometers have been installed in
the village and in the surrounding slopes ( Figure 4): 4 in
the upper part of the village, 3 in the northern slope and 1
inclinometer in the southern slope.
Data have been collected during two different phases:
from autumn 2004 to spr ing 2005 and from 2009 to 2010.
Data collected by the inclinometric measurements show
the presence of several landslide phenomena, character-
ized by both shallow and deep sliding surfaces (Table 3).
Inclinometers I4 and I8, located in the northern slope,
show the presence of a main slide surface at a depth be-
tween 14 m and 18 m (Figure 7) a slow and continuous
evolution of the landslide along the maximum slope di-
rection.
The time series of inclinometric data showed an in-
creased displacement rate in the North-Western side of
the village during the first quarter of Year 2005.
These displacements were mainly recorded in the in-
clinometers I5 and I13, while smaller displacements were
recorded in the inclinometer I9.
The analysis of time series showed that consistent dis-
placements occurred also from 2005 to 2010, in particu-
lar displacements ranging from 10 mm to 20 mm were
measured in all the inclinometers still working in 2010,
with a maximum in the inclinometer I8, where, at the
beginning of the second phase, 40 mm displacements
were recorded from the last measurement of 2005.
In the period from January to July 2010 inclinometers
I9 and I2 recorded about a 25 mm displacement and the
I8 measured a displacement of 53 mm, while the others
inclinometers measured lower displacem e nt s (Figure 8).
It is worth noting that the inclinometer I8 is located in
the northern slope and that I9 is close to the northern side
of village, thus these measurements can be correlated,
whereas it seems that I2 cannot be related to them, since
it is located to the opposite side of the village.
In particular it can be assumed that the displacement
measured in the I9 is due to a tensional release caused by
the mobilization of the landslide affecting the northern
slope.
Copyright © 2013 SciRes. IJG
A. ROSI ET AL.
Copyright © 2013 SciRes. IJG
908
Table 2. Geotechnical parameters defined for the sampled soils. * indicates that the sample was not treated with H2O2. “a”
indicates that the sample is located in the upper part of the core. “b” indicates that the sample is located in the lower part of
the core. Asc: Ascione Stream Clay; Ter: Terranova Silts; Lat: Latereto Silts; Loc: Casa La Loccaia Sands; Lso: Silt and
Sand of Oreno Stream.
Core 3 3 4 4 4 5 6 7 7 8 8 10 10 10
Sample 1 2 1a 1b 2 1 1 1 2 1 1* 1 2a 2b
Depth (m) 10 18 8 8 25 4 15 9 28 20 20 10 25 25
Gravel (%) 0 0 23.6 1.6 0 0 0 0 0.3 0 0 0 0 0
Sand (%) 34.3 5.2 52.6 41.6 18.5 51.8 58.9 38.2 78.2 8.3 54 65.4 84.2 11.6
Silt (%) 57.9 67.7 15.8 35.1 42.5 22.5 36.9 46.6 18.7 52.2 26.3 32.3 14.4 51.4
Clay (%) 7.8 27.1 7.9 21.7 38.9 25.6 4.2 15.2 2.9 39.5 19.8 2.3 1.4 37.0
w (%) 18.2 17.8 - 22.9 20.0 17.5 16.6 17.9 14.8 35.7 - 22.1 36.1 36.1
WL (%) 26 31 - 38 49 34 23 33 - 45 - 24 19 33
WP (%) 24 18 - 29 29 28 21 26 - 36 - 18 17 19
IP (%) 2 13 - 10 11 6 2 7 - 9 - 6 2 14
USCS class. ML CL ML ML ML ML SM ML - ML-OLSM SM-SC SM CL
γ (kN/m3) 17.7 20.4 - 20.5 19.1 20.3 21.9 22.2 19.7 17.8 - 19.1 - 19.0
γd (kN/m3) 15 17.3 - 16.7 15.9 17.3 18.8 18.8 17.1 13.1 - 15.6 - 14
γsat (kN/m3) 19.3 20.7 - 20.3 19.7 20.6 21.6 21.5 20.5 18.1 - 19.6 18.6 -
Gs 2.7 2.7 - 2.7 2.67 2.67 2.7 2.6 2.6 2.7 - 2.7 - 2.7
E 0.78 0.53 - 0.59 0.65 0.52 0.41 0.39 0.52 1.02 - 0.7 - 0.89
n (%) 43.7 34.5 - 36.9 39.5 34 28.8 28 34.4 50.4 - 41.1 - 47.2
S (%) 63.5 91.4 - 100 82.1 90.7 100 100 75.2 94.7 - 85.6 - 100
c’ (kPa) 4 5 - 7 17 3 2 2 6 9 - 6 - 5
’ (°) 21.8 22.6 - 20.6 24.0 29.7 32.7 23.4 32.7 14.6 - 27.1 - 18.8
r’ (°) - - - - - - - - - 9 - - - -
Formation Asc Ter Loc Loc Asc Lat Lso Loc Lso Asc Asc Loc Lso Asc
Figure 5. Granulometric curves of the analysed samples.
A. ROSI ET AL. 909
Figure 6. Plasticity chart (after Casagrande) of the analyzed samples.
Figure 7. Cumulative displacements recorded by the inclinometers I4 and I8.
4.2. Extensometers
Wire extensometers are a useful instrument for a long-
time landslide monitoring and have been already used in
previous works [14-16].
Four wire extensometers have been installed in corre-
spondence of the inclinometric tubes I2, I5, I9 and I10 to
measure vertical displacements due to the landslides.
Measurements can be both positive and negative and this
can be related both to clay dynamics and landslide activ-
ity. Data collected from all the extensometers show a
cyclical pattern of displacement: usually during the wet
season (October-April) a stretching of the cable can be
observed (positive values) and this can be related to
swelling clay phenomena; otherwise the drying of clay
during the dry season usually lead to a shortening of the
cable (negative v a lues).
Obviously length variations and in particular the
stretching of the extensometers must be highly con-
sidered since they can be easily related to landslides
reactivations.
Both during the first and the second phase of meas-
urements the most significant displacements have been
recorded in the extensometers located in the inclinomet-
Copyright © 2013 SciRes. IJG
A. ROSI ET AL.
910
Table 3. Maximum displacements recorded by the incli-
nometers during two different survey periods. Data ac-
quired from 2009 in I10 result to be anomalous, so they
have not been used in the analyses.
2004-2005 2009-2010
Max displacement
(mm) Depth
(m) Max displacement
(mm) Depth
(m)
I2 2.1 11 27.8 0.5
I3 8.4 3.5
I4 5.6 18 14.7 18
I5 14.5 0.5 8.9 0.5
I8 7 13 52.7 (10)a 0.5 (13)a
I9 5.1 14 21.2 0.5
I10 7.6 17.5 102.7 2.5
I13 9.5 0.5 2.7 2
aNumbers in brackets indicate the displacement recorded at 13 m depth.
Figure 8. Displacements recorded by the inclinometer from
2004 to 2010.
ric tubes I2 and I10 (Figure 9). The extensometer placed
in the I2 tube (close to a highly damaged school in the
southern side of the village) showed a negative trend
during the first period of measurements, while during the
second one displacements start to be positive, that corre-
spond to a cable stretching. This could be easily related
to a landslide reactivatio n, but it could be due to the pre-
sence of a new construction site few meters away from
the extensometer.
At borehole I9 no significant displacement were re-
corded during the first survey, while in the period 2009/
2010 displacements up to 6 mm were measured. Exten-
someter I10 showed 3mm displacement in the 2005, and
it resulted to be stable during the 2009/2010 survey (dis-
placements < 1 mm).
5. Radar Satellite Interferometry
(PS-INSAR)
The permanent scatterers technique [9] is an useful tool
for ground deformation mapping and monitoring on large
scale [8]. This technique is based on the identification of
a series of stable radar targets called permanent scatters
(PS). Provided that long time series of SAR data are
available (at least 25 - 30 images), the PS approach, al-
lows to overcame the two most significant drawbacks of
convention al Differential SAR Interferometry (DInSAR),
namely decorrelation noise and atmospheric artefacts
[17].
Since PS are stable radar targets and if their spatial
density is enough (5 - 10 PS/km2) it is possible to esti-
mate and remove atmospheric noise so the only parame-
ters influencing the phase shift will be ground deforma-
tion [7-9,17]. The PS-InSAR approach has already pro-
ven its capability to draw a complete picture of the dis-
placement field occurring on villages built on the top of
relieves surrounded by unstable slopes [18,19].
In this work PS data provided by the Extraordinary
Plan of Environmental Remote Sensing (EPRS-E) of the
Italian Ministry of Environment, Land and Sea have been
used.
In this area PS data from ERS and ENVISAT satellites
have been used (Figure 10), allowing to analyse a long-
time data series (1992-2001 for ERS satellite and from
2003 to 2008 for ENVISAT satellite).
ERS data were available only in descending orbit and
their analysis showed that the higher velocities of defor-
mation were located close th e escarpments of the village,
which values reached 3mm/year, while the PS in the in-
ner part of Ricasoli showed deformation velocities close
to 1.5 mm/year; all v elocities are nega tive, i.e. the targets
were moving away from the sensors; this indicates the
general and widespread lowering of the entire ridge of
Ricasoli.
Data collected from ENVISAT satellite were available
both in ascending and descending orbit.
Analysis of these data showed the presence of low de-
formation velocities of the buildings inside the village,
higher velocities close to escarpments surrounding the
village (3 - 4 mm/year) and a peak velocity in the north-
ern slope (7 mm/year) where is located the major com-
pound slide. These values have been confirmed in both
orbits.
Figure 9. Length variations of the extensometers.
Copyright © 2013 SciRes. IJG
A. ROSI ET AL. 911
(a)
(b)
(c)
ly displacement value calculated with respect to the pre-
ormed using the data
co
analysis of time series seems to show that
th
a relationship
be
6.2. PS-Inclinometers Comparison
aluate the rela-
plished
fo
th
7. Numerical Modelling
atic of this knotty land-
stability of a landslide with a com-
po
investigated slopes
ca
is the FLAC (Fast Lagrangian
A
Figure 10. Deformation velocities measured by PSI. (a) ERS
data, descending orbit; (b) Envisat data, descending orbit;
(c) Envisat data, ascending orbit.
6. Data Comparison
Displacements recorded by ENVISAT satellite have been
compared with rainfalls and with inclinometric measures
to verify the presence of a relationship between the
movements registered by the various measuring sys-
tems and between ground displacements and precipita-
tions.
6.1. Rainfall-PS Comparison
Permanent Scatterers that recorded higher displacement
velocities have been used; to perform the comparison the
cumulative rainfall of the 30 days preceding the acquisi-
tion date of satellite data have been used as an alternative
to the traditional cu mulative monthly rainfalls, which are
ill-adapted to the time series of interferometric d ata (Fig-
ure 11).
This solution allowed a direct comparison between move-
ments and rainfalls, which makes clear, as can be ex-
pected, that higher ground deformations occurred after
the most intense rainfalls. A further development of this
process consisted in the monthly factorization of the dis-
placements measured by satellite, so as to have a month-
vious one. From this process it is possible to stress the
close relationship between the main rain events and the
ground displa cements (Figure 12).
The same analyses have been perf
llected from the ascending orbit the ENVISAT satellite,
to compare the results obtained by both th e orbits. Using
ascending orbit data, the relation between rainfall and
displacements results more evident, but, such as for the
descending orbit, there is no a quantitative relation be-
tween rainfall amount and ground displacement rates
(Figure 13).
The simple
ere is not any relation between the disp lace ments meas-
ured by each PS, but the monthly factorization showed
that the measured displacements are usually coherent
whether in ascending or descending orbit.
This remark may suggests that there is
tween the various phenomena present in the village
and in the surrounding slopes, at least as regarding the
trend of the movements.
A further analysis has been done to ev
tionship between PS inclinometers and rainfalls.
In particular this comparison has been accom
r the increased displacement phase recorded by the
inclinometers I5 and I13, by comparing the closest Per-
manent Scatter and the rainfalls of that period (Figure 14).
This process shows the presence of a relation between
e displacements measured by inclinometers and PS, but
with different displacement values, since PS measures
superficial movements and inclinometer deep ones. This
phase seems not to be related to the heavy rainfalls re-
corded in December 2004, since 3 months lasted from
the pluviometric event and the apex of the displacement.
To better investigate the kinem
slide, a numerical modelling describing the phenomena,
their spatial and temporal correlation and their evolution
has been carried out .
To investigate the
und sliding surface, traditional limit equilibrium me-
thods are not suitable and a numerical modelling based
on a stress-strain always is required.
Since the sediments composing the
n be roughly considered as continuous means (at least
horizontal), a software referred to the continuum me-
chanics has been chosen.
To perform this analys
nalysis of Continua) code has been used. FLAC is a
two dimensional finite difference program which simu-
lates the behaviour of the slopes that may undergo plastic
Copyright © 2013 SciRes. IJG
A. ROSI ET AL.
Copyright © 2013 SciRes. IJG
912
Figure 11. Comparison between displacements measured by PS and rainfall (ENVISAT, desce nding or bit).
Figure 12. Comparison between rainfalls and monthly ground displacement measured by radar satelliterferometry
ow when its plastic limit is reached. Two different
7.1. Compound Slide Simulation
compound sliding
has been created and it was shaped to draw the hypo-
ve an
el
ion according to the properties retrieved trough
inte
(ENVISAT descending orbit).
fl
models have been created, the first model simulates the
formation of a first-time compound landslide and its re-
sults were used as inputs of the second model, where the
effects on the main escarpment due to the mobilization of
this landslide have been investigated. The results of the
model have then been compared with the geomor-pho-
logical evidences observed during th e field surveys.
To simulate the growth of a first time
surface, a grid composed by 70 rows and 100 columns
thetical profile of a 20˚ leaning slope. This section has
been divided in four overlaying regions representing the
geological setting of the slope (Figures 1 and 15).
At the beginning, high strength values have been as-
signed to each region, to force the system to ha
astic behaviour and to avoid plasticization of the mate-
rials during the consolidation phase. After the positioning
of the water table (10 m below the ground lev el) calcula-
tion cycles have been started until getting to stable con-
ditions.
After that real strength values have been assigned to
each reg
A. ROSI ET AL. 913
Figure 13. (a) Comparison between displacements measured by PS and rainfall (ENVISAT, ascending orit); (b) Comparison b
between r ainfalls and monthly ground displaceme nt (ENVISA T ascending orbit).
Figure 14. Comparison between PS, inclinometers and rainfall data.
Copyright © 2013 SciRes. IJG
A. ROSI ET AL.
914
e geotechnical analysis (
ned different rheological
ch
calculations, it was possible to
no
deformation
in
shear bands can be
cl
thSection 3) and displacements
and velocities have been reset.
Each region has been assig
aracteristics: the basal region (Region 4) of the model
was characterized by an elastic behaviour, Region 3 by a
Mohr-Coulomb model, while Regions 1 and 2 were as-
signed a strain softening behaviour; Region 2 is also
characterized by lower strength values, compared to the
other regions, to simulate the peat level where the sliding
surface could be located.
After the beginning of
tice the formation of a plasticization area in Region 2,
after about 10,000 calculus steps.
After several thousand calculus steps the
creased and propagated towards the inner part of the
slope, causing the decay of cohesion and friction angle
parameters according to a numerical relation defined
during the design phase (Figure 16).
After 16,000 calculation steps, two
early recognized: the first one origins from the peat
level and rises to the surface intersecting the ground level
at the edge of the escarpment. The second shear zone is
perpendicular to the first and start from its bending point,
Figure 15. Schematic setting of the slope used to perform
the numerical modelling.
Figure 16. Different calculation phases; deformation star
e typical graben usually
ompound lan dsl i des.
ain
sc
ion
ope due
w grid,
arameters have been created. The purpose
of
no
gned to each region
(T
pa
eotechnical parameters used in the model.
Re
ts
to be visible after 10,000 steps.
present in correspondence of c
describing the formation of th
After 30,000 calculation steps all the characteristics of
a compound landslide can be clearly observed: the m
arp and the counter-slope can be observed in the upper
part of the landslide, the graben and the final opposite
fracture at the end of the mass (Figure 17).
7.2. Simulation of Landslide Reactivat
To better understand the effects on the northern sl
to the reactivation of the deep landslide, a ne
made by 75 rows and 130 columns, has been created,
shaped according to the real topography of the slope
(Figure 18).
Similarly to the first model, four regions with different
geotechnical p
the second model is to investigate the possible shallow
effects due to the reactivation of the deep landslide; for
this reason an existing sliding surface has been drawn in
correspondence of the peat layer, considering the results
of the first model and the geomorphological evidences.
At the beginning all the regions were attributed high
strength values, to avoid plasticization and sliding phe-
mena during the initial phase of consolidation. After
the definition of the water table level (according to the
piezometric readings), the calculation cycles to reach the
consolidation of the model started .
When consolidation phase was terminated, the real
geotechnical parameters were assi
able 4) and the sliding surface was released, allowing
moving. Before starting the elaboration it was necessary
to verify the absence of local plasticization phenomena
possibly occurred during the consolidation phase, while
low and homogeneously distributed values are acceptable.
After the beginning of the calculation cycles ~37,000,
cycles) the formation of plasticization zone in the upper
rt of the main scarp is evident (Figure 19), suggesting
the growth of a new shallow landslide at the edge of the
slope. By observing the displacement vector chart it is
possible to notice an early small movement of the land-
slide (millimetric displacements) which creates, during
its evolution, a tensional release in the upper slope caus-
ing the formation of small shallow landslides (Figures
20(a)-(d)).
Table 4. G
gionLithologyDensit y (kg/m3) C’ (kPa)
’ (˚) mod
1 Sand 1900 9 30˚ Mohr
2 Le
4 substrate1900 #### #### elastic
andslid1900 12 22˚ Mohr
3 Clay 1900 12 22˚ Mohr
Copyright © 2013 SciRes. IJG
A. ROSI ET AL. 915
Figure 17. Deformation grid after 30,000 calculus steps.
he effects of
reactivation of the landslide.
lusion
li is located results
Figure 18. Starting model used to investigate ta
8. Discussion and Conc
The morphological high where Ricaso
to be affected by several instability pheno mena involving
the escarpments of the village, where surficial landslides
have been detected, and the surrounding slopes, where
large compound land slides are present.
The effects and the magnitude of the damages of land-
slides activity vary inside the village, according to the
position and the distance of the buildings from the edge
of the escarpments.
In the northern side of the village, main damages are
located in the local street, where several fractures can be
observed, while in the southern part of Ricasoli several
houses and buildings result to be affected by structural
problems.
During the second period of surveys four new land-
slides and several damages to buildings and facilities
have been observed after a long rainy period. This can
lead to confirm the high velocity of formation and evolu-
tion of the shallow landslides affecting the slopes sur-
To better understand the landslide behaviour a com-
plete geotechnical characterization has been performed
on 11 samples collected at different depths. These analy-
ses showed the prese
rounding the village.
nce of mainly sandy-silty terrains,
with clayey terrains in the formations of Silt and Sand of
Oreno Stream (LSO) and Ascione Stream clay.
Direct shear tests have been performed and φ’ values
ranged from 15˚ to 32˚, with the lowest values in a sam-
ple collected in the Ascione Stream clay, collected at a
depth of 20 m from ground level. In this sample torsional
shear test has been performed and the residual shear
strength resulted to be
r = 9˚.
Data collected by the instrumental monitoring seems
to show a higher diffusion of instability phenomena, but
these results could be affected by some external factors,
both natural and anthropic.
For instance the extensometers showed, during the
second phase of the surveys, higher displacements than
in the first one, but this can be related to the swelling of
the clays of the Ascione Stream clay and Terranova Silt
formations, that during the winter showed a considerable
increase of volu me.
Inclinometer and extensometer located at borehole I2
showed the presence shallow deformations, but these can
be related to the establishment of a new construction site
near this point; otherwise the movements registered in
the inclinometer I9 can be clearly related to the landslide
events occurred between January and April 2010.
Inclinometers I4 and I8, that are located inside the
landslide in the northern slope, were useful to define the
Copyright © 2013 SciRes. IJG
A. ROSI ET AL.
916
Figure 19. Plasticization pheno mena in the upper part of the scarp.
(a) (b)
(d)
(c)
Figure 20. Reactivation and evolution of the landslide in the
northern slope.
ovement of the sliding mass.
PS data analysis confirm the presence of slow land-
small and
sl
th
Figure 21. Geotechnical section of Ricasoli.
From this model it is possible to notice the two main
landslides involvin g the northern and the southern slopes
of the village, which indirectly affect the escarpments
surrounding the village and cause their drawing back b
the actiduring
e rainiest periods, when pore pressures quickly in-
cr
ly affect the geotechnical properties of the for-
m
depth of the sliding surface and to confirm the presence
of a continuous m
slide movements in the slopes at the basis of the village,
in fact satellite data show the presence of a
ow subsidence of the village, caused by the lateral
spreading that involve the morphological high where
Ricasoli is located; furthermore the velocities defined by
radar interferometry are comparable with the displace-
ments measured by the inclinometers (i.e. ~1 mm/year).
All the information collected from field surveys and
data analysis have been used to define a conceptual
model used to summarizing all th e results and describing
e actual geological setting of the area (Figure 21).
y
vation of shallow landslides, in particular
thease.
After this work it was clear that the whole ridge, where
Ricasoli is located, is affected by widespread and het-
erogeneous landslide phenomena mainly due to the geo-
logical setting of the area. The presence of clay minerals
and especially the high content in organic materials
negative
ations that compose the slopes, furthermore the sand
formations, such as Casa Loccaia Sands, which overlay
the clays, are very susceptible even to small stresses and
can easily collapse. In addition to the natural factors, the
anthropological ones must be considered. The poor ma-
nagement of the surface drainage can be considered as
one of the causes of the hydrogeological problems in-
Copyright © 2013 SciRes. IJG
A. ROSI ET AL. 917
volving the village. Rainfall indeed is poorly canalized in
a drainage system as a sewerage, which results to be
damaged or interrupted as demonstrated the stagnation of
water in the manholes. This f act facilitates the infiltration
of water into the soil and, during the rainiest periods, its
infiltration to the clay layers, causing an increase in pore
pressure, which can lead to slope instability phenomena.
By the data collected during the field survey it was
possible to understand which areas are most affected by
retreat phenomena or by various kind of slope instability
and if ther e have been changes compared to th e previous
years.
Results show a greater spread of deep movements af-
fe
d in buildings and facilities of the village. More-
ov
es with the slow downstream
m
r during the wet season
w
lides, Vol. 3, No. 1, 2005, pp
13-21. doi:10.1007/s10346-005-0007-y
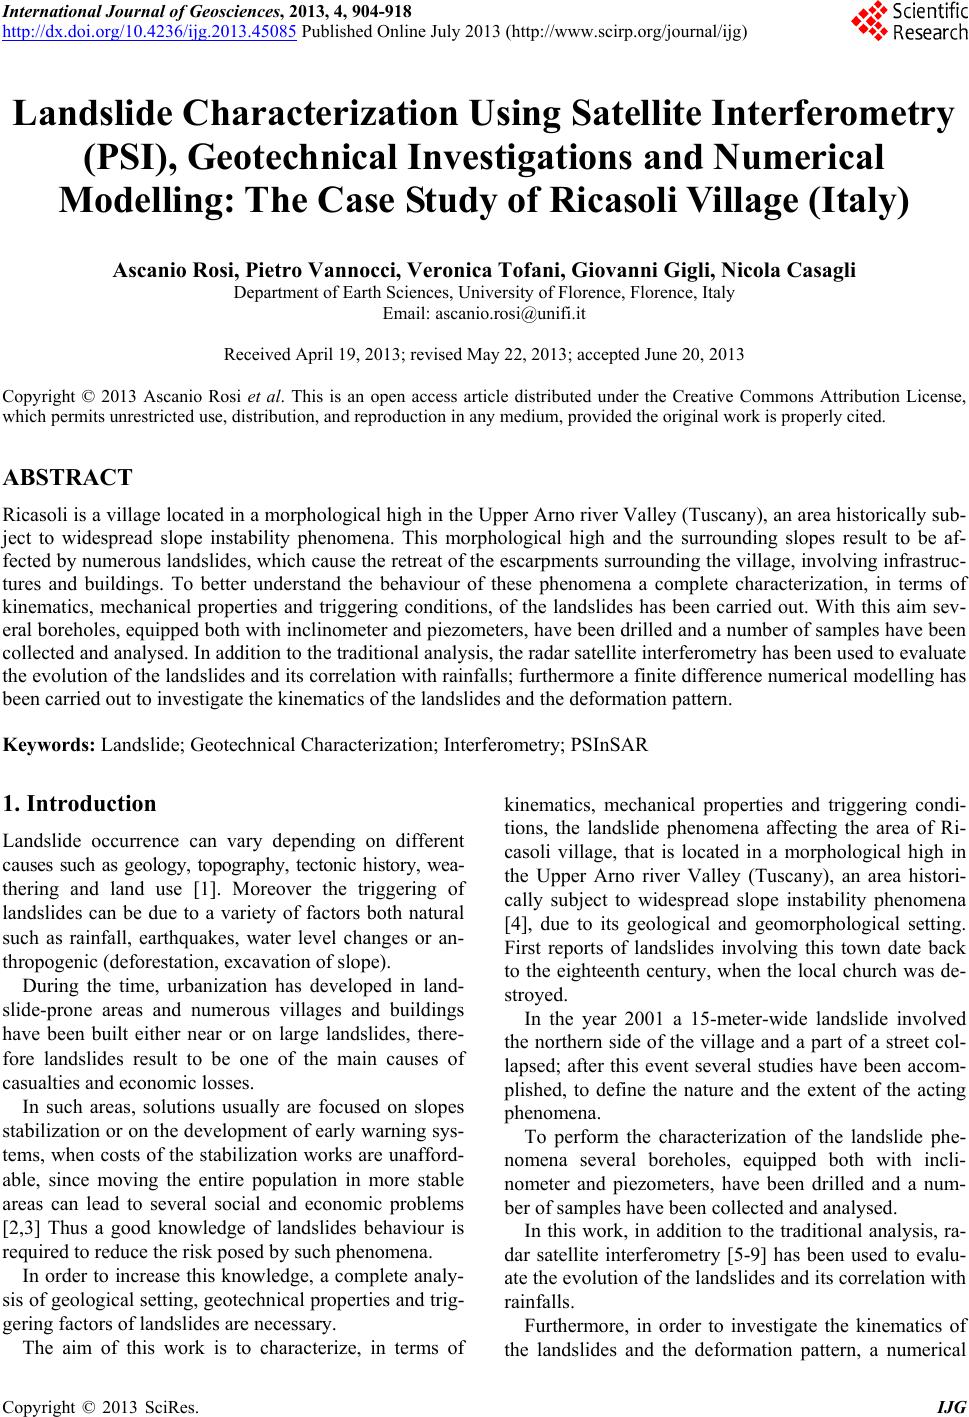
cting the clay formations, but during the last years the
inclinometers showed the activation of several shallow
phenomena; the presence of these phenomena is con-
firmed by the numerous cracks detected both in the ter-
rain an
er some shallow landslides triggered close to some
boreholes and involved the upper part of the terrain (~1
m depth). All these phenomena are located in the Casa
Loccaia Sands formation and can be related to the nu-
merous rainfall events that involved the area from Octo-
ber 2009 to April 20 10.
The numerical modelling allowed defining the effects
of the reactivation of a compound landslide, that results
to be comparable with the morphological evidences de-
tected during the field surveys.
It is then possible to relate the presence of several
cracks and shallow landslid
otion of the main landslides, that move slowly and con-
tinuously causing a tensional release on the slopes sur-
rounding the village and inside the village itself. These
shallow landslides usually occu,
hen the soil can be considered almost saturated and
pore pressure quickly increases, leading to a reduction of
shear strength of the terrain.
The combination of these factors leads the entire area
where Ricasoli is located to be very exposed to the risks
of landslides, which occur very rapidly and can directly
affect facilities and houses that are located within walk-
ing distance from the slopes.
REFERENCES
[1] N. Casagli, S. Dapporto, M. L. Ibsen, V. Tofani and P.
Vannocci, “Analysis of the Landslide Triggering Mecha-
nism during the Storm of 20th-21st November 2000, in
Northern Tuscany,” Lands.
[2] E. Intrieri, G. nti and N. Casagli, Gigli, F. Mugnai, R. Fa
“Design and Implementation of a Landslide Early Warn-
ing System,” Engineering Geology, Vol. 147-148, 2012,
pp. 124-136. doi:10.1016/j.enggeo.2012.07.017
[3] E . Intrieri, G. Gigli, N. Casagli and F. Nadim , “B r ie f C om -
munication: Landslide Early Warning System: Tool-Box
and General Concepts,” Natural Hazards and Earth Sys-
tem Science, Vol. 13, No. 1, 2013, pp. 85-90.
doi:10.5194/nhess-13-85-2013
[4] P. Canuti, N. Casagli, F. Catani and P. Farina, “Landslide
Hazard Mapping at a Basin Scale Using Remote-Sensing
ometry and
he Earth’s Surface,” Re-
Data and Neural Networks,” 4th International Symposium
on Landslide Risk Mitigation and Protection of Cultural
and Natural Heritage, Kyoto, 15-16 January 2005.
[5] D. Massonnet and K. L. Feigl, “Radar Interfer
Its Application to Changes in t
views of Geophysics, Vol. 36, No. 4, 1998, pp. 441-500.
doi:10.1029/97RG03139
[6] P. A. Rosen, S. Hensley, I. R. Joughin, F. K. Li, S. N.
Madsen, E. Rodriguez and R. M. Goldstein, “Synthetic
Aperture Radar Interferometry,” Proceedings of the IEEE,
Vol. 88, No. 3, 2000, pp. 333-382. doi:10.1109/5.838084
[7] C. Colesanti, A. Ferretti, C. Prati and F. Rocca, “Monitor-
ing Landslides and Tectonic Motion with the Permanen
Scatterers Technique,” En
t
gineering Geology, Vol. 68, No.
1-2, 2003, pp. 3-14. doi:10.1016/S0013-7952(02)00195-3
[8] C. Colesanti, A. Ferretti, F. Novali, C. Prati and F. Rocca,
“SAR Monitoring of Progressive and Seasonal Ground
Deformation Using the Permanent Scatterers Technique,”
IEEE Transactions on Geoscience and Remote Sensing,
Vol. 41, No. 7, 2003, pp. 16S5-1701.
[9] A. Ferretti, C. Prati and F. Rocca, “Permanent Scatterers
in SAR interferometry,” IEEE Transactions on Geosci-
ence and Remote Sensing, Vol. 39, No. 1, 2001, pp. 8-20.
doi:10.1109/36.898661
[10] E. Abbate, “Fluvial-Lacustrine Deposits of the Upper
Valdarno,” C.N.R., Firenze, 1983.
[11] F. Fidolini, M. Ghinassi, M. Magi, M. Papini and M. Sa-
asuto and S. Silvano, “Measurement of Landslide Dis-
gri, “The Plio-Pleistocene Fluvio-Lacustrine Upper Valdar-
no Basin (Central Italy): Stratigraphy and Basin Fill Evo-
lution,” Italian Journal of Geosciences, Vol. 132, No. 1,
2013, pp. 13-32.
[12] M. Magi, “Geological Analysis of Landslides Involving
Ricasoli Village,” Unpublished Report, 2007.
[13] D. M. Cruden and D. J. Varnes, “Landslide Types and
Processes,” In: A. K. Turner and R. L. Schuster, Eds.,
Landslides: Investigation and Mitigation: Sp. Rep. 247,
National Academy Press, Washington DC, 1996, pp. 36-
75.
[14] J. Corominas, J. Moya, A. Ledesma, J. Rius, J. A. Gili
and A. Lloret, “Monitoring of the Vallcebre Landslide,
Eastern Pyrenees, Spain,” In: Yagi, Yamagami and Jiang
Eds., Slope Stability Engineering, Balkema, Rotterdam,
1999, pp. 1239-1244.
[15] J. Corominas, J. Moya, A. Lloret, J. A. Gili, M. G. Angeli,
A. P
placements Using a Wire Extensometer,” Engineering
Geology, Vol. 55, No. 3, 2000, pp. 149-166.
doi:10.1016/S0013-7952(99)00086-1
[16] J. Corominas, J. Moya, A. Ledesma, A. Lloret and J. A.
Gili, Prediction of Ground Displacements and Velocities
from Groundwater Level Changes at the Vallcebre Land-
slide (Eastern Pyrenees, Spain),” Landslides, Vol. 2, No.
Copyright © 2013 SciRes. IJG
A. ROSI ET AL.
Copyright © 2013 SciRes. IJG
918
2, 2005, pp. 83-96. doi:10.1007/s10346-005-0049-1
[17] C. Colesanti, R. Locatelli and F. Novali, “Ground Defor-
mation Monitoring Exploiting SAR Perman
ers,” Proceedings of the IEEE Intern
ent Scatter-
ational Geoscience
and Remote Sensing Symposium, Toronto, 24-28 June
2002, pp. 1219-1221.
doi:10.1109/IGARSS.2002.1025894
[18] F. Cigna, C. Del Ventisette, G. Gigli, F. Menna, F. Agili,
V. Liguori and N. Casagli, “Ground Instability in the Old
,” Natural Hazards
Town of Agrigento (Italy) Depicted by On-Site Investiga-
tions and Persistent Scatterers Data
and Earth System Science, Vol. 12, No. 12, 2012, pp. 3589-
3603. doi:10.5194/nhess-12-3589-2012
[19] G. Gigli, W. Frodella, F. Mugnai, D. Tapete, F. Cigna, R.
Fanti, E. Intrieri and L. Lombardi, “Instability Mecha-
nisms Affecting Cultural Heritage Sites in the Maltese
Archipelago,” Natural Hazards and Earth System Science,
Vol. 12, No. 6, 2012, pp. 1883-1903.
doi:10.5194/nhess-12-1883-2012