 International Journal of Geosciences, 2013, 4, 880-890 http://dx.doi.org/10.4236/ijg.2013.45082 Published Online July 2013 (http://www.scirp.org/journal/ijg) Bioremediation of Acetochlor in Soil and Water Systems by Cyanobacterial Mat Yasser El-Nahhal1,2, Yousef Awad3, Jamal Safi2,3 1The Islamic University, Gaza, Palestine 2Environmental Protection and Research Institute (EPRI), Palestinian National Authority (PNA), Gaza, Palestine 3Al-Azhar University, Gaza, Palestine Email: y_el_nahhal@hotmail.com;eprigaza@palnet.com Received April 26, 2013; revised May 29, 2013; accepted June 27, 2013 Copyright © 2013 Yasser El-Nahhal et al. This is an open access article distributed under the Creative Commons Attribution License, which permits unrestricted use, distribution, and reproduction in any medium, provided the original work is properly cited. ABSTRACT This study investigated the bioremediation of organic pollution in soil and water systems by cyanobacterial mats col- lected from Wadi Gaza. Acetochlor, a model compound of herbicide, was used as a standard organic pollutant. Various concentrations of acetochlor were injected in soil and water samples pre-treated with cyanobacterial mat for several periods of time. Percentage of growth of wheat as a test plant was taken as indicator of bioremediation of acetochlor. Results showed that acetochlor was degraded in both soil and water systems. Degradation was much faster in the water system than in the soil system. Concentrations of acetochlor above the field rate did not affect the bioremediation proc- ess in the water system whereas it did in soil pots. Furthermore, bioremediation in water system was nearly completed in 15 days whereas it did not reach high percentage in the soil system. These encouraging results are new contribution in field of bioremediation of pesticide by cyanobacterial mats and suggest that application of cyanobacterial mat could be a fast and suitable methodology for bioremediation of organic pollutant in the ecosystem. Keywords: Cyanobacterial Mat; Acetochlor; Soil and Water Systems 1. Introduction Acetochlor is a widely used herbicide in the Middle East and world wide. Its frequent application has created environmental problems to the soil, the water and the eco-system. For instance acetochlor has been shown to be directly affecting the agro-ecosystem by impacting some biological functions such as the decomposition of soil organic matter and the availability of soil nutrients [1], and being toxic to humans and other mammals [2] and reducing the abundance and diversity of non-target organisms [3]. Acetochlor is classified as a leachable compound in the soil and its potential for contamination of the ground water is comparable with those of alachlor and metolachlor [4]. Acetochlor was detected in the rain samples collected from 4 sites in Iowa and other nine states in USA [5], in the streams and surface water [6] and in the groundwater [7]. Furthermore, the leaching behavior of acetochlor was carefully studied using columns techniques and determined that acetochlor has the potential of moving along the soil profile [8,9]. However, leaching of acetochlor was also restricted in the soil profile by the use of organo-clay formulations [8,10]. Konda and Pasztoe [11], investigated the envi- ronmental behavior of acetochlor and reported that the maximum detected residues of acetochlor in the stream water was 1 order of magnitude higher than the maxi- mum residue limit specified by the European Union (EU) for environmental and drinking water (0.1 mg/l). Furthermore, several chloroacetanilides have been shown to cause health hazards, for instance, acetochlor can produce significant incidences of thyroid, bone, granular stomach and nasal cavity tumors in rats, and of liver and lung tumors in mouse [12]. It may also have induced glutathione-dependent cytotoxicity in cultured animal and human cells [13]. The mutagenicity of acetochlor, alachlor, butachlor, and metolachlor has been reviewed thoroughly [14]. Acetochlor was classified as likely to be carcinogenic to humans [15]. The objectives of this study are to investigate the bioremediation of acetochlor con- tamination in the soil and water systems and to optimize the bioremediation process. Our idea behind this work based on the use of cyanobacterial mats that were col- lected from Wadi Gaza, since the Wadi was exposed to different chemical pollution sources as we observed. Fur- thermore, our previous work in the use of cyanobacterial C opyright © 2013 SciRes. IJG  Y. EL-NAHHAL ET AL. 881 mats in the bioremediation studies [16-19] showed that the cyanobacterial mats were able to degrade diesel oil and hydrocarbons. 2. Materials and Methods Analytical grade acetochlor, purity 98% was purchased from ChemService USA. Its solubility limit in the water is 223 mg·L−1, (25˚C), stable for over 2 years at 20˚C. It is a hydrophobic herbicide with an octanol/water parti- tioning coefficient Kow = 2.85 [20]. 2.1. Soil Collection and Analysis Soil samples, were collected from the top 0 - 30 cm of the agricultural land located in Al Zawaida village in the middle governorate of Gaza strip, have no history of acetochlor application in the past 10 years. Soil samples were analyzed for physicochemical properties following the procedure described by El-Nahhal et al. [21]. 2.1.1. Determi na tion of pH, EC and Cations Ten g soil sample was transferred to 100 ml plastic bottle, 50 ml of distilled water was added to each flask and shaking overnight. After 24 h pH and EC values were measured by digital and portable pH (handylab2, pH 320/Set-2, Best.-Nr 100 739, made in Germany) and conductivity meter (LF 318/Set, Best.-Nr 300 231, made in Germany). The soil suspensions were filtrated using normal Whatman filter paper. The filtrates were collected in plastic bottles and re-filtrated again to ensure ultra pure solution. Sodom, Potassium and Calcium ions were determined using atomic absorption apparatus. 2.1.2. Determination of Available Phosphorus Ten g of the tested soil samples were transferred to a 250 ml plastic bottle. About 200 ml CAL-liquid (Calcium lac- tate + calcium acetate) was added to each tube and shak- ed for 2 h using rotary shaker. The samples were filtered 2 times as mentioned above. The filtrates were trans- ferred to Atomic Absorption Apparatus for determination of Phosphorus. 2.1.3. Determin ation of Total Nitr og en Selected representative soil samples were transferred to the laboratory of CNSHO analyzer, Euro EA 3000 Ele- mental Analyzer to determine N content in selected soil samples. In this laboratory few mg of dry soil were weighed and transferred to the CNSHO analyzer, for analysis. 2.2. Collection of Cyanobacterial Mat Cells The floating blue green cyanobacterial mats used in these researches were collected from the western part of Wadi Gaza near the Mediterranean Sea beach by using algal net, and different volumes of plastic bottles. The col- lected mat was then submerged in a plastic bottle full with aqueous media from the same place [16-19]. The water temperature during the sampling process ranged between 24˚C - 31˚C; salinity ranged between 3% - 3.6% and the pH ranged between 8.5 - 9.01. Each sam- pling process included a plastic bottle filled with green aqueous media from the surrounding of the mats as a growth media. The samples were then transferred to the laboratory and physically sieved using a 0.2 mm mesh sieve and then diluted with a ratio of 1:1 by tab water free from chlorine or any disinfecting agents and shacked very well to form homogenized suspension. The diluted samples were then incubated at 20˚C - 25˚C in the labo- ratory [22]. The collection of cyanobacterial mats was re- peated several times as required. To assure the presence of cyanobacterial mats in the samples the population growth of mats in the solution were measured by recording the optical density of the solution using spectrophotometer at wave length 680 nm [23]. Furthermore, identification of cyanobacterial mat cultures in genera and specie used in this work is cur- rently under our investigation. 2.3. Soil Sterilization The collected soil samples were sieved using a 2 mm mesh size then sterilized using an autoclave (SS-325- Automatic High-Pressure-Steam sterilizer Class I-B). In this technique, 6 kg soil was added to polyethylene pack- ets and saturated with water and transported to smaller nylon envelops that are tolerant to high temperature. The soil samples were then kept in the autoclave under 120˚C for 1.5 hours. Then the soil samples were left for cooling. The cooled soil was transferred to black plastic pots having 4 holes in the bottom, for the execution of the experiment. 2.4. Acetochlor Solution Preparation Technical amount of acetochlor (200 mg·L−1) was dis- solved in 1 L of distilled water and used as a stock solu- tion throughout the experiments to prepare the standard solution and the needed dilutions as planned in the ex- periments. The following concentrations of acetochlor were prepared and tested 0.0, 0.055, 0.11, 0.22, 0.44, and 0.88 mg·Kg−1 soil. 2.5. Bioassay Technique The idea behind using bioassay technique is to evaluate the remaining concentration of acetochlor and thus to estimate the biodegradation in the soil and the aquatic media. The idea is based on the fact that bioassay tech- nique is more sensitive than chemical technique, beside the fact that it can determine low concentrations and it is Copyright © 2013 SciRes. IJG  Y. EL-NAHHAL ET AL. 882 environmentally friendly as previously reported [24]. Based in the method previously reported [10,25], the herbicidal activity was determined according to Equation (1) (see below). Then the remaining concentration of ace- tochlor in soil was determined using Equation (2) which is initiated from a linear dose-response relationship from the above mentioned concentrations (Figure 1). Based on regression analysis, the necessary equation to evaluate the remaining concentration at the corresponding value of growth inhibition was determined. In these experi- ments, wheat (Triticum sp) was used as test plants for bioassay techniques [21]. In this procedure, appropriate concentrations as men- tioned above were prepared and mixed thoroughly in the soil. Then the soil was distributed evenly to 5 plastic pots. Ten seeds of the test plant were sown in each pot. The pots were then carefully transferred to the growth cham- ber for 2 weeks and irrigated as necessary with regular water free from chlorine. After 2 weeks, the plant height was taken as indicator of growth and used to calculate % growth inhibition according to Equation (1). %Growth Inhibition100 ctc PPP 112.77 .YX (1) where Pc and Pt are the shoot heights of the control and the treated samples at any pot. Furthermore, plotting % Growth Inhibition versus concentrations and converting the relation to a log scale produced a liner relationship represented by Equation (2) (2) where Y and X represent %Growth inhibition and con- centration in log scal. 2.6. Biodegradation of Acetochlor 2.6.1. Biodegradation in Soil Pots Twenty ml of cyanobacterial mats suspension were mixed with 340 gm soil pots and left for 20 days before the cultivation and application of acetochlor herbicide. Acetochlor concentrations (0.0, 0.055, 0.11, 0.22, 0.44, y = 112.77x R 2 = 0. 9556 0 20 40 60 80 100 120 00.2 0.4 0.6 a ce tochlor conc mg/ kg % g rowth inhi biti on 0.8 1 Figure 1. Dose response relationship of acetochlor concen- tration and wheat growth. 0.88 mg·Kg−1 soil) were applied to soil directly in the cultivation day. Each concentration has 5 replicates. The same concentrations were used in all the next experi- ments. 2.6.2. Incubation of Acetochlor with Cyanobacterial Mats Directly in Pots for 20 Days In this experiment, soil samples (340 g/pot) were sprayed with required acetochlor concentrations and cyanobacte- rial mat concentration (20 ml/pot) immediately in the same day and kept for incubation at saturation point for 2 weeks. The optical density of cyanobacterial mat con- centration in the added solution to the pots or water sys- tems was 0.214 ± 0.001. The concentration was deter- mined using spectrophotometer at wave length 680 nm [23]. Then 10 seeds of the test plant were sown in each pot and the pots were transferred to the growth chamber for additional 2 weeks. The authors considered 10 seeds as significant for obtaining good quality statistical data. The pots were irrigated with 20 ml water free from chlo- rine after germination of seeds. The authors used this small fraction of irrigation water to avoid possible leach- ing of acetochlor. The plant was kept irrigated as required. The growth of the test plants were taken as indicator of the remaining concentration of acetochlor according to Equation (1). 2.6.3. Effect of Different Factors on Acetochlor Biodegradation In this procedure we investigated the influence of three parameters as detailed in the sections below. 1) Influence of Incubating Acetochlor with Cyanobac- terial Mats at a Liquid Media To optimize the biodegradation of acetochlor the test- ed concentrations were separately incubated with cyano- bacterial mat in a liquid media. In these experiments, the tested herbicide concentrations were prepared and trans- ferred to glass bottles and 20 ml of cyanobacterial mat was added to each bottle and completed to the required volume with tap water free from chlorine. The bottles were transferred to the growth chambers for 20 days. In this technique, the sterilized soil samples were trans- ferred to plastic pots. Ten seeds of the test plant were sown in each pot. The pots were organized as groups according to the tested concentrations of each herbicide, then each group of pots was irrigated with 20 ml of the tested concentration for one time only. The pots were then kept wet by the addition of few drops of irrigation. The pots were left in the growth chamber for 2 weeks and then the growth was calculated according to Equa- tion (1). Growth of the test plant was taken as indicator of the biodegradation of the herbicide. Then the biodegradation experiments were tested by Copyright © 2013 SciRes. IJG  Y. EL-NAHHAL ET AL. 883 bioassay technique using Equation (1). 2) Influence of Different Incubation Period In this procedure, the tested acetochlor concentrations were incubated with 20 ml cyanobacterial mats in liquid media for 5, 10, 15, 25 and 30 days. Then the liquid me- dia was used to irrigate pots pre-planted with 10 seeds of the test plant. The control sample of this experiment was incubating herbicides concentration in a liquid media without cyanobacterial mats for the same period of time. Growth inhibition was taken as indicators of herbi- cides concentrations, and calculated according to Equa- tion (1). 3) Influence of Various Cyanobacterial Mats Concen- trations Following the procedure described above, 10, 40, 50 and 80 ml of cyanobacterial mats suspension were added to the tested concentration of herbicides for constant pe- riod. The liquid media used to irrigate pots pre-planted with 10 seeds of test plant. Growth inhibition was taken as indicators of herbi- cides concentration, according to Equation (1). 2.7. Chemo-Determination of Acetochlor Water samples were taken from the experiments men- tioned above (Sections 2.6.3), and analyzed for possible residues of acetochlor following the procedure previ- ously discibed [8]. In this procedure acetochlor was ex- tracted from 10 ml water sample by adding sodium chlo ride (2.4 g) into a glass tube, combined with 10 ml of of ethyl acetate/isooctane (1:9 v/v). The tubes were sealed, vortexed for 2 min at the highest speed, and stored at room temperature for 1 hour until the ethyl acetate/iso- octane separated. The ethyl acetate/isooctane layer was collected into 25 ml volumetric flasks. The extraction procedure was repeated twice. The extracts were brought to a volume of 25 ml with the same solvent mixture, transferred to the crimp vials, sealed and analyzed at a reference laboratory at Cairo University, Egypt, using a Hewlett-Packard Model 6890 gas chromatograph, equip- ed with electron-capture detector. A RtxR-5MS capillary column (30 m × 0.25 mm internal diameter, 0.25 m film) (Restek Corporation, Bellefonte, PA, USA) and nitrogen as the carrier gas at a flow-rate of 2 ml·min−1. The nitro- gen make-up flow-rate was 30 ml·min−1. The injector and detector temperatures were 250˚C and 280˚C, re- spectively, whereas the column was programmed at 170˚C for 1 min, then the temperature was increased at a rate of 5˚C min−1 to 250˚C, and held at this temperature for 5 min. 2.8. Data Analysis The experiment design was a randomized block. The growth inhibition data were subjected to analysis of variance using repeated measures ANOVA. T-test was used to test the significant difference among treatments by calculating p-value at 0.05 levels. Values above 0.05 indicate no significant differences whereas values below 0.05 indicated significant differences. Average and stan- dard deviation was calculated for each concentration. 3. Results and Discussion The cyanobacterial mats used in this study was collected from Wadi Gaza. The Wadi receives a variety of pollu- tion sources such as diesel oil, hydrocarbons, sewage, pesticides, solid waste as well as agricultural and Indus- trial discharges [17]. Fossil fuel pollution in Wadi Gaza, salinity, temperature and water level of the Wadi change seasonally, leading to marked changes in the appearance of the mats. In the western part, salinity ranges between 1% (w/v total salts) in winter and 3.5% in summer and the average daily temperature varies between 15˚C in winter and 35˚C in summer [16]. At the time of sampling, the mats were submerged, measured water temperature was 26˚C, and the salinity was 2%. Microbial biofilms dominated by cyanobacteria were found to develop on the sediment surface in the presence of this high level of pollution. Abed et al. [16], studied the diversity of cyanobacteria at Wadi Gaza using direct microscopy as well as molecular approaches and showed that the Wadi was dominated by the diversity of cyanobacteria with phormidium and Oscillatoria-like morphotypes. Other bacterial populations belonging to Cytophaga Flavoba- ter/Bacteroides group as well as β and δ subclasses of the Proteobacteria were also detected. Phylogenetic analysis showed that some of these bacteria were related to envi- ronmental sequences retrieved from activated sludge, a finding consistent with the sewage pollution in the site, while others were related to the bacteria which is capable of degrading aromatic compounds. 3.1. Soil Properties The physical analysis of the tested soil showed that sand, silt and clay contents were 92%, 2% and 6% respectively. The chemical analysis showed that N% and P% were 1.5 and 1.2 respectively, whereas Na+, K+ and Ca++ were 30.5, 0.4 and 29 mg·Kg−1, respectively. pH and EC were 7.5 and 5.3 respectively. 3.2. Bioremediation of Acetochlor 3.2.1. Dose-Re sponse Relationship Responses of wheat plants to different concentrations of acetochlor are shown in Figure 1. It can be seen that a linear relationship of low concen- trations of acetochlor and wheat growth has been estab- lished (R2 = 0.9556, and Y = 112.77X). This relation- ship allows us using the equation shown in Figu re 1 to Copyright © 2013 SciRes. IJG 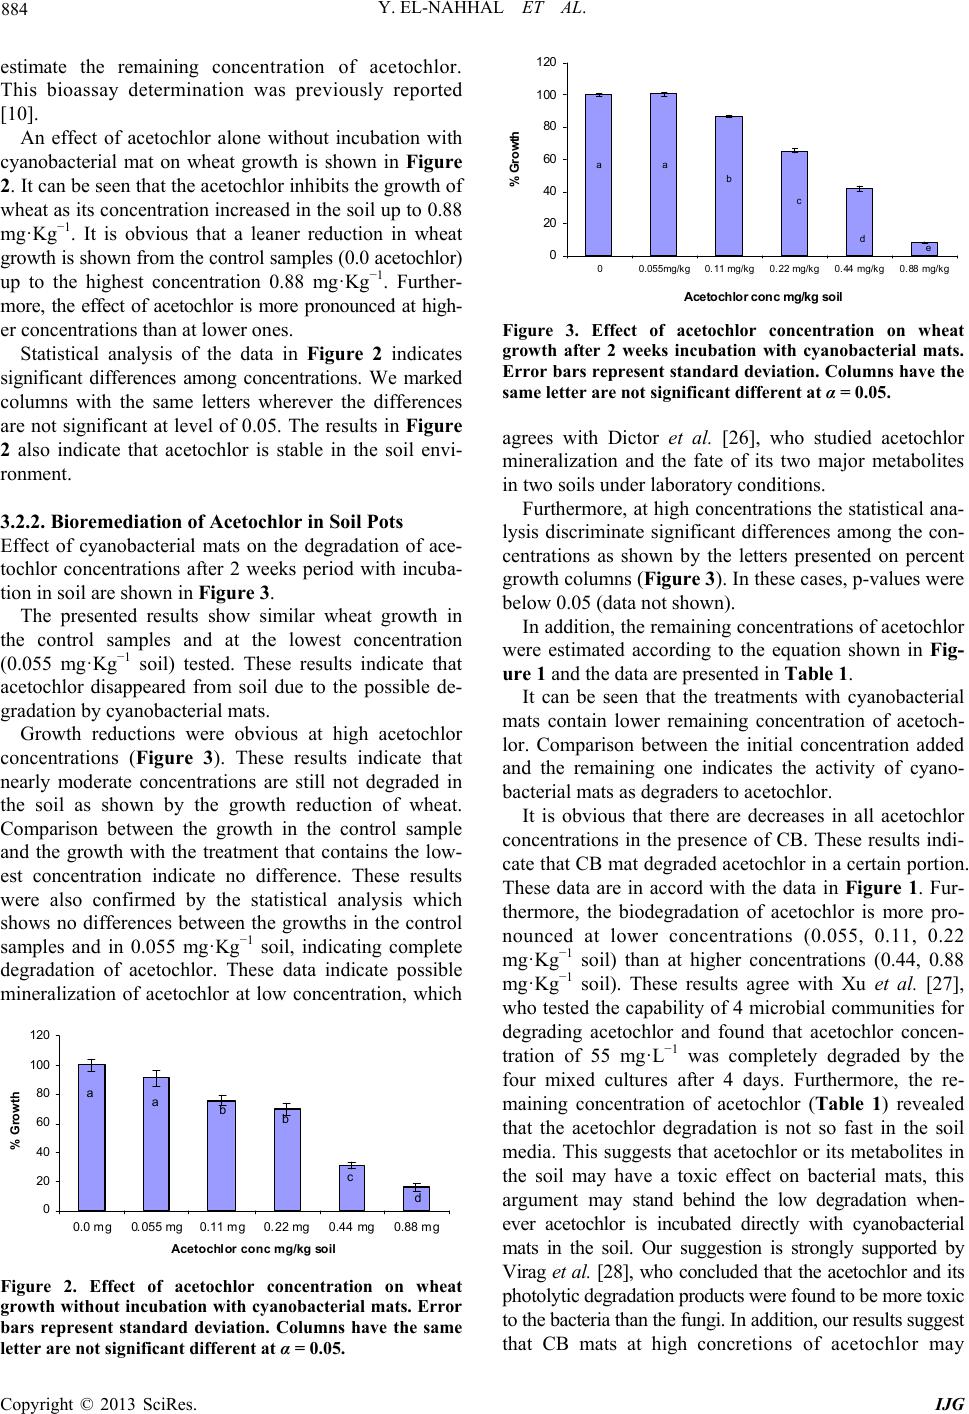 Y. EL-NAHHAL ET AL. 884 estimate the remaining concentration of acetochlor. This bioassay determination was previously reported [10]. 0 20 40 60 80 100 120 00.055mg/k g0. 11 mg/kg0. 22 mg/kg0. 44 mg/k g0.88 mg/k g Acetochlor conc mg/kg soil % Growt h aa b c de An effect of acetochlor alone without incubation with cyanobacterial mat on wheat growth is shown in Figure 2. It can be seen that the acetochlor inhibits the growth of wheat as its concentration increased in the soil up to 0.88 mg·Kg−1. It is obvious that a leaner reduction in wheat growth is shown from the control samples (0.0 acetochlor) up to the highest concentration 0.88 mg·Kg−1. Further- more, the effect of acetochlor is more pronounced at high- er concentrations than at lower ones. Statistical analysis of the data in Figure 2 indicates significant differences among concentrations. We marked columns with the same letters wherever the differences are not significant at level of 0.05. The results in Figure 2 also indicate that acetochlor is stable in the soil envi- ronment. 3.2.2. Bioremediation of Acetochlor in Soil Pots Effect of cyanobacterial mats on the degradation of ace- tochlor concentrations after 2 weeks period with incuba- tion in soil are shown in Figure 3. The presented results show similar wheat growth in the control samples and at the lowest concentration (0.055 mg·Kg−1 soil) tested. These results indicate that acetochlor disappeared from soil due to the possible de- gradation by cyanobacterial mats. Growth reductions were obvious at high acetochlor concentrations (Figure 3). These results indicate that nearly moderate concentrations are still not degraded in the soil as shown by the growth reduction of wheat. Comparison between the growth in the control sample and the growth with the treatment that contains the low- est concentration indicate no difference. These results were also confirmed by the statistical analysis which shows no differences between the growths in the control samples and in 0.055 mg·Kg−1 soil, indicating complete degradation of acetochlor. These data indicate possible mineralization of acetochlor at low concentration, which 0 20 40 60 80 100 120 0.0 mg0.055 mg0.11 mg0.22 mg0.44 Acetochlor conc mg/kg soil % Growth a abb c mg0.88 mg d Figure 2. Effect of acetochlor concentration on wheat growth without incubation with cyanobacterial mats. Error bars represent standard deviation. Columns have the same letter are not significant different at α = 0.05. Figure 3. Effect of acetochlor concentration on wheat growth after 2 weeks incubation with cyanobacterial mats. Error bars represent standard deviation. Columns have the same letter are not significant different at α = 0.05. agrees with Dictor et al. [26], who studied acetochlor mineralization and the fate of its two major metabolites in two soils under laboratory conditions. Furthermore, at high concentrations the statistical ana- lysis discriminate significant differences among the con- centrations as shown by the letters presented on percent growth columns (Figure 3). In these cases, p-values were below 0.05 (data not shown). In addition, the remaining concentrations of acetochlor were estimated according to the equation shown in Fig- ure 1 and the data are presented in Table 1. It can be seen that the treatments with cyanobacterial mats contain lower remaining concentration of acetoch- lor. Comparison between the initial concentration added and the remaining one indicates the activity of cyano- bacterial mats as degraders to acetochlor. It is obvious that there are decreases in all acetochlor concentrations in the presence of CB. These results indi- cate that CB mat degraded acetochlor in a certain portion. These data are in accord with the data in Figure 1. Fur- thermore, the biodegradation of acetochlor is more pro- nounced at lower concentrations (0.055, 0.11, 0.22 mg·Kg−1 soil) than at higher concentrations (0.44, 0.88 mg·Kg−1 soil). These results agree with Xu et al. [27], who tested the capability of 4 microbial communities for degrading acetochlor and found that acetochlor concen- tration of 55 mg·L−1 was completely degraded by the four mixed cultures after 4 days. Furthermore, the re- maining concentration of acetochlor (Table 1) revealed that the acetochlor degradation is not so fast in the soil media. This suggests that acetochlor or its metabolites in the soil may have a toxic effect on bacterial mats, this argument may stand behind the low degradation when- ever acetochlor is incubated directly with cyanobacterial mats in the soil. Our suggestion is strongly supported by Virag et al. [28], who concluded that the acetochlor and its photolytic degradation products were found to be more toxic to the bacteria than the fungi. In addition, our results suggest that CB mats at high concretions of acetochlor may Copyright © 2013 SciRes. IJG 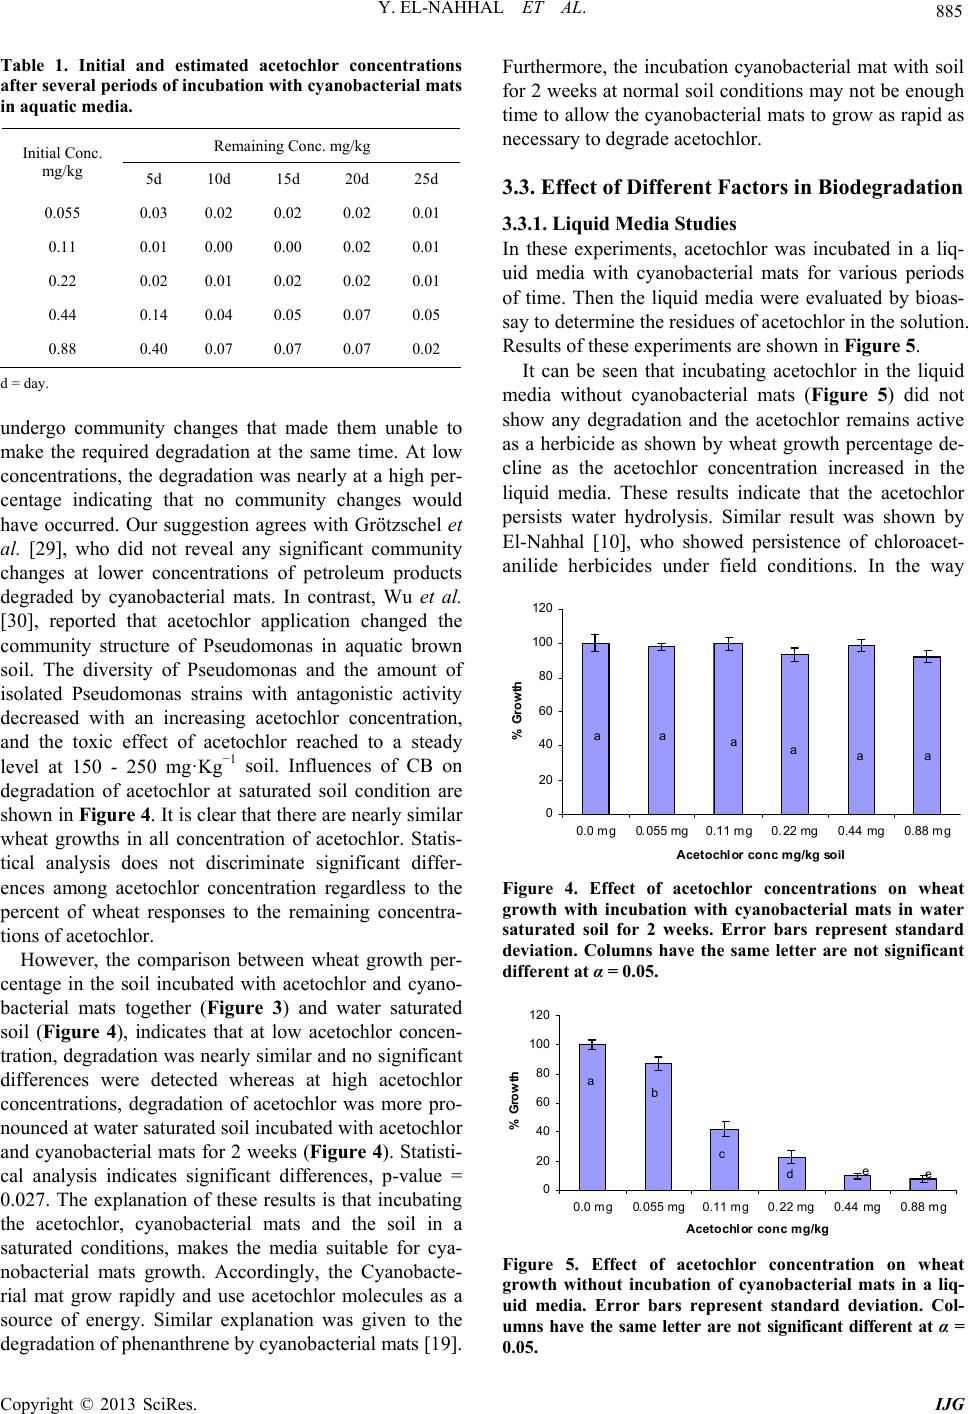 Y. EL-NAHHAL ET AL. 885 Table 1. Initial and estimated acetochlor concentrations after several periods of incubation with cyanobacterial mats in aquatic media. Remaining Conc. mg/kg Initial Conc. mg/kg 5d 10d 15d 20d 25d 0.055 0.03 0.02 0.02 0.02 0.01 0.11 0.01 0.00 0.00 0.02 0.01 0.22 0.02 0.01 0.02 0.02 0.01 0.44 0.14 0.04 0.05 0.07 0.05 0.88 0.40 0.07 0.07 0.07 0.02 d = day. undergo community changes that made them unable to make the required degradation at the same time. At low concentrations, the degradation was nearly at a high per- centage indicating that no community changes would have occurred. Our suggestion agrees with Grötzschel et al. [29], who did not reveal any significant community changes at lower concentrations of petroleum products degraded by cyanobacterial mats. In contrast, Wu et al. [30], reported that acetochlor application changed the community structure of Pseudomonas in aquatic brown soil. The diversity of Pseudomonas and the amount of isolated Pseudomonas strains with antagonistic activity decreased with an increasing acetochlor concentration, and the toxic effect of acetochlor reached to a steady level at 150 - 250 mg·Kg−1 soil. Influences of CB on degradation of acetochlor at saturated soil condition are shown in Figure 4. It is clear that there are nearly similar wheat growths in all concentration of acetochlor. Statis- tical analysis does not discriminate significant differ- ences among acetochlor concentration regardless to the percent of wheat responses to the remaining concentra- tions of acetochlor. However, the comparison between wheat growth per- centage in the soil incubated with acetochlor and cyano- bacterial mats together (Figure 3) and water saturated soil (Figure 4), indicates that at low acetochlor concen- tration, degradation was nearly similar and no significant differences were detected whereas at high acetochlor concentrations, degradation of acetochlor was more pro- nounced at water saturated soil incubated with acetochlor and cyanobacterial mats for 2 weeks (Figure 4). Statisti- cal analysis indicates significant differences, p-value = 0.027. The explanation of these results is that incubating the acetochlor, cyanobacterial mats and the soil in a saturated conditions, makes the media suitable for cya- nobacterial mats growth. Accordingly, the Cyanobacte- rial mat grow rapidly and use acetochlor molecules as a source of energy. Similar explanation was given to the degradation of phenanthrene by cyanobacterial mats [19]. Furthermore, the incubation cyanobacterial mat with soil for 2 weeks at normal soil conditions may not be enough time to allow the cyanobacterial mats to grow as rapid as necessary to degrade acetochlor. 3.3. Effect of Different Factors in Biodegradation 3.3.1. Liquid Media Studies In these experiments, acetochlor was incubated in a liq- uid media with cyanobacterial mats for various periods of time. Then the liquid media were evaluated by bioas- say to determine the residues of acetochlor in the solution. Results of these experiments are shown in Figure 5. It can be seen that incubating acetochlor in the liquid media without cyanobacterial mats (Figure 5) did not show any degradation and the acetochlor remains active as a herbicide as shown by wheat growth percentage de- cline as the acetochlor concentration increased in the liquid media. These results indicate that the acetochlor persists water hydrolysis. Similar result was shown by El-Nahhal [10], who showed persistence of chloroacet- anilide herbicides under field conditions. In the way 0 20 40 60 80 100 120 0.0 mg0.055 mg0.11 mg0.22 mg0.44 mg0.88 mg Acetochlor conc mg/kg soil % Growth aa aaaa Figure 4. Effect of acetochlor concentrations on wheat growth with incubation with cyanobacterial mats in water saturated soil for 2 weeks. Error bars represent standard deviation. Columns have the same letter are not significant different at α = 0.05. 0 20 40 60 80 100 120 0.0 mg0.055 mg0.11 mg0.22 mg0.44 mg0.88 mg Acetochlor conc mg/kg % Growth ab c dee Figure 5. Effect of acetochlor concentration on wheat growth without incubation of cyanobacterial mats in a liq- uid media. Error bars represent standard deviation. Col- umns have the same letter are not significant different at α = 0.05. Copyright © 2013 SciRes. IJG 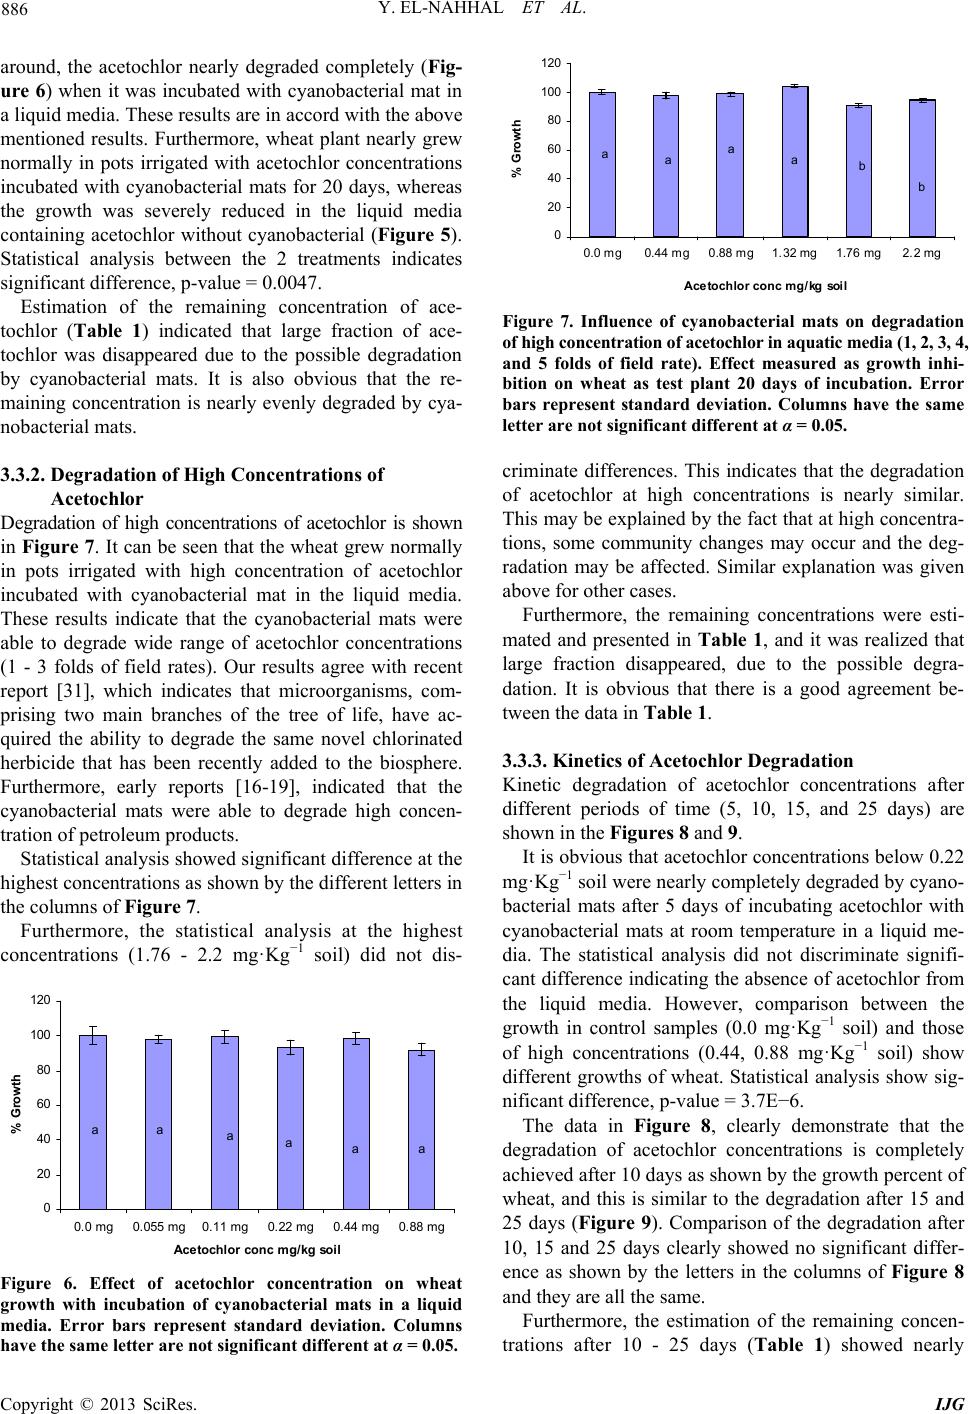 Y. EL-NAHHAL ET AL. 886 around, the acetochlor nearly degraded completely (Fig- ure 6) when it was incubated with cyanobacterial mat in a liquid media. These results are in accord with the above mentioned results. Furthermore, wheat plant nearly grew normally in pots irrigated with acetochlor concentrations incubated with cyanobacterial mats for 20 days, whereas the growth was severely reduced in the liquid media containing acetochlor without cyanobacterial (Figure 5). Statistical analysis between the 2 treatments indicates significant difference, p-value = 0.0047. 0 20 40 60 80 100 120 0.0 mg0.44 mg0.88 mg1.32 mg1.76 mg2.2 mg Acetochlor conc mg/kg soil % Growth aaaab b Estimation of the remaining concentration of ace- tochlor (Table 1) indicated that large fraction of ace- tochlor was disappeared due to the possible degradation by cyanobacterial mats. It is also obvious that the re- maining concentration is nearly evenly degraded by cya- nobacterial mats. 3.3.2. Degra d ation of High Concentra ti o ns of Acetochlor Degradation of high concentrations of acetochlor is shown in Figure 7. It can be seen that the wheat grew normally in pots irrigated with high concentration of acetochlor incubated with cyanobacterial mat in the liquid media. These results indicate that the cyanobacterial mats were able to degrade wide range of acetochlor concentrations (1 - 3 folds of field rates). Our results agree with recent report [31], which indicates that microorganisms, com- prising two main branches of the tree of life, have ac- quired the ability to degrade the same novel chlorinated herbicide that has been recently added to the biosphere. Furthermore, early reports [16-19], indicated that the cyanobacterial mats were able to degrade high concen- tration of petroleum products. Statistical analysis showed significant difference at the highest concentrations as shown by the different letters in the columns of Figure 7. Furthermore, the statistical analysis at the highest concentrations (1.76 - 2.2 mg·Kg−1 soil) did not dis- 0 20 40 60 80 100 120 0. 0 m g0.055 mg0.11 m g0.22 mg0. Ace tochlor conc mg/ kg soil % Growth aa aa 44 mg0.88 mg aa Figure 6. Effect of acetochlor concentration on wheat growth with incubation of cyanobacterial mats in a liquid media. Error bars represent standard deviation. Columns have the same letter are not significant different at α = 0.05. Figure 7. Influence of cyanobacterial mats on degradation of high concentration of acetochlor in aquatic media (1, 2, 3, 4, and 5 folds of field rate). Effect measured as growth inhi- bition on wheat as test plant 20 days of incubation. Error bars represent standard deviation. Columns have the same letter are not significant different at α = 0.05. criminate differences. This indicates that the degradation of acetochlor at high concentrations is nearly similar. This may be explained by the fact that at high concentra- tions, some community changes may occur and the deg- radation may be affected. Similar explanation was given above for other cases. Furthermore, the remaining concentrations were esti- mated and presented in Table 1, and it was realized that large fraction disappeared, due to the possible degra- dation. It is obvious that there is a good agreement be- tween the data in Table 1. 3.3.3. Kinetics of Acetochlor Degradation Kinetic degradation of acetochlor concentrations after different periods of time (5, 10, 15, and 25 days) are shown in the Figures 8 and 9. It is obvious that acetochlor concentrations below 0.22 mg·Kg−1 soil were nearly completely degraded by cyano- bacterial mats after 5 days of incubating acetochlor with cyanobacterial mats at room temperature in a liquid me- dia. The statistical analysis did not discriminate signifi- cant difference indicating the absence of acetochlor from the liquid media. However, comparison between the growth in control samples (0.0 mg·Kg−1 soil) and those of high concentrations (0.44, 0.88 mg·Kg−1 soil) show different growths of wheat. Statistical analysis show sig- nificant difference, p-value = 3.7E−6. The data in Figure 8, clearly demonstrate that the degradation of acetochlor concentrations is completely achieved after 10 days as shown by the growth percent of wheat, and this is similar to the degradation after 15 and 25 days (Figure 9). Comparison of the degradation after 10, 15 and 25 days clearly showed no significant differ- ence as shown by the letters in the columns of Figure 8 and they are all the same. Furthermore, the estimation of the remaining concen- trations after 10 - 25 days (Table 1) showed nearly Copyright © 2013 SciRes. IJG 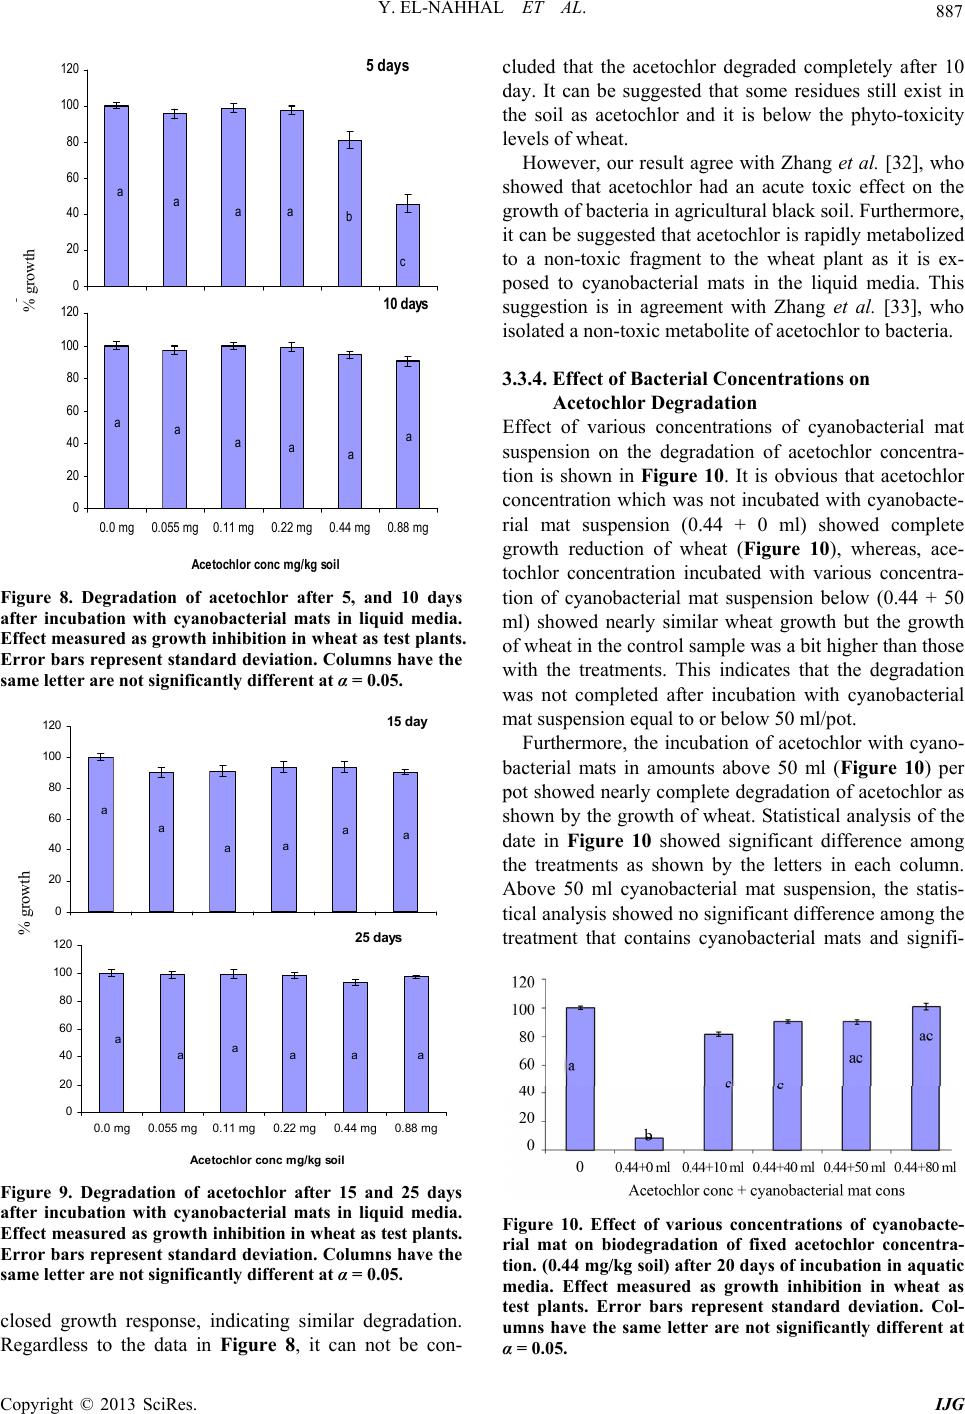 Y. EL-NAHHAL ET AL. 887 0 20 40 60 80 100 120 aaaa b c 5 day s 0 20 40 60 80 100 120 0.0 m g0.055 m g0. 11 mg0.22 m g0. Ace tochlor conc mg/ kg soil aaaa 44 mg0.88 m g aa 10 days % growth Figure 8. Degradation of acetochlor after 5, and 10 days after incubation with cyanobacterial mats in liquid media. Effect measured as growth inhibition in wheat as test plants. Error bars represent standard deviation. Columns have the same letter are not significantly different at α = 0.05. 0 20 40 60 80 100 120 a a aaaa 15 day 0 20 40 60 80 100 120 0. 0 m g0. 055 m g0. 11 m g0. 22 m g0 Ace tochlor conc m g/ kg soi a aa . 44 m g0. 88 m g l aa a 25 days % growth Figure 9. Degradation of acetochlor after 15 and 25 days after incubation with cyanobacterial mats in liquid media. Effect measured as growth inhibition in wheat as test plants. Error bars represent standard deviation. Columns have the same letter are not significantly different at α = 0.05. closed growth response, indicating similar degradation. Regardless to the data in Figure 8, it can not be con- cluded that the acetochlor degraded completely after 10 day. It can be suggested that some residues still exist in the soil as acetochlor and it is below the phyto-toxicity levels of wheat. However, our result agree with Zhang et al. [32], who showed that acetochlor had an acute toxic effect on the growth of bacteria in agricultural black soil. Furthermore, it can be suggested that acetochlor is rapidly metabolized to a non-toxic fragment to the wheat plant as it is ex- posed to cyanobacterial mats in the liquid media. This suggestion is in agreement with Zhang et al. [33], who isolated a non-toxic metabolite of acetochlor to bacteria. 3.3.4. Effect of Bacterial Concentrations on Acetochlor Degradation Effect of various concentrations of cyanobacterial mat suspension on the degradation of acetochlor concentra- tion is shown in Figure 10. It is obvious that acetochlor concentration which was not incubated with cyanobacte- rial mat suspension (0.44 + 0 ml) showed complete growth reduction of wheat (Figure 10), whereas, ace- tochlor concentration incubated with various concentra- tion of cyanobacterial mat suspension below (0.44 + 50 ml) showed nearly similar wheat growth but the growth of wheat in the control sample was a bit higher than those with the treatments. This indicates that the degradation was not completed after incubation with cyanobacterial mat suspension equal to or below 50 ml/pot. Furthermore, the incubation of acetochlor with cyano- bacterial mats in amounts above 50 ml (Figure 10) per pot showed nearly complete degradation of acetochlor as shown by the growth of wheat. Statistical analysis of the date in Figure 10 showed significant difference among the treatments as shown by the letters in each column. Above 50 ml cyanobacterial mat suspension, the statis- tical analysis showed no significant difference among the treatment that contains cyanobacterial mats and signifi- Figure 10. Effect of various concentrations of cyanobacte- rial mat on biodegradation of fixed acetochlor concentra- tion. (0.44 mg/kg soil) after 20 days of incubation in aquatic media. Effect measured as growth inhibition in wheat as test plants. Error bars represent standard deviation. Col- umns have the same letter are not significantly different at α = 0.05. Copyright © 2013 SciRes. IJG 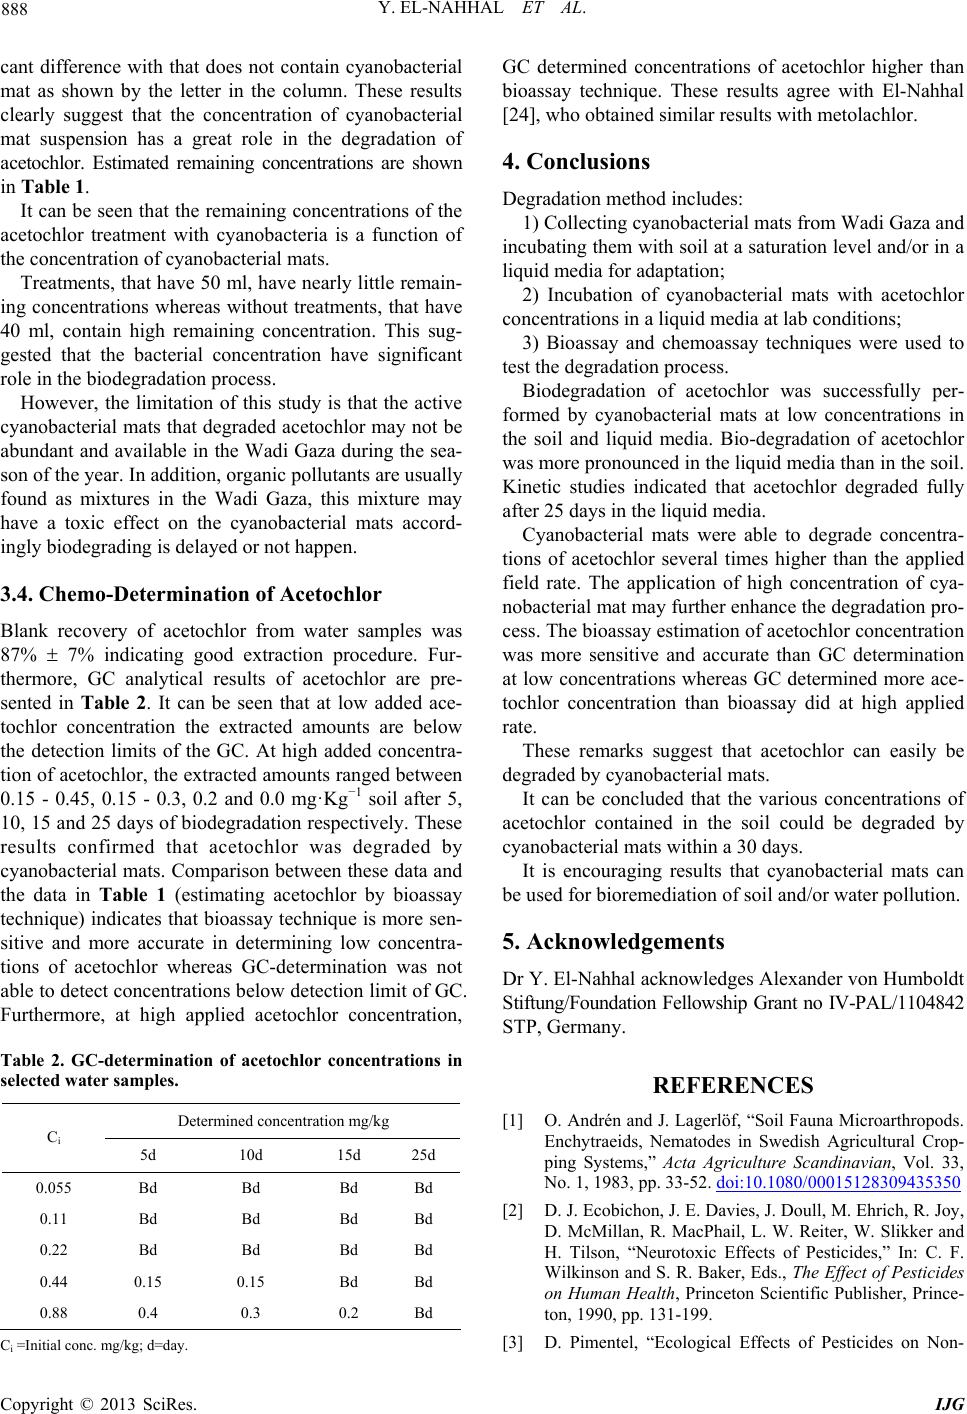 Y. EL-NAHHAL ET AL. 888 cant difference with that does not contain cyanobacterial mat as shown by the letter in the column. These results clearly suggest that the concentration of cyanobacterial mat suspension has a great role in the degradation of acetochlor. Estimated remaining concentrations are shown in Table 1. It can be seen that the remaining concentrations of the acetochlor treatment with cyanobacteria is a function of the concentration of cyanobacterial mats. Treatments, that have 50 ml, have nearly little remain- ing concentrations whereas without treatments, that have 40 ml, contain high remaining concentration. This sug- gested that the bacterial concentration have significant role in the biodegradation process. However, the limitation of this study is that the active cyanobacterial mats that degraded acetochlor may not be abundant and available in the Wadi Gaza during the sea- son of the year. In addition, organic pollutants are usually found as mixtures in the Wadi Gaza, this mixture may have a toxic effect on the cyanobacterial mats accord- ingly biodegrading is delayed or not happen. 3.4. Chemo-Determination of Acetochlor Blank recovery of acetochlor from water samples was 87% 7% indicating good extraction procedure. Fur- thermore, GC analytical results of acetochlor are pre- sented in Table 2. It can be seen that at low added ace- tochlor concentration the extracted amounts are below the detection limits of the GC. At high added concentra- tion of acetochlor, the extracted amounts ranged between 0.15 - 0.45, 0.15 - 0.3, 0.2 and 0.0 mg·Kg−1 soil after 5, 10, 15 and 25 days of biodegradation respectively. These results confirmed that acetochlor was degraded by cyanobacterial mats. Comparison between these data and the data in Table 1 (estimating acetochlor by bioassay technique) indicates that bioassay technique is more sen- sitive and more accurate in determining low concentra- tions of acetochlor whereas GC-determination was not able to detect concentrations below detection limit of GC. Furthermore, at high applied acetochlor concentration, Table 2. GC-determination of acetochlor concentrations in selected water sa mp les. Determined concentration mg/kg Ci 5d 10d 15d 25d 0.055 Bd Bd Bd Bd 0.11 Bd Bd Bd Bd 0.22 Bd Bd Bd Bd 0.44 0.15 0.15 Bd Bd 0.88 0.4 0.3 0.2 Bd Ci =Initial conc. mg/kg; d=day. GC determined concentrations of acetochlor higher than bioassay technique. These results agree with El-Nahhal [24], who obtained similar results with metolachlor. 4. Conclusions Degradation method includes: 1) Collecting cyanobacterial mats from Wadi Gaza and incubating them with soil at a saturation level and/or in a liquid media for adaptation; 2) Incubation of cyanobacterial mats with acetochlor concentrations in a liquid media at lab conditions; 3) Bioassay and chemoassay techniques were used to test the degradation process. Biodegradation of acetochlor was successfully per- formed by cyanobacterial mats at low concentrations in the soil and liquid media. Bio-degradation of acetochlor was more pronounced in the liquid media than in the soil. Kinetic studies indicated that acetochlor degraded fully after 25 days in the liquid media. Cyanobacterial mats were able to degrade concentra- tions of acetochlor several times higher than the applied field rate. The application of high concentration of cya- nobacterial mat may further enhance the degradation pro- cess. The bioassay estimation of acetochlor concentration was more sensitive and accurate than GC determination at low concentrations whereas GC determined more ace- tochlor concentration than bioassay did at high applied rate. These remarks suggest that acetochlor can easily be degraded by cyanobacterial mats. It can be concluded that the various concentrations of acetochlor contained in the soil could be degraded by cyanobacterial mats within a 30 days. It is encouraging results that cyanobacterial mats can be used for bioremediation of soil and/or water pollution. 5. Acknowledgements Dr Y. El-Nahhal acknowledges Alexander von Humboldt Stiftung/Foundation Fellowship Grant no IV-PAL/1104842 STP, Germany. REFERENCES [1] O. Andrén and J. Lagerlöf, “Soil Fauna Microarthropods. Enchytraeids, Nematodes in Swedish Agricultural Crop- ping Systems,” Acta Agriculture Scandinavian, Vol. 33, No. 1, 1983, pp. 33-52. doi:10.1080/00015128309435350 [2] D. J. Ecobichon, J. E. Davies, J. Doull, M. Ehrich, R. Joy, D. McMillan, R. MacPhail, L. W. Reiter, W. Slikker and H. Tilson, “Neurotoxic Effects of Pesticides,” In: C. F. Wilkinson and S. R. Baker, Eds., The Effect of Pesticides on Human Health, Princeton Scientific Publisher, Prince- ton, 1990, pp. 131-199. [3] D. Pimentel, “Ecological Effects of Pesticides on Non- Copyright © 2013 SciRes. IJG  Y. EL-NAHHAL ET AL. 889 Target Species in Terrestrial Ecosystems,” In: R. G. Tar- diff, Ed., SCOPE 49: Methods to Assess Adverse Effects of Pesticides on Non-Target Organisms, John Wiley & Sons, Toronto, 1992, pp. 171-190. [4] Environmental Protection Agency, “Questions and An- swers, Conditional Registration of Acetochlor,” US En- vironmental Protection Agency, Washington DC, 1994. [5] D. W. Kolpin, B. K. Nations, D. A. Goolsby and E. M. Thur- man, “Acetochlor in the Hydrologic System in the Mid- western United States,” Environmental Science and Tech- nology, Vol. 30, No. 5, 1996, pp. 1459-1464. doi:10.1021/es9503241 [6] A. William, D. Battaglin, W. Kolpin, A. Elizabeth, K. Scrib- ner, M. Kuivila and W. Mark, “Glyphosate, Other Herbi- cides, and Transformation Products in Midwestern Streams, 20021,” Journal of American Water Research Association, Vol. 41, No. 2, 2005, pp. 323-329. doi:10.1111/j.1752-1688.2005.tb03738.x [7] J. Gilliom, E. Barbash, G. Crawford, A. Hamilton, D. Martin, N. Nakagaki, H. Nowell, C. Scott, E. Stackelberg, P. Thelin and M. Wolock, “Pesticides in the Nation’s Streams and Ground Water, 1992-2001,” The Quality of Our Nation’s Waters, Series Number 1291, USGS, 2006. [8] Y. El-Nahhal, S. Nir, S. Serban, O. Rabinowitz and B. Ru- bin, “Organoclay Formulation of Acetochlor for Reduced Movement in Soil,” Journal of Agricultural and Food Chemistry, Vol. 49, No. 11, 2001, pp. 5464-5371. doi:10.1021/jf010561p [9] M. Balinova, “Acetochlor-a Comparative Study on Pa- rameters Governing the Potential for Water Pollution,” Journal of Environmental Science and Health, Part B, Vol. 32, No. 5, 1997, pp. 645-658. [10] Y. El-Nahhal, “Persistence, Mobility, Efficacy and Safety of Chloroacetanilide Herbicide Formulation under Field Conditions,” Environmental Pollution, Vol. 124, No. 1, 2003, pp. 33-38. doi:10.1016/S0269-7491(02)00431-1 [11] L. N. Konda and Z. S. Pasztor, “Environmental Distribu- tion of Acetochlor, Atrazine, Chlorpyrifos and Propi- sochlor under Field Conditions,” Journal of Agricultural and Food Chemistry, Vol. 49, No. 8, 2001, pp. 3859-3863. doi:10.1021/jf010187t [12] P. M. Hurley, R. N. Hill and R. J. Whiting, “Mode of Carcinogenic Action of Pesticides Inducing Thyroid Fol- licular Cell Tumors in Rodents,” Environmental Health Perspective, Vol. 106, No. 8, 1998, pp. 437-446. doi:10.1289/ehp.98106437 [13] P. J. Deirickx, “Glutathione-Dependent Cytotoxicity of The Chloroacetanilide Herbicides Alachlor, Metolachlor, and Propachlor in Rat and Human Hepatoma-Derived Cultured Cells,” Cell Biology and Toxicology, Vol. 15, No. 5, 1999, pp. 325-332. doi:10.1023/A:1007619919336 [14] K. L. Dearfield, N. E. Mc Carroll, A. Protzel, H. F. Stack, M. A. Jackson and M. D. Waters, “A Survey of EPA/OPP and Open Literature on Selected Pesticide Chemicals II. Mutagenicity and Carcinogenicity of Selected Chloroa- cetanilides and Related Compounds,” Mutation Research, Vol. 443, No. 1-2, 1999, pp. 183-221. doi:10.1016/S1383-5742(99)00019-8 [15] United States Environment Protection Agency, “Ace- tochlor: Fifth Report of the Cancer Assessment Review Committee,” OPP Official Record, Health Effect Division, Scientific Data Reviews, EPA, Washington DC, 2007. [16] R. M. M. Abed, N. M. D. Safi, J. Koster, D. de Beer, Y. El-Nahhal, J. Rullkotter and F. Garcia-Pichel, “Microbial Diversity of a Heavily Polluted Microbial Mat and Its Community Changes Following Degradation of Petro- leum Compounds,” Applied Environmental Microbiology, Vol. 68, No. 4, 2002, pp. 1674-1683. doi:10.1128/AEM.68.4.1674-1683.2002 [17] N. Safi, J. Koster and J. Rulkotter, “Fossil Fuel Pollution in Wadi Gaza and Biodegradation of Petroleum Model Com- pounds by Cyanobacterial Mats,” The 36th Congress of the International Commission for the Scientific Exploration of the Mediterranean Sea, Monaco, 2001, p. 209. [18] N. Safi, N. Lee, J. Koster, J. Safi, Y. El-Nahhal, M. Wag- ner and J. Rullkotter, “Biodegradation of Petroleum Mo- dle Compounds by in Mesocosm Experiments in Gaza (Palestine),” 21st International Meeting on Organic Geo- chemistry, Krakow, 8-12 September 2003, pp. 138-139. [19] N. Safi, “Environment Organic Geochemistry of Sedi- ments from Wadi Gaza and Investigation of Bioremedia- tion of Petroleum Derivatives and Herbicides by Cyano- bacterial Mats under Different Experimental Conditions,” Ph.D. Thesis, Carl von Ossietzky Universitat, Oldenburg, 2004 [20] C. D. Tomlin, “The Pesticide Manual,” British Crop Pro- tection Council, Farnham, 2000. [21] Y. El-Nahhal, S. Nir, T. Polubesova and L. Margulies, “Rubin B. Leaching, Phytotoxicity and Weed Control of New Formulations of Alachlor,” Journal of Agricultural and Food Chemistry, Vol. 46, No. 8, 1998, pp. 3305-3313. doi:10.1021/jf971062k [22] W. H. Paerl, F. T. Steppe, C. K. Buchan and M. Potts, “Hy- persaline Cyanobacterial Mats as Indicators of Elevated Tropical Hurricane Activity and Associated Climate Change,” Ambio, Vol. 32, No. 2, 2003, pp. 87-90. [23] J. Ma, R. Zheng, L. Xu and S. Wang, “Differential Sensi- Tivity of Two Green Alga Scenedesmus obliqnus and Chlorella pyrenoidosa to 12 Pesticides,” Ecotoxicology and Environmental Safety, Vol. 52, No. 1, 2002, pp. 57- 61. doi:10.1006/eesa.2002.2146 [24] Y. El-Nahhal, “Leaching Behavior of Metolachlor in Soil,” Journal of Environmental Engineering and Science, Vol. 3, No. 3, 2004, pp. 187-194. doi:10.1139/s03-075 [25] Y. El-Nahhal, G. Lagaly and O. Rabinovitz, “Organo- Clay Formulations of Acetochlor: Effect of High Salt,” Journal of Agricultural and Food Chemistry, Vol. 53, No. 5, 2005, pp. 1620-1624. doi:10.1021/jf040383a [26] M. Dictor, N. Baran, A. Gautier and C. Mouvet, “Ace- tochlor Mineralization and Fate of Its Two Major Me- tabolites in Two Soils under Laboratory Conditions,” Che- mosphere, Vol. 71, No. 4, 2008, pp. 663-670. doi:10.1016/j.chemosphere.2007.10.066 [27] J. Xu, M. Yang, J. Dai, H. Cao, C. Pan, X. Qiu and M. Xu, “Degradation of Acetochlor by Four Microbial Commu- nities,” Bio-Resource Technology, Vol. 99, No. 16, 2008, pp. 7797-7802. doi:10.1016/j.biortech.2008.01.060 Copyright © 2013 SciRes. IJG  Y. EL-NAHHAL ET AL. Copyright © 2013 SciRes. IJG 890 [28] D. Virág, Z. Naár and A. Kiss, “Microbial Toxicity of Pesticide Derivatives Produced with UV-Photodegrada- tion,” Bulletin of Environmental Contamination and Toxi- cology, Vol. 79, No. 3, 2007, pp. 356-359. doi:10.1007/s00128-007-9230-7 [29] S. Grotzschel, J. Koster, R. M. Abed and D. de Beer, “De- gradation of Petroleum Model Compounds Immobilized on Clay by a Hypersaline Microbial Mat,” Biodegrada- tion, Vol. 13, No. 4, 2002, pp. 273-283. doi:10.1023/A:1021263009377 [30] M. Wu, X. Zhang, H. Zhang, Y. Zhang, X. Li, Q. Zhou and C. Zhang, “Soil Pseudomonas Community Structure and Its Antagonism towards Rhizoctonia solani under the Stress of Acetochlor,” Bulletin of Environmental Con- tamination and Toxicology, Vol. 83, No. 3, 2009, pp. 313- 317. [31] A. Munoz, W. C. Koskinen, L. Cox and M. J. Sadowsky, “Biodegradation and Mineralization of Metolachlor and Alachlor by Candida xestobii,” Journal of Agricultural and Food Chemistry, Vol. 59, No. 2, 2011, pp. 619-627. doi:10.1021/jf103508w [32] H. W. Zhang, Q. X. Zhou, Q. R. Zhang and C. G. Zhang, “Soil Pseudomonas Community Structure and Its An- tagonism towards Rhizoctonia solani under the Stress of Acetochlor,” Bulletin of Environmental Contamination and Toxicology, Vol. 83, No. 3, 2009, pp. 313-317. doi:10.1007/s00128-009-9731-7 [33] J. Zhang, J. W. Zheng, B. Liang, C. H. Wang, S. Cai, Y. Y. Ni, J. He and S. P. Li, “Biodegradation of Chloro- Acetamide Herbicides by Paracoccus sp. FLY-8 in Vitro,” Journal of Agricultural and Food Chemistry, Vol. 59, No. 9, 2011, pp. 4614-4621. doi:10.1021/jf104695g
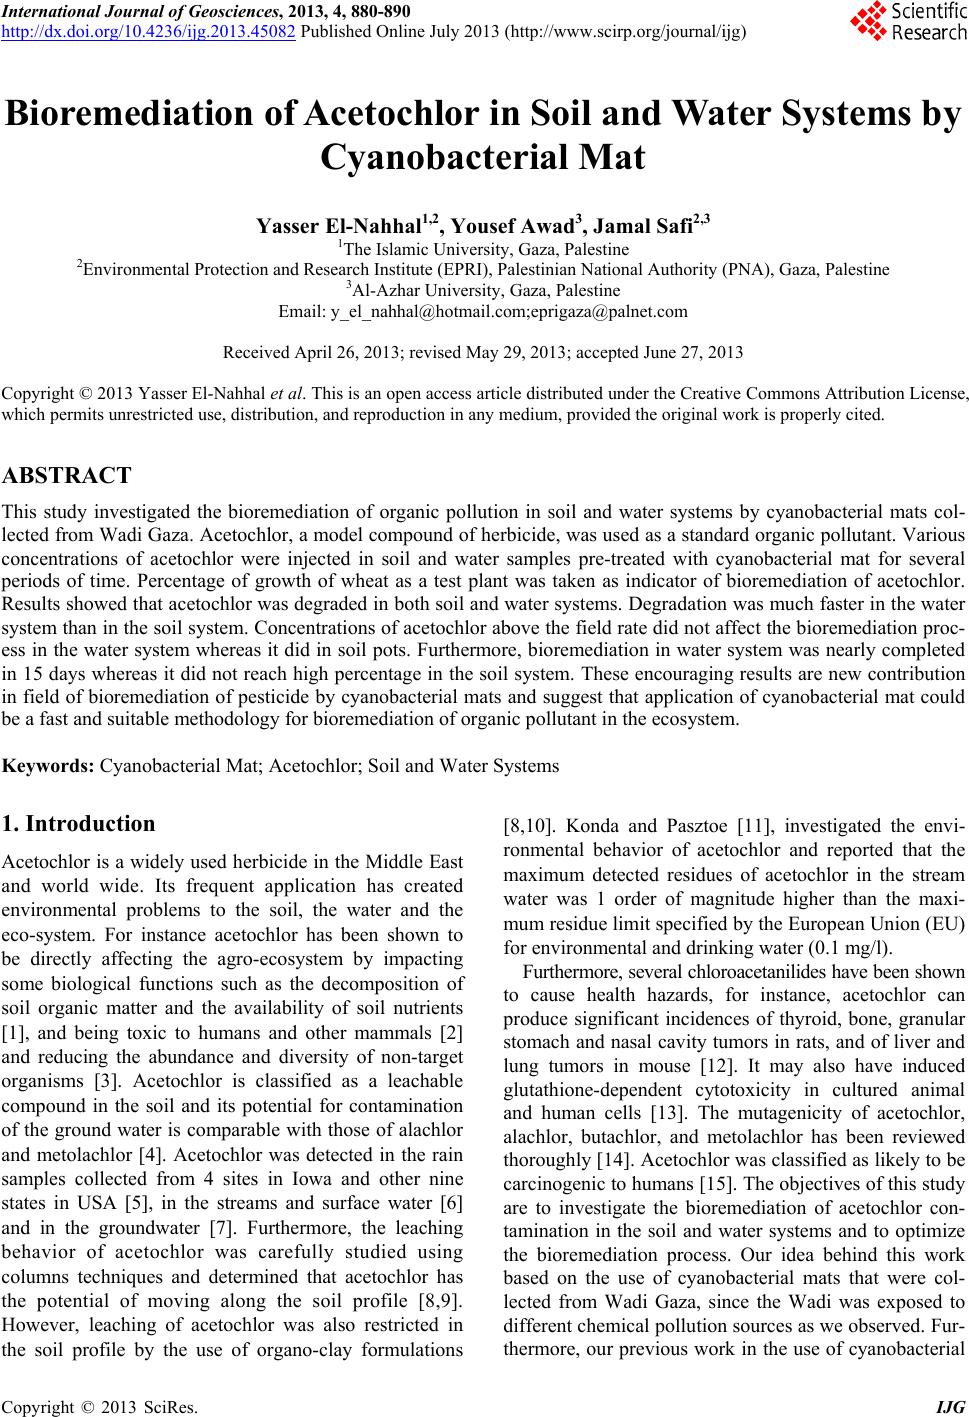
|