Open Journal of Metal, 2013, 3, 21-25
http://dx.doi.org/10.4236/ojmetal.2013.32A1003 Published Online July 2013 (http://www.scirp.org/journal/ojmetal)
XRF Analysis of Heavy Metals for Surface Soil of Qarun
Lake and Wadi El Rayan in Faiyum, Egypt
Samia M. El-Bahi1, Amany T. Sroor1, Najat F. Arhoma2, Saher M. Darwish2*
1Nuclear Physics Laboratory, Faculty of Girls, Ain Shams University, Heliopolis, Egypt
2Physics Department, Faculty of Science, Cairo University, Giza, Egypt
Email: *saherm2001@yahoo.com
Received April 22, 2013; revised May 25, 2013; accepted June 5, 2013
Copyright © 2013 Samia M. El-Bahi et al. This is an open access article distributed under the Creative Commons Attribution License,
which permits unrestricted use, distribution, and reproduction in any medium, provided the original work is properly cited.
ABSTRACT
The environmental pollution with some heavy metals for twenty four surface soil samples collected from Qarun Lake
and Wadi El Rayan region in Faiyum, Egypt u tilizing X-ray fluorescence (XRF) spectroscopy was measured. The con-
centrations of 13 elements Cr, Ni, Cu, Zn, Zr, Rb, Y, Ba, Pb, Sr, Ga, V and Nb were determined. The elemental concen-
trations were compared with the normal values and other studies in different locations from the world. The correlation
between elements appears that pollu tion inside the investigated lake and Wadi result from different sources of contami-
nation present inside them. The results establish a database reference of radioactivity background levels around these
regions.
Keywords: XRF; Heavy Metals; Surface Soil; Faiyum
1. Introduction
Studying the levels of radionuclide distribution in the
environment provides essential radiological information
[1-4]. As a resu lt of rapid urbanization and indu strial de-
velopment, heavy metal contamination has been threat-
ening human health [5]. A soil pollution assessment be-
comes very complex when different sources of contami-
nation are present and their products are variably distr ib-
uted. In these cases, the spatial variability of heavy metal
concentrations in soils is basic information for identify-
ing the possible sources of contamination and to deline-
ate the strategies of site remediation.
The present study aims to assess the heavy metal con-
tamination for surface soil of Qarun Lake and Wadi El
Rayan regions in Faiyum, Egypt.
2. Material and Methods
Soil samples are collected from Qarun Lake and Wadi El
Rayan in El Faiyum, middle Egypt, as shown in Figure 1.
El Faiyum located 130 km southwest of Cairo. Qarun
Lake is a closed saline lake, located in the deepest part of
El Faiyum depression at the western desert, 70 km south
Cairo-Egypt between longitudes 30˚24' & 30˚49'E and
latitudes of 29˚24' & 29˚33'N. It has an area of about
200 km2. It is used as a reservoir for the drainage water
of El Faiyum province [6]. Qarun Lake water level is cur-
rently about 44 m below mean sea level [7]. The valley
of Wadi El Rayan stretches on an area of 1759 km2.
About 65 km southwest of El Faiyum city and 80 km
west of the Nile River. The reserve is composed of: A
50.90 km2-upper lake, 62.00 km2-lower lake, waterfalls
between the two lakes. Wadi El Rayan waterfalls con-
sidered to be the largest waterfalls in Egypt. This region
suffers from complex problems of pollution as a resu lt of
the high salinity in the water and presence of sewage,
agricultural drainage flows inside it [8].
Twenty four surface soil samples, twelve from Qarun
Lake (Q1 to Q12) and Twelve from Wadi El Rayan (W1 to
W12), were collected from different locations along 12
kilometer, where the distance between each successive
samples about one kilometer. The soil samples were dried,
homogenized and sieved at 200 mesh grain size, pressed
powder pellets were prepared by filling an alumina cup,
(diameter 4 cm, height 1.2 cm and weight 3 gm), with 9
gm of crystalline boric acid covered by 1 gm of the
grounded sample, and then pressed under 12 tons by using
semi-autom atic hydraulic pre ss model HER ZOG HTP-40.
To avoid trace elements contaminations, the powdered
samples were subjected to complete chemic al analysis in
the laboratories of Nuclear Materials Authority, Cairo
*Corresponding a uthor.
C
opyright © 2013 SciRes. OJMetal
S. M. EL-BAHI ET AL.
22
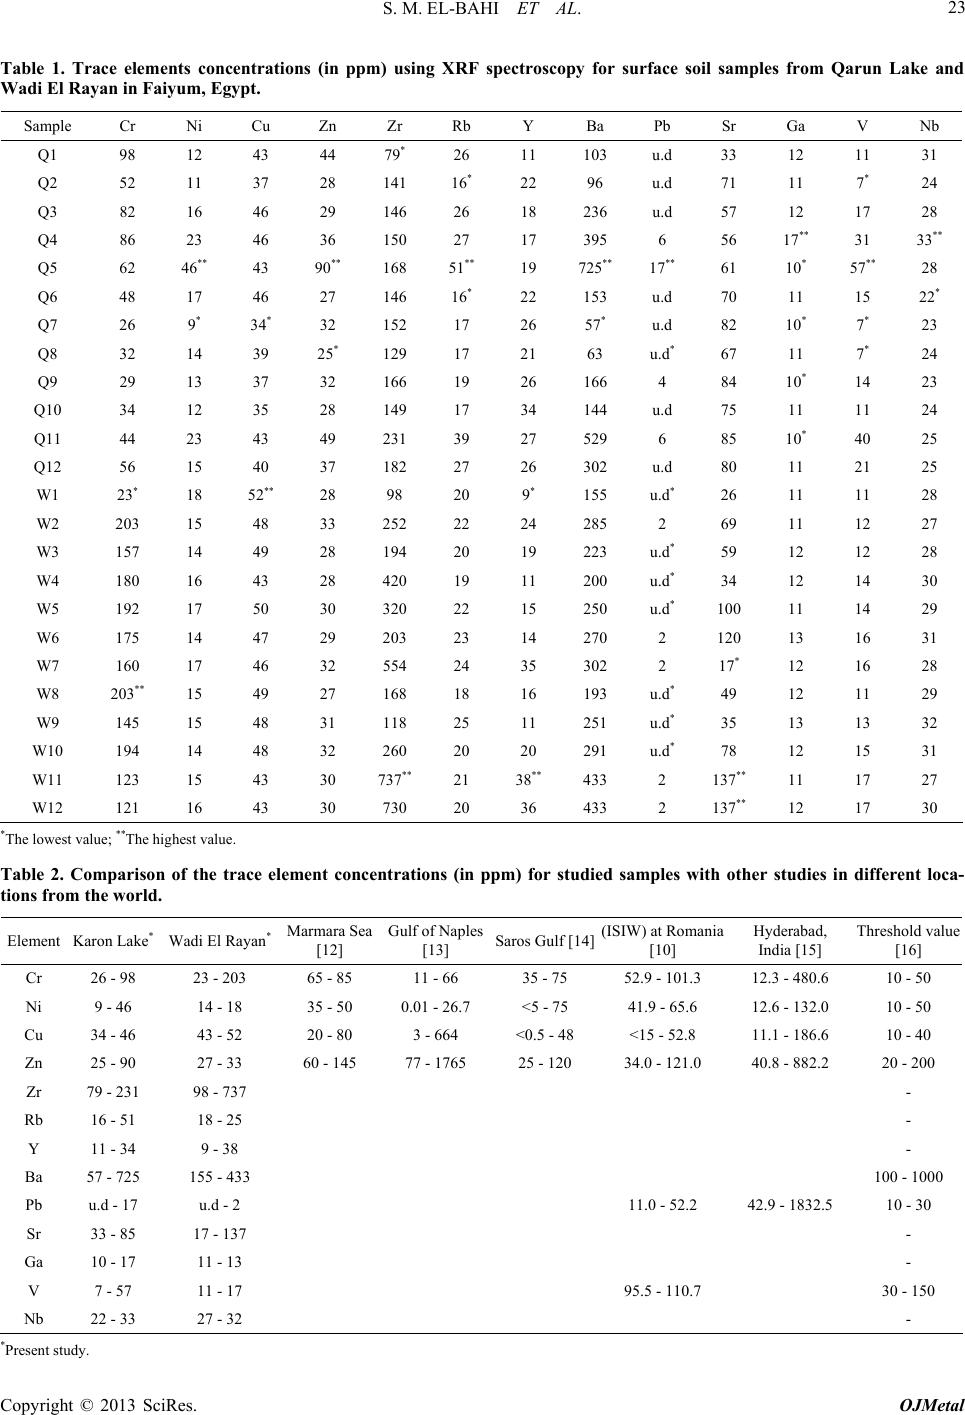
Figure 1. Map of the geology of Faiyum indicating location
of Qarun Lake, Wadi El-Rayan and the Faiy um depression,
showing elevations in meters w.r.t. mean sea level.
Egypt, using the wet chemical analyses for the major
oxides and XRD to analyze the trace elements.
Trace elemental analysis of samples by X-Ray fluo-
rescence were performed using a Philips PW X-Unique
II X-ray spectrometer with automatic sample changer
PW 1510, (30 positions) at the Nuclear Materials Au-
thority, Cairo, Egypt. This instrument is connected to a
computer system using X-40 program for spectrometry.
The trace elements concentrations are calculated from the
program’s calibration curves which were set up accord-
ing to international reference materials, (standards), as
NIM-G, G-2, GSP-1, AGV-1, JB-1 and NIM-D. The
trace elements were measured by calibrating the system
under the conditions of Rh-target tube, LiF-420 crystal,
gas flow proportional counter, (GFPC), coarse collima-
tors, vacuum, 30 kV and 40 mA for the determination of
V, Cr, Co, Ni, Cu, Zn and Ga, 70 kV and 15 mA, for Rb,
Sr, Y, Zr and Nb and 100 kV and 10 mA for the deter-
mination of Ba and Pb. The detection limit is the lowest
concentration, and it is function of the level of back-
ground noise relative to an element signal [9]. The detec-
tion limit for the elements measured by XRF technique is
estimated at 2 ppm for Rb, Nb, Ga, Co, Y and Sr and at 8
ppm for Pb and Cu and 5 ppm for other measured trace
elements.
3. Results and Discussion
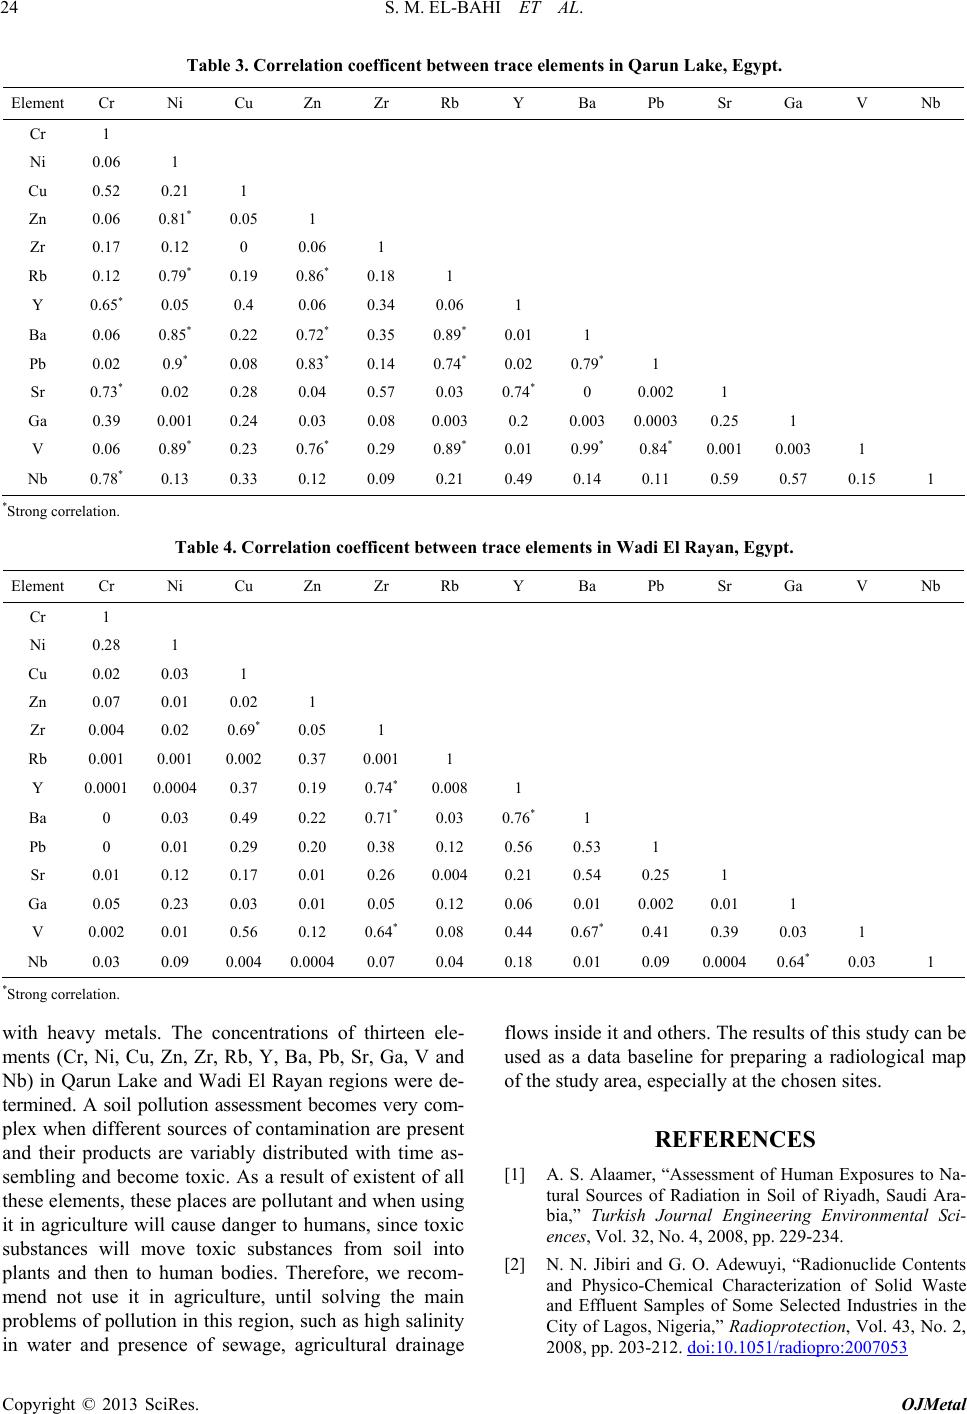
XRF results for collected surface soil samples from Qa-
run Lake and Wadi El Rayan regions evident the exis-
tence of the following elements: Cr, Ni, Cu, Zn, Zr, Rb,
Y, Ba, Pb, Sr, Ga, V and Nb , shown in Tab le 1 . It can be
seen that Cr and Cu concentrations for all studied sites
are greater than the normal values 30 and 20 mg/kg, re-
spectively, while the Ni, Zn, Pb and V concentrations are
lower than the normal values 20, 100, 20 and 50, respec-
tively [10] for all studied sites except site Q5 at Qarun
Lake recorded high concentrations for Ni and V. It is
clear also that, samples have high concentration of Zr
and Nb which means a presence of uranium and thorium
in these samples. Also Sr has a great importance, since
90Sr is a radioactive isotope with a half-life of 28.78
years. Table 1 also shows that, all samples contain a high
concentration of Ba which can be separated using differ-
ent methods in order to use it in different important in-
dustries [11]. Barium sulfate is important to the petro-
leum industry. Barium oxide is used in a coating of the
electrodes of fluorescent lamps. Barium carbonate is used
in glass-making. Barium fluoride is used for optics in in-
frared applications. Barium, commonly as barium nitrate,
is used to give green colors in fireworks. Also, there are
other trace elements like Rb, Y and Ga with different
concentrations. A soil pollu tion assessment becomes very
complex when different sources of contamination are
present and their products are variably distributed [12].
Table 2 gives the comparison of trace element con-
centrations in present work with other reference data [10,
12-16]. It can be seen that the present concentrations of
Cr, Ni, Cu, Zn and Pb is lower than that (ISIW) in Ro-
mania [10] and Hyderabad city in India [15] and all these
concentrations exceeded threshold values [16]. Table 2
shows also that the present concentration of V is lower
than that of (ISIW) at Romania and the threshold value
[16]. Existences of all these elements with different val-
ues caused many diseases if reached to human bodies
[17]. For example, Cr caused carcinoma, Cu caused cir-
rhosis, nausea, vomiting and diarrhea, Ba high toxic sub-
stantive caused carcinoma, hypogonadism and diarrhea.
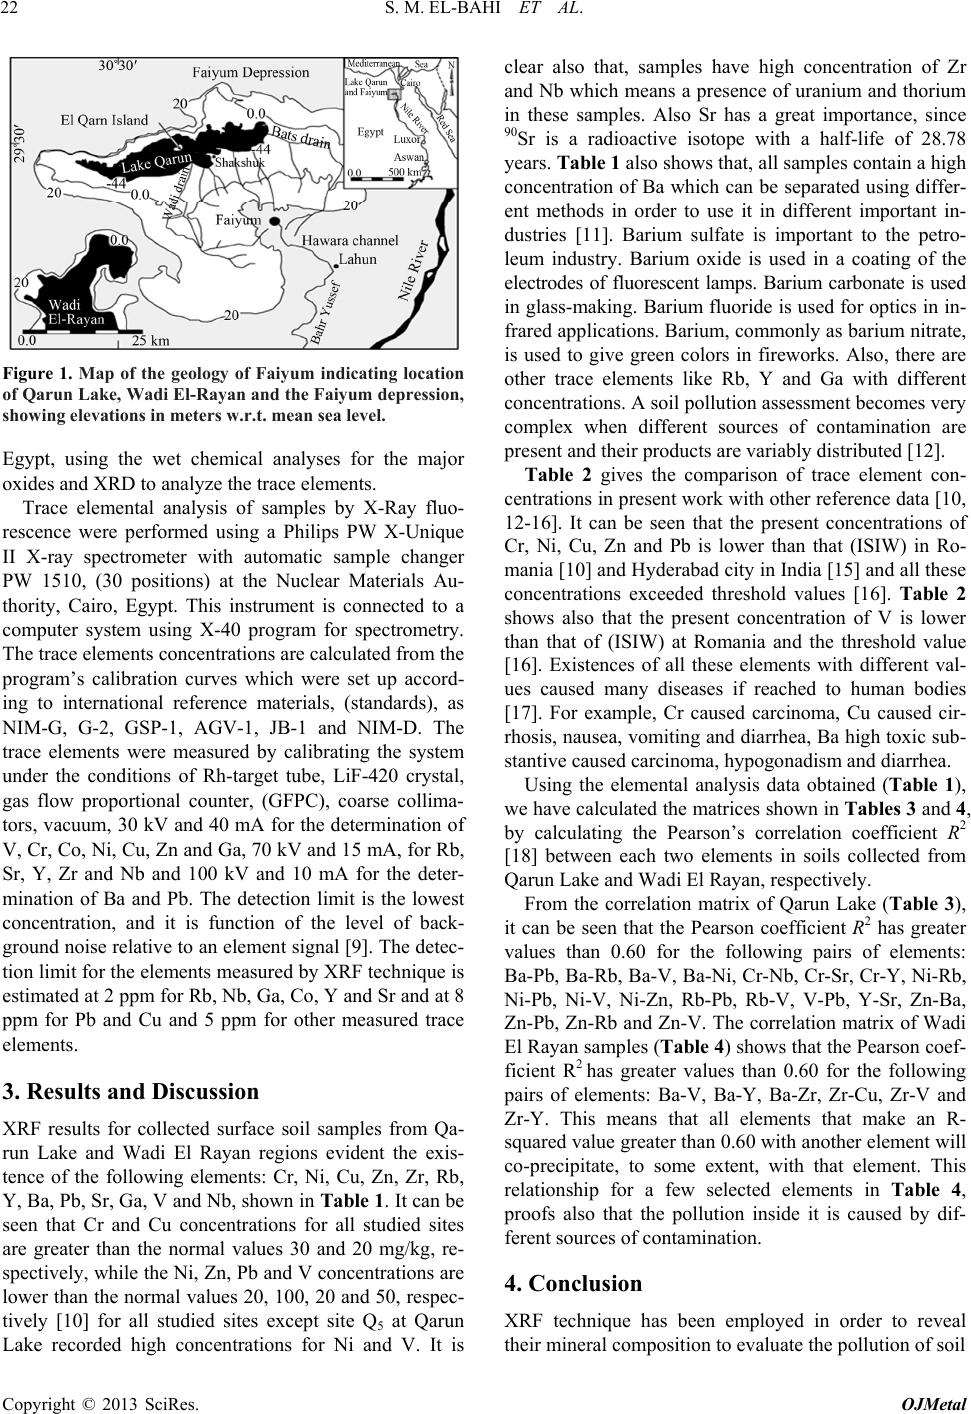
Using the elemental analysis data obtained (Table 1),
we have calculated the matrices shown in Table s 3 and 4,
by calculating the Pearson’s correlation coefficient R2
[18] between each two elements in soils collected from
Qarun Lake and Wadi El Rayan, respectively.
From the correlation matrix of Qarun Lake (Table 3),
it can be seen that the Pearson coefficient R2 has greater
values than 0.60 for the following pairs of elements:
Ba-Pb, Ba-Rb, Ba-V, Ba-Ni, Cr-Nb, Cr-Sr, Cr-Y, Ni-Rb,
Ni-Pb, Ni-V, Ni-Zn, Rb-Pb, Rb-V, V-Pb, Y-Sr, Zn-Ba,
Zn-Pb, Zn-Rb and Zn-V. The correlation matrix of Wadi
El Rayan samples (Table 4) shows that the Pearson coef-
ficient R2 has greater values than 0.60 for the following
pairs of elements: Ba-V, Ba-Y, Ba-Zr, Zr-Cu, Zr-V and
Zr-Y. This means that all elements that make an R-
squared value greater than 0.60 with another element will
co-precipitate, to some extent, with that element. This
relationship for a few selected elements in Table 4,
proofs also that the pollution inside it is caused by dif-
ferent sources of contamination.
4. Conclusion
XRF technique has been employed in order to reveal
their mineral composition to evaluate the pollution of soil
Copyright © 2013 SciRes. OJMetal
S. M. EL-BAHI ET AL.
Copyright © 2013 SciRes. OJMetal
23
Table 1. Trace elements concentrations (in ppm) using XRF spectroscopy for surface soil samples from Qarun Lake and
Wadi El Rayan in Faiyum, Egypt.
Sample Cr Ni Cu Zn Zr Rb Y Ba Pb Sr Ga V Nb
Q1 98 12 43 44 79* 26 11 103 u.d 33 12 11 31
Q2 52 11 37 28 141 16* 22 96 u.d 71 11 7* 24
Q3 82 16 46 29 146 26 18 236 u.d 57 12 17 28
Q4 86 23 46 36 150 27 17 395 6 56 17** 31 33**
Q5 62 46** 43 90** 168 51** 19 725** 17** 61 10* 57** 28
Q6 48 17 46 27 146 16* 22 153 u.d 70 11 15 22*
Q7 26 9* 34* 32 152 17 26 57* u.d 82 10* 7
* 23
Q8 32 14 39 25* 129 17 21 63 u.d* 67 11 7* 24
Q9 29 13 37 32 166 19 26 166 4 84 10* 14 23
Q10 34 12 35 28 149 17 34 144 u.d 75 11 11 24
Q11 44 23 43 49 231 39 27 529 6 85 10* 40 25
Q12 56 15 40 37 182 27 26 302 u.d 80 11 21 25
W1 23* 18 52** 28 98 20 9* 155 u.d* 26 11 11 28
W2 203 15 48 33 252 22 24 285 2 69 11 12 27
W3 157 14 49 28 194 20 19 223 u.d* 59 12 12 28
W4 180 16 43 28 420 19 11 200 u.d* 34 12 14 30
W5 192 17 50 30 320 22 15 250 u.d* 100 11 14 29
W6 175 14 47 29 203 23 14 270 2 120 13 16 31
W7 160 17 46 32 554 24 35 302 2 17* 12 16 28
W8 203** 15 49 27 168 18 16 193 u.d* 49 12 11 29
W9 145 15 48 31 118 25 11 251 u.d* 35 13 13 32
W10 194 14 48 32 260 20 20 291 u.d* 78 12 15 31
W11 123 15 43 30 737** 21 38** 433 2 137** 11 17 27
W12 121 16 43 30 730 20 36 433 2 137** 12 17 30
*The lowest value; **The highest value.
Table 2. Comparison of the trace element concentrations (in ppm) for studied samples with other studies in different loca-
tions from the world.
Element Karon Lake* Wadi El Rayan* Marmara Sea
[12] Gulf of Naples
[13] Saros Gulf [14] (ISIW) at Romania
[10] Hyderabad,
India [15] Threshold value
[16]
Cr 26 - 98 23 - 203 65 - 85 11 - 66 35 - 75 52. 9 - 101.3 12.3 - 480.6 10 - 50
Ni 9 - 46 14 - 18 35 - 50 0.01 - 26.7 <5 - 75 41.9 - 65.6 12.6 - 132.0 10 - 50
Cu 34 - 46 43 - 52 20 - 80 3 - 664 <0.5 - 48 <15 - 52.8 11.1 - 186.6 10 - 40
Zn 25 - 90 27 - 33 60 - 145 77 - 1765 25 - 120 34.0 - 121.0 40.8 - 882.2 20 - 200
Zr 79 - 231 98 - 737 -
Rb 16 - 51 18 - 25 -
Y 11 - 34 9 - 38 -
Ba 57 - 725 155 - 433 100 - 1000
Pb u.d - 17 u.d - 2 11.0 - 52.2 42.9 - 1832.5 10 - 30
Sr 33 - 85 17 - 137 -
Ga 10 - 17 11 - 13 -
V 7 - 57 11 - 17 95.5 - 110.7 30 - 150
Nb 22 - 33 27 - 32 -
*Present study.
S. M. EL-BAHI ET AL.
24
Table 3. Correlation coefficent between trace elements in Qarun Lake, Egypt.
Element Cr Ni Cu Zn Zr Rb Y Ba Pb Sr Ga V Nb
Cr 1
Ni 0.06 1
Cu 0.52 0.21 1
Zn 0.06 0.81* 0.05 1
Zr 0.17 0.12 0 0.06 1
Rb 0.12 0.79* 0.19 0.86* 0.18 1
Y 0.65* 0.05 0.4 0.06 0.34 0.06 1
Ba 0.06 0.85* 0.22 0.72* 0.35 0.89* 0.01 1
Pb 0.02 0.9* 0.08 0.83* 0.14 0.74* 0.02 0.79* 1
Sr 0.73* 0.02 0.28 0.04 0.57 0.03 0.74* 0 0.002 1
Ga 0.39 0.001 0.24 0.03 0.08 0.003 0.2 0.003 0.0003 0.25 1
V 0.06 0.89* 0.23 0.76* 0.29 0.89* 0.01 0.99* 0.84* 0.001 0.003 1
Nb 0.78* 0.13 0.33 0.12 0.09 0.21 0.49 0.14 0.11 0.59 0.57 0.15 1
*Strong corr elation.
Table 4. Correlation coefficent between trace elements in Wadi El Rayan, Egypt.
Element Cr Ni Cu Zn Zr Rb Y Ba Pb Sr Ga V Nb
Cr 1
Ni 0.28 1
Cu 0.02 0.03 1
Zn 0.07 0.01 0.02 1
Zr 0.004 0.02 0.69* 0.05 1
Rb 0.001 0.001 0.002 0.37 0.001 1
Y 0.0001 0.0004 0.37 0.19 0.74* 0.008 1
Ba 0 0.03 0.49 0.22 0.71* 0.03 0.76* 1
Pb 0 0.01 0.29 0.20 0.38 0.12 0.56 0.53 1
Sr 0.01 0.12 0.17 0.01 0.26 0.004 0.21 0.54 0.25 1
Ga 0.05 0.23 0.03 0.01 0.05 0.12 0.06 0.01 0.002 0.01 1
V 0.002 0.01 0.56 0.12 0.64* 0.08 0.44 0.67* 0.41 0.39 0.03 1
Nb 0.03 0.09 0.004 0.0004 0.07 0.04 0.18 0.01 0.09 0.0004 0.64* 0.03 1
*Strong corr elation.
with heavy metals. The concentrations of thirteen ele-
ments (Cr, Ni, Cu, Zn, Zr, Rb, Y, Ba, Pb, Sr, Ga, V and
Nb) in Qarun Lake and Wadi El Rayan regions were de-
termined. A soil pollution assessment becomes very com-
plex when different sources of contamination are present
and their products are variably distributed with time as-
sembling and become toxic. As a result of existent of all
these elements, these places are pollutant and when using
it in agriculture will cause danger to humans, since toxic
substances will move toxic substances from soil into
plants and then to human bodies. Therefore, we recom-
mend not use it in agriculture, until solving the main
problems of pollutio n in this region, su ch as high salinity
in water and presence of sewage, agricultural drainage
flows inside it and others. The results of this study can be
used as a data baseline for preparing a radiological map
of the study area, especially at the chosen sites.
REFERENCES
[1] A. S. Alaamer, “Assessment of Human Exposures to Na-
tural Sources of Radiation in Soil of Riyadh, Saudi Ara-
bia,” Turkish Journal Engineering Environmental Sci-
ences, Vol. 32, No. 4, 2008, pp. 229-234.
[2] N. N. Jibiri and G. O. Adewuyi, “Radionuclide Contents
and Physico-Chemical Characterization of Solid Waste
and Effluent Samples of Some Selected Industries in the
City of Lagos, Nigeria,” Radiopro tect ion, Vol. 43, No. 2,
2008, pp. 203-212. doi:10.1051/radiopro:2007053
Copyright © 2013 SciRes. OJMetal
S. M. EL-BAHI ET AL. 25
[3] B. Palumbo, M. Angelone and A. Bellanca, “Influence of
Inheritance and Pedogenesis on Heavy Metal Distribution
in Soils of Sicily, Italy,” Geoderma, Vol. 95, No. 3, 2000,
pp. 247-266. doi:10.1016/S0016-7061(99)00090-7
[4] UNSCEAR, “Sources, Effect and Risk of Ionizing Radia-
tion,” United Nations, New York, 2000.
[5] V. Salonen and K. Korkka-Niemi, “Influence of Parent
Sediments on the Concentration of Heavy Metals in Ur-
ban and Suburban Soils in Turku,” Finland Applied Eo-
chemistry, Vol. 22, No. 5, 2007, pp. 906-918.
[6] A. A. A. Mageed, “Effect of Some Environmental Factors
on the Biodiversity of Holozooplankton Community in
Lake Qarun, Egypt,” Egyptian Journal of Aquatic Re-
search, Vol. 31, No. 2, 2005, pp. 230-234.
[7] A. H. Meshal, “The Problem of the Salinity Increase in
Lake Qarun (Egypt) and a Propose Solution,” Journal
Conceal International Pour lExploration de la Mer, Vol.
37, No. 2, 1977, pp. 137-143.
[8] P. J. Mehringer, K. L. Petersen and F. A. Hassan, “A
Pollen Record from Birket Qarun and the Recent History
of the Fayum, Egy pt, ” Quaternary Research, Vol. 11, No.
2, 1979, pp. 238-256. doi:10.1016/0033-5894(79)90006-1
[9] K. Norrish and B. W. Chappell, “X-Ray Fluorescence
Spectrography,” In: J. Zussman, Ed., Physical Methods of
Determinative Minerology, Academic press, New York,
1966, pp. 161-214.
[10] E. Antoaneta, A. Bosneaga and L. Georgescu, “Determi-
nation of Heavy Metals in Soils Using XRF Technique,”
Romanian Journal of Physics, Vol. 55, No. 7-8, 2009, pp.
815-820.
[11] J. Emsley, “Nature’s Building Blocks,” Oxford Univer-
sity Press, Oxford, 2001, pp. 506-510.
[12] S. Akyuz, T. Akyuz, A. O. Algan, N. M. Mukhamedshina
and A. A. Mirsagatova, “Energy Dispersive X-Ray Fluo-
rescence and Neutron Activation Analysis of Surficial Se-
diments of the Sea of Marmara and the Black Sea around
Istanbul,” Journal Radioanalytical and Nuclear Chemis-
try, Vol. 254, No. 8, 2002, pp. 569-575.
doi:10.1023/A:1021606608862
[13] E. Romano, A. Ausili, N. Zharova, M. C. Mango, B. Pa-
voni and M. Gabellini, “Marine Sediment Concentration
of an Industrial Site at Port of Bagnoli, Gulf of Naples,
Southern Italy,” Marine Pollution Bulletin, Vol. 49, No. 5,
2004, pp. 487-495. doi:10.1016/j.marpolbul.2004.03.014
[14] T. Akyuz, N. Mukhamedshina, S. Akyuz, E. Sari and A.
A. Mirsagatova, “Toxic and Trace Element Analysis of
Surface Sediments from theGulf of Saros by INAA and
XRF methods,” Radioanalytical and Nuclear Chemistry,
Vol. 273, No. 3, 2007, pp. 747-751.
doi:10.1007/s10967-007-0941-3
[15] N. N. Vandana Partha, Murthya and P. R. Saxena, “As-
sessment of Heavy Metal Contamination in Soil around
Hazardous Waste Disposal Sites in Hyderabad City (India)
Natural and Anthropogenic Implications,” Environmental
Research and Management, Vol. 2, No. 1, 2011, pp. 27-
34.
[16] D. C. Adriano, “Trace Elements in Terrestrial Environ-
ments,” Biogeochemistry, Bioavailability, and Risks of
Metals, 2nd Edition, Springer Verlag, New York, 2001.
[17] S. Martin and W. Griswold, “Human Health Effects of
Heavy Metals,” Center for Hazardous Substance Re-
search, Kansas State University, 2009.
www.engg.ksu.edu/CHSR/
[18] H. Lohninger, “Teach/Me-Data Analysis,” Springer-Ver-
lag, New York, 1999.
Copyright © 2013 SciRes. OJMetal