 Vol.4, No.5B, 141-147 (2013) Agricultural Sciences doi:10.4236/as.2013.45B026 Chemical characterization and antioxidative properties of Polish variety of Morus alba L. leaf aqueous extracts from the laboratory and pilot-scale processes Ewa Flaczyk1*, Joanna Kobus-Cisowska1, Monica Przeor1, Jozef Korczak1, Marian Remiszewski2, Eugeniusz Korbas2, Maciej Buchowski3 1Department of Food Service and Catering, Poznan University of Life Sciences, Wojska Polskiego, Poznan, Poland; *Corresponding Author: ewafla@up.poznan.pl 2Institute of Agricultural and Food Biotechnology Department of Food Concentrates and Starch Product, Starolecka, Poznan, Poland 3Vanderbilt University, Department of Medicine, Nashville, Tennessee, USA Received 2013 ABSTRACT White mulberry tree (Morus alba L) is cultivated throughout Asia and Europe, including Poland. The leaves and root bark preparations from Morus alba have been used in traditional phy- tomedicine. The objective of the present study was to compare chemical composition and an- tioxidative activity of aqueous extracts prepared from Polish variety of Morus alba leaves at the laboratory (L) and pilot plant scale (PP) condi- tions. Proximate composition, phenolic acids profile (HPLC/MS), flavonol glicosides (HPLC/ MS), polyphenols (Folin-Ciocalteu assay), and the antioxidant activity (ABTS and DPPH assay) of the extracts were determined. The main phe- nolic compounds were identified as gallic, pro- tocatechuic, p-hydroxybenzoic, vanillic, chloro- genic, caffeic, p-coumaric, ferulic, and sinapic acids. Chlorogenic acid was the main phenolic constituent of both extracts. The flavonols frac- tion contained rutin, quercetin 3-β-D-glucoside, and kaempferol 3-β-D- glucopyranoside. Total concentration of phenolic compounds were 7.9 g and 14.4 g gallic acid equivalent/100 g extract, and antioxidant activity was 137.1 and 214.1 μMol Trolox equivalent/g dry weight for the PP and L extracts, respectively. We concluded that current pilot plant process is less efficient than laboratory process at the aqueous extraction of bioactive components from Morus alba dried leaves. Potential improvements may include in- creasing efficacy of the extraction, decreasing losses of bioactive components during the process, or both. Keywords: Morus Alba Leaves; Pilot Plant Scale; Antioxidant Activity; Phenolic Acid; Flavonols; HPLC 1. INTRODUCTION White mulberry tree (Morus alba L.) is a deciduous tree originating from Asia but currently cultivated in subtropical, tropical, and moderate environments [1]. Morus alba is valued for its foliage traditionally used as feed for silk worms and have been shown to improve milk yield when fed to dairy cows [2,3]. Morus alba leaves contain proteins, carbohydrates, calcium, iron, ascorbic acid, β -carotene, thiamine, folic acid and vita- min D [4]. Morus alba tree bark, fruits, and leaves have been used also in both conventional and natural medicine and beneficial in the treatment of diabetes, atherosclero- sis, hyperlipidemia, hypertension, and more recently, some cancer and neurogenerative diseases. In Poland, a major cultivated variety is Morus alba L var. wielkolista zolwinska since it is the best adapted variety to local climate conditions. Typically, it is grown as a shrub from which leaves are harvested annually in July, dried, packaged, and sold as herbal teas. Previously, we have described the laboratory process of aqueous extraction of Morus alba leaves and young shoots dried at 30℃ - 60℃ and recommended specific technical and technological requirements for the pilot plant scale proc- ess [5]. The objective of this study was to compare chemical composition and antioxidant properties of extracts obtained at both laboratory and pilot scale processes. 2. MATERIALS AND METHODS 2.1. Preparation of the Morus Al ba Leaves and Extracts Morus alba L. var. wielkolistna zolwinska) leaves Copyright © 2013 SciRes. Openly accessible at http://www.scirp.org/journal/as/  E. Flaczyk et al. / Agricultural Sciences 4 (2013) 141-147 142 were collected in July 2011 from the experimental farm Petkowo (Institute of Natural Fibres and Medicinal Plants, Poznan, Poland). The leaves (50 kg) were dried at 30℃. The laboratory (L) extract samples were prepared by two-level extraction of 10 g of crude dried leaf powder (0.8 - 0.08 mm) mixed with 100 ml of bidistilled water (100℃) in a round-bottom flask for 5 min. and centri- fuged at 4,400 rpm and 20℃ for 3 min (Eppendorf Centrifuges 5702 R). The precipitate was transferred to a round bottom flask and extracted with 40 ml of bide- stilled water (100℃) and centrifuged under the same conditions. The supernatant was filtered through Whatman 1 filter paper and freeze-dried (Christ Alpha 1-4, LSC, Germany). The yield of the extraction was 25.55%. Pilot plant (PP) extract samples were prepared from dried and crushed Morus alba leaves mixed with water (80℃ - 90℃) by the counter-flow process (1:10 w/w) using continuous twin-screw extractor (IBPRS, Poznan, Poland). The extract was concentrated using a vacuum periodic spherical evaporator (WWA20, Spomasz, Pleszew, Poland), at 70℃ - 80℃ and pressure 0.6 - 0.8 atm (14.7 psi). The concentrated extract was air-dried in a spray dryer (SR16, Niro Atomizer, Denmark). Drying inlet and outlet temperatures were 180℃ - 90℃ and 90℃ - 95℃, respectively. The yield of the process was 21.61%. 2.2. Chemical Standards All chemicals were purchased from Sigma-Aldrich (Poznań, Poland). Chemical used were gallic acid (3, 4,5-tri-hydroxy benzoic acid), p-hydroxy-benzoic acid (4-hydroxy-benzoic acid), protocatechuic acid (3,4-di- hydroxy benzoic acid), vanillic acid (4-hydroxy-3-meth- oxybenzoic acid), caffeic acid (acid 3,4- dihydroxycin- namon acid) chlorogenic acid (5- O-caffeoylquinic acid), ferulic acid (4-hydroxy-3-methoxycinnamic acid), p-cou- maric acid (4-hydroxycinnamic acid), sinapic acid (acid, 4-hydroxy-3,5-dimetoxy cinnamon), quercetin (3,3',4', 5,7-pentahydroxyflavone), kaempferol (3,4',5,7-tetrahy- droxyflavone), myricetin (3,3' 4', 5,5',7-heksahy- droxsy- flavon), isoquercetin (3-O-glucoside, quercetin) hipero- side (3-O-galactoside quercetin), rutin (quercetin-3-O- rutinoside), astragalin (3-O-gluco pyranoside kaempferol), L-ascorbic acid (γ-lactoneendiol acid, 2-oxo-L- gulonic acid), 2,2-diphenyl-1-picryl hydrazyl• (DPPH•), 2,2'- azino-bis(3-ethylbenzothiazoline-6-sulfonic acid (ABTS+), 6-hydroxy 2,5,7,8-tetramethylchroman-2-carboxylic acid (Trolox). All chemicals were of HPLC-grade or analytic- cal grade purity. 3. METHODS 3.1. Proximate Composition The moisture, protein, lipids and ash of extracts were determined according to the AOAC methods [6]. 3.2. Reducing Sugars Qualitative and quantitative content of reducing sugars and sucrose was determined using a Waters Alliance HPLC® System 2695 (USA) with a refractometer detector (RI) Waters 2414 (Waters, USA) and an ion column (Rezex RPM-Monosaccharide Pb+2 [8%]; 300 × 7.80 mm; Phenomenex, Torrance, CA, USA). The separation and detection (an objective measurement of RI) temperature was 65℃ and 50℃, respectively. The separation of sam- ples (5 ml) was isocratic and deionized water (0.6 ml/ min) was used as an eluent. 3.3. Phenolic Acids Qualitative and quantitative analysis of phenolic acids were made by HPLC with Bin Pump Infinity DAD 1290 detector, at λ = 260 nm and 310 nm. The dry extract was dissolved in phase. A non-linear concentration gradient was used. The mobile phase utilized a gradient composed of H3PO4 buffer (solvent A) pH = 2.7 and was adjusted with 1:1 v/v acetonitrile-water (solvent B)).The gradient profile was decreasing smoothly from 95% of solvent A at 1 min to 50% of B at 52 min. Run time was 58 min. The volume of injected sample after filtration (PTFE filter; 0.45 μm) was 10 µl. The identification of phenolic acids was based on the analysis of standards dissolved in methanol (gallic, p-hydroxybenzoic, protocatechuic, va- nillic, caffeic, chlorogenic, ferulic acid, p-coumaric, and sinapic acid) as described by Kobus et al. [7]. Concen- tration of phenolic acids in samples were calculated us- ing internal standard. Results were expressed in micro- grams per gram of dry matter of extract. 3.4. Flavonols Qualitative and quantitative analysis of phenolic acids were made by HPLC with Bin Pump Infinity DAD 1290 detector, at λ = 370 nm. Flavonols were determined, after dissolving the dry extract in-phase column Zorbax SB C18 (3.9 × 150 mm, 5 um) (Agilent, USA). A non-linear concentration gradient was used. Solvent A was H3PO4 buffer (pH = 2.7), whereas solvent B was acetonitrile- water (1:1) using a flow rate of 1 ml / min. The gradient profile was decreasing smoothly from 95% of solvent A at 1 min to 20% of solvent B at 30 min. Run time was 37 min. The volume of injected sample was 10 µl. The identification of separated compounds was carried out by retention time mapping with a set of standards dissolved in methanol (rutin, quercetin-3-D-galactoside, quercetin galactoside, kaempferol 3-β-D-glucopyranoside, myricetin, kaempferol, and quercetin). Identification of individual flavonols was performed by comparing UV-VIS spectra and the retention time of flavonols in samples with the Copyright © 2013 SciRes. Openly accessible at http://www.scirp.org/journal/as/  E. Flaczyk et al. / Agricultural Sciences 4 (2013) 141-147 143 standard as described by Kobus et al. [7]. 3.5. Total Phenolics The total polyphenols content was determined by Folin-Ciocalteu’s reagent. The absorbance of samples was measured at a wavelength of 765nm with UV-VIS spectrophotometer (Jena). Gallic acid was the standard, and results were expressed in mg / g dry weight of the extract according to Cheung et al. [6]. 3.6. Ascorbic Acid HPLC technique was used for the separation and identification of ascorbic acid in the extracts (HPLC with Bin Pump Infinity DAD 1290 detector, Agilent, Germany). Separation was performed using Luna Phenomenex col- umn (4.6 × 250 mm; 5 µm; Phenomenex, Torrance, CA, USA. The mobile phase was a KH2PO4 (pH 5.0) dissolved in methanol. The gradient profile was decreas- ing smoothly from 95% of KH2PO4 solution at 1 min to 78% at 6 min. Run time was 10 min. The volume of injected sample was 20 µl. Ascorbic acid was identified using retention time mapping with ascorbic acid as internal standard. Ascorbic acid content was determined colorimetrically (λ = 245 mm) based on the calibration curve [8]. 3.7. Chelating Activity Chelating activity of the extracts was measured as de- scribed by Tang et al. [9]. The colorimetric assay in- volves determining the quantity of Fe2+ , which does not chelate with the extract and 3-(2-pyridyl)-5,6-bis (4- phenylsulfonic acid)-1,2,4-triazine mono sodium salt (i.e., ferrozine). A sample (1 mL) was mixed with 0.1 mL of 2 mM FeCl2 and 0.2 mL of ferrozine reagent in a test tube. The mixture was vortexed for ~60 s and incubated at room temperature for 20 min followed by measurements of absorbance at λ = 562 nm ( SPECORD® 40 (Analytik, Jena, Germany). Deionized water was used as a control and ferrozine as a reference standard. The chelating ac- tivity was calculated using the following equation: Che- lating activity = 1 - [(Abs. of sample – Abs. of refer- ence)/Abs. of control)] × 100. 3.8. Radical Scavenging Capacity Against DPPH The free-radical scavenging potentials of crude ex- tracts were tested in a methanolic solution of DPPH• as described by Amarowicz et al. [10]. The extent of dis- coloration of the solution indicates the scavenging effi- cacy of the added substance. A 1-mL aliquot of extract solution was combined with 2 mL of CH3OH and then 0.25 mL of a 1 mM ethanolic solution of DPPH•. The mixture was vortexed for ~60 s and incubated at room temperature for 20 min followed by measurements of absorbance at λ = 517 nm (SPECORD® 40, Analytik Jena, Germany). A reference sample was prepared with methanol instead of DPPH• and the control instead of the extract sample. To construct a calibration curve, absorb- ance of samples containing 0.5, 1.0, 1.5, and 2.0 mg/mL Trolox were measured simultaneously. Results were ex- pressed as µMol Trolox equivalents/g extract dry weight. Antioxidant activity was calculated as a percentage of DPPH• change in absorbance using the following equa- tion: Radical scavenging activity = 100 - [(Abs. of sample – Abs. of reference)/Abs. of control)] × 100 3.9. Total Antioxidant Capacity with ABTS+• The method of assessing the ability of inhibiting ABTS+• (2,2'-azinobis-3-ethylbenzo thiazoline-6-sul- fonate) is based on the spectrophotometric measurement of change in absorbance at λ = 734 nm. The ABTS+• solution was prepared 24 h earlier and incubated with the sample at 35℃ for 6 min. The extent of decolorization, expressed as percentage of absorbance inhibition of ABTS+• was calculated according to Re et al. [11]. % Inhibition = (Abs. of control – Abs. of sample) /Abs. of control * 100 Antioxidative status of the extracts is expressed in percentages and in Trolox equivalents (mM) Trolox/100 g dry extract. 3.10. Statistical Analysis All measurements were performed in six or more rep- lications. All results are means and standard deviations. The significance of differences between the means was determined at P ≤ 0.05, after applying a one-way analy- sis of variance (ANOVA) followed by Tukey’s multiple range test. All statistical analysis analyses were per- formed using SPPS v 17. SPSS, Chicago, IL, USA). 4. RESULTS AND DISCUSSION 4.1. Proximate Composition The total amount of protein, fat, sugars, and ash in the Morus alba leaf water extracts are shown in Table 1. The extract from pilot plant (PP) had lower concentration of protein, glucose and galactose than laboratory (L) extract. The PP extract had significantly higher than L extract concentration of saccharose (24.4 vs. 18.6 g/100g), but lower concentration of protein (12.7 vs. 14.7 g/100g). Both extracts have higher concentration of protein and ash than those in the Morus alba leaf ethanol extract reported by Nakamura et al [12]. The differences in protein, fat, ash, and sugar content Copyright © 2013 SciRes. Openly accessi ble at http://www.scirp.org/journal/as/  E. Flaczyk et al. / Agricultural Sciences 4 (2013) 141-147 144 between the PP and L extracts were most likely due to different conditions during the extraction and concentra- tion processes. Thus, it seems necessary to perform further tests and determine qualitative indicators necessary for optimization of extraction and/or concentration in the PP process. 4.2. Bioactive Compounds - Phenolic Acids Morus alba leaves are used in medicine mainly be- cause of high concentration of constituents with antioxi- dative activity such as phenolic compounds. Among phenolics, the highest antioxidative activity exhibit phe- nolic acids and flavonoids [13,14]. In our extracts, chlorogenic acid had the highest concentration among active compounds detected. The L extract contained ap- proximately double the amount of chlorogenic acid found in the PP extract (Table 2). A plausible explanation is that during the PP process, chlorogenic acid was con- verted to caffeic and/or chinoic acids. However, we did not find an increased concentration of caffeic acid in the final PP extract. This suggests a possibility of intermit- tent losses occurring during one or more stages of the PP process, which requires further investigation. Our results are similar to those reported by Memon et al. [15], who analyzed phenolics in fruits and leaves from Morus Alba species grown in Pakistan and found that chlorogenic acid was a prominent phenolic acid. Other identified phenolic acids were caffeic, vanillic, p- hydroxybenzoic, p-coumaric, sinapic, proto catechuic, syringic, ferulic, and m-coumaric acids. Gallic, proto- catechuic, p-coumaric and ferulic acids were found in fruits and extracts but not leaves, suggesting a possibility that the acids were present in leaves in an inactive/ bound form(s) and released during the extraction process [14]. Table 1. Basic compounds in Morus alba leaf water extracts from pilot plant (PP) and laboratory (L) process a,b. Pilot plant (PP) Laboratory (L) Compound g/100g Water 5.40b ± 0.07 5.12a ± 0.10 Protein 12.70a ± 1.73 14.70b ± 0.03 Ash 22.70b ± 0.13 22.37a ± 1.21 Fat 0.15b ± 0.02 0.11a ± 0.01 Saccharose 24.35b ± 1.03 18.62a ± 0.92 Glucose 3.00a ± 0.02 4.90b ± 0.02 Fructose 3.02b ± 0.01 1.61a± 0.01 Xylose 0.64a ± 0.00 0.85b ± 0.01 Galactose 1.14b ± 0.02 0.27a ± 0.01 Other carbohydratesc 18.50b 17.04a aValues are means ± SD of 5 measurements. bValues in columns with dif- ferent superscript letters are significantly different (P ≤ 0.05). Calculated from the difference (100 g). 4.3. Bioactive Compounds –Flavonols Flavonols are major contributors to antioxidant active- ity of Morus alba leaves. High antioxidative properties of flavonols are attributed to their structure and in par- ticular, to the presence and configuration of hydroxyl and metoxyl groups and glycosidic bonds [16]. Qualitative and quantitative analyses of flavonol glicosides yielded similar results in both, PP and L extracts (Ta b le 3 ). We identified rutin (3-O-rutinoside quercetin), izoquercitrin (quercetin 3-β-D-glucoside) and astragalin (kaempferol 3-β-D-glucopyranoside) in the glycoside but not in the free form. The same compounds were identified by Kim et al in Korean Morus alba leaf extract [17]. In addition, we found two other compounds, most likely quercetin 3-(6- malonyl)-glucoside and kaempferol 3-(6-malonyl)-glu- coside, first identified in Morus alba by Katsube et al. [18]. The authors found that quercetin 3-(6-malonyl glu- coside) and rutin (quercetin 3-rutinoside) were two pre- dominant flavonol glycosides in the 60% ethanol leaf extract from Japanese variety of Morus Alba. Other an- tioxidant flavonols identified by Katsube et al were iso- quercitrin and astragalin. In our extracts we identified all Table 2. Phenolic acids concentration in Morus alba leaf aqueous extracts from pilot plant (PP) and laboratory (L) proc- esses (g/100g of extract dry weight)a,b. Acid Pilot plant (PP) Laboratory (L) Gallic 0.28b ± 0.15 0.02a ± 0.02 Protocatechuic 0.08a ± 0.03 0.16b ± 0.03 p-hydroxybenzoic 0.11b ± 0.02 0.11a ± 0.02 Vanillic 0.42a ± 0.12 0.71b ± 0.01 Chlorogenic 2.33a ± 0.10 4.64b ± 0.01 Caffeic 0.66a ± 0.04 2.54b ± 0.01 p-coumaric 0.12a ± 0.02 0.27b ± 0.04 Ferulic 0.09a ± 0.01 0.39b ± 0.01 Sinapic 0.11a ± 0.02 0.21b ± 0.04 Total phenolic acids4.27a ± 0.02 9.09b± 0.02 aValues are means ± SD of 5 measurements. bValues in columns with differ- ent superscript letters are significantly different (P≤ 0.05). Table 3. Flavonols concentration in Morus alba leaf aqueous extracts from pilot plant (PP) and laboratory (L) processes (g/100g of extract dry weight) a,b. Compound Pilot plant (PP) Laboratory (L) Rutin 0.90a ± 0.01 0.91a ± 0.01 Quercetin 3-β-D-glucoside 0.47a ± 0.01 0.54b ± 0.01 Kaempferol 3-β-D- glu- copyranoside 0.19a ± 0.02 0.32b ± 0.01 Total Flavonols 1.56a± 0.02 1.76b ± 0.02 aValues are means ± SD of 5 measurements. bValues in columns with differ- ent superscript letters are significantly different (P ≤ 0.05). Copyright © 2013 SciRes. Openly accessible at http://www.scirp.org/journal/as/ 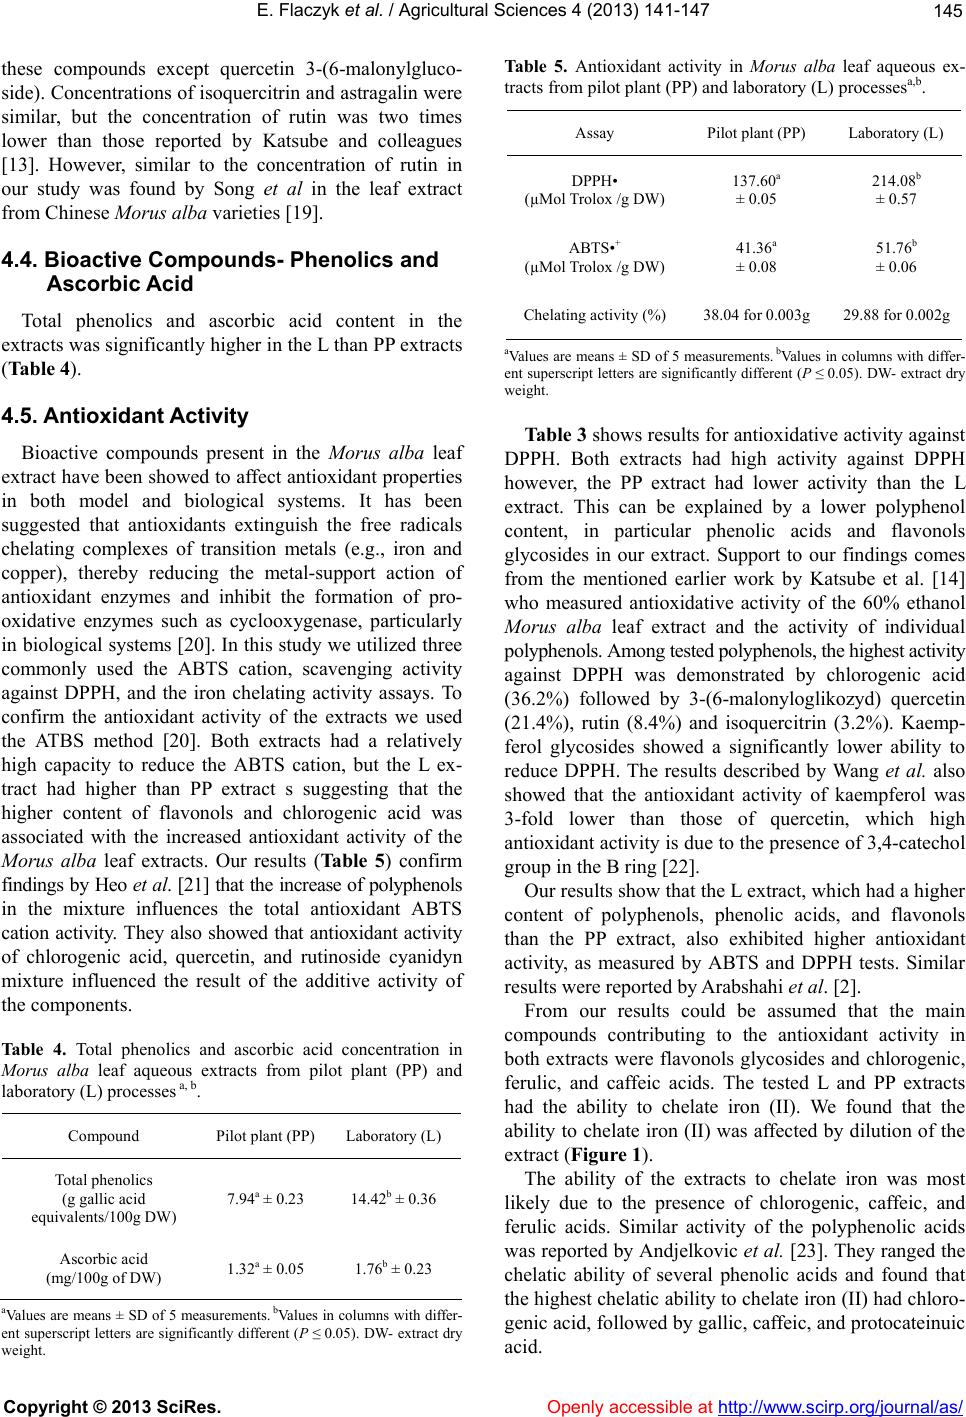 E. Flaczyk et al. / Agricultural Sciences 4 (2013) 141-147 145 these compounds except quercetin 3-(6-malonylgluco- side). Concentrations of isoquercitrin and astragalin were similar, but the concentration of rutin was two times lower than those reported by Katsube and colleagues [13]. However, similar to the concentration of rutin in our study was found by Song et al in the leaf extract from Chinese Morus alba varieties [19]. 4.4. Bioactive Compounds- Phenolics and Ascorbic Acid Total phenolics and ascorbic acid content in the extracts was significantly higher in the L than PP extracts (Table 4). 4.5. Antioxidant Activity Bioactive compounds present in the Morus alba leaf extract have been showed to affect antioxidant properties in both model and biological systems. It has been suggested that antioxidants extinguish the free radicals chelating complexes of transition metals (e.g., iron and copper), thereby reducing the metal-support action of antioxidant enzymes and inhibit the formation of pro- oxidative enzymes such as cyclooxygenase, particularly in biological systems [20]. In this study we utilized three commonly used the ABTS cation, scavenging activity against DPPH, and the iron chelating activity assays. To confirm the antioxidant activity of the extracts we used the ATBS method [20]. Both extracts had a relatively high capacity to reduce the ABTS cation, but the L ex- tract had higher than PP extract s suggesting that the higher content of flavonols and chlorogenic acid was associated with the increased antioxidant activity of the Morus alba leaf extracts. Our results (Ta bl e 5 ) confirm findings by Heo et al. [21] that the increase of polyphenols in the mixture influences the total antioxidant ABTS cation activity. They also showed that antioxidant activity of chlorogenic acid, quercetin, and rutinoside cyanidyn mixture influenced the result of the additive activity of the components. Table 4. Total phenolics and ascorbic acid concentration in Morus alba leaf aqueous extracts from pilot plant (PP) and laboratory (L) processes a, b. Compound Pilot plant (PP) Laboratory (L) Total phenolics (g gallic acid equivalents/100g DW) 7.94a ± 0.23 14.42b ± 0.36 Ascorbic acid (mg/100g of DW) 1.32a ± 0.05 1.76b ± 0.23 aValues are means ± SD of 5 measurements. bValues in columns with differ- ent superscript letters are significantly different (P ≤ 0.05). DW- extract dry weight. Table 5. Antioxidant activity in Morus alba leaf aqueous ex- tracts from pilot plant (PP) and laboratory (L) processesa,b. Assay Pilot plant (PP) Laboratory (L) DPPH• (µMol Trolox /g DW) 137.60a ± 0.05 214.08b ± 0.57 ABTS•+ (µMol Trolox /g DW) 41.36a ± 0.08 51.76b ± 0.06 Chelating activity (%) 38.04 for 0.003g 29.88 for 0.002g aValues are means ± SD of 5 measurements. bValues in columns with differ- ent superscript letters are significantly different (P ≤ 0.05). DW- extract dry weight. Table 3 shows results for antioxidative activity against DPPH. Both extracts had high activity against DPPH however, the PP extract had lower activity than the L extract. This can be explained by a lower polyphenol content, in particular phenolic acids and flavonols glycosides in our extract. Support to our findings comes from the mentioned earlier work by Katsube et al. [14] who measured antioxidative activity of the 60% ethanol Morus alba leaf extract and the activity of individual polyphenols. Among tested polyphenols, the highest activity against DPPH was demonstrated by chlorogenic acid (36.2%) followed by 3-(6-malonyloglikozyd) quercetin (21.4%), rutin (8.4%) and isoquercitrin (3.2%). Kaemp- ferol glycosides showed a significantly lower ability to reduce DPPH. The results described by Wang et al. also showed that the antioxidant activity of kaempferol was 3-fold lower than those of quercetin, which high antioxidant activity is due to the presence of 3,4-catechol group in the B ring [22]. Our results show that the L extract, which had a higher content of polyphenols, phenolic acids, and flavonols than the PP extract, also exhibited higher antioxidant activity, as measured by ABTS and DPPH tests. Similar results were reported by Arabshahi et al. [2]. From our results could be assumed that the main compounds contributing to the antioxidant activity in both extracts were flavonols glycosides and chlorogenic, ferulic, and caffeic acids. The tested L and PP extracts had the ability to chelate iron (II). We found that the ability to chelate iron (II) was affected by dilution of the extract (Figure 1). The ability of the extracts to chelate iron was most likely due to the presence of chlorogenic, caffeic, and ferulic acids. Similar activity of the polyphenolic acids was reported by Andjelkovic et al. [23]. They ranged the chelatic ability of several phenolic acids and found that the highest chelatic ability to chelate iron (II) had chloro- genic acid, followed by gallic, caffeic, and protocateinuic acid. Copyright © 2013 SciRes. Openly accessi ble at http://www.scirp.org/journal/as/  E. Flaczyk et al. / Agricultural Sciences 4 (2013) 141-147 146 Figure 1. Chelating activity of Morus alba leaf aqueous extract from the pilot plant (PP) process. The same letters above the bars indicate no significant statistical differences. 5. CONCLUSIONS Taken together, results of this study show that both, tested Morus alba leaf extracts exhibited antioxidant activity measured by scavenging of stable DPPH and ABTS radicals and the ability to chelate iron (II). The PP extract obtained at the pilot-scale had lower than the ob- tained at laboratory L extract content of phenolic com- pounds, phenolic acids, and flavonols, lower antioxidant properties as measured by ABTS, DPPH assays, and lower ability to chelate iron (II). Potential improvements of the PP process may include increasing efficacy of the extraction, decreasing losses of bioactive components during the process, or both. 6. ACKNOWLEDGEMENTS This research was supported by POIG 01.01.02 -00-061/09 „New bioactive food with designed functional properties”. REFERENCES [1] Amarowicz, R., Pegg, R.B. and Bautista, D.A. (2000) Antibacterial activity of green tea polyphenols against Escherichia coli K 12, Food / Nahrung, 441, 60-62. doi:10.1002/(SICI)1521-3803(20000101)44:1<60::AID-F OOD60>3.0.CO;2-L [2] Andjelković, M., Van Camp, J., De Meulenaer, B., et al. (2006) Iron-chelation properties of phenolic acids bearing catechol and galloyl groups. Food Chemistry, 98, 23-31. doi:10.1016/j.foodchem.2005.05.044 [3] Arabshahi-D. S., Devi, D.V. and Urooj, A. (2007) Evalua- tion of antioxidant activity of some plant extracts and their heat, pH and storage stability. Food Chemistry, 100, 1100-1105.doi:10.1016/j.foodchem.2005.11.014 [4] Butt, M.S., Nazir, A., Sultan, M.T. and Schroën, K. (2008) Morus alba L. nature's functional tonic. Trends in Food Science & Technology, 19,505-512. doi:10.1016/j.tifs.2008.06.002 [5] Cheung, L.M., Cheung, P.C.K. and Ooi, V.E.C. (2003) Antioxidant activity and total phenolics of edible mush- room extracts. Food Chemistry, 81, 249-55. doi:10.1016/S0308-8146(02)00419-3 [6] Gliszczyńska-Swigło, A., Ciska, E., Pawlak-Lemańska, K., Chmielewski, J., Borkowski, T. and Tyrakowska, B. (2006) Changes in the content of health-promoting com- pounds and antioxidant activity of broccoli after domestic processing. Food Additives and Contaminants, 23, 1088-1098.doi:10.1080/02652030600887594 [7] Heo, H.J., Kim, Y.J., Chung, D. and Kim, D.-O. (2007) Antioxidant capacities of individual and combined phe- nolics in a model system. Food C h em i st ry, 104, 87-92. doi:10.1016/j.foodchem.2006.11.002 [8] Katsube, T., Imawaka, N., Kawano, Y., Yamazaki, Y., Shiwaku, K. and Yamane, Y. (2006) Antioxidant flavonol glycosides in mulberry (Morus alba L.) leaves isolated based on LDL antioxidant activity. Food Chemistry, 97, 25-31.doi:10.1016/j.foodchem.2005.03.019. [9] Katsube, T., Tsurunaga, Y., Sugiyama, M., Furuno, T. and Yamasaki, Y. (2009) Effect of air-drying temperature on antioxidant capacity and stability of polyphenolic com- pounds in mulberry (Morus alba L.) leaves. Food Chem- istry, 11 3, 964-969.doi:10.1016/j.foodchem.2008.08.041. [10] Kim, S.Y., Gao, J., Lee, W., Ryu, K., Lee, K. and Kim, Y. (1999) Antioxidative flavonoids from the leaves of Morus alba. Arch Ph Res, 122, 81-85. [11] Kobus, J., Flaczyk, E., Siger, A., Nogala-Kałucka, M., Korczak, J., Pegg, R.B. (2009) Phenolic compounds and antioxidant activity of extracts of Ginkgo leaves. Euro- pean Journal of Lipid Science and Technology, 111, 1150-1160.doi:10.1002/ejlt.200800299 [12] Memon, A., Memon, N., Luthria D., MI B., AA P. (2010) Phenolic acids profiling and antioxidant potential of mulberry (Morus laevigata W., Morus nigra L., Morus alba L.) leaves and fruits grown in Pakistan. Pol. J. Food Nutr. Sci, 60, 25-32. [13] Nakamura, M., Nakamura, S., Oku, T. (2009) Suppressive response of confections containing the extractive from leaves of Morus Alba on postprandial blood glucose and insulin in healthy human subjects. Nutrition & Metabo- lism, 6, 29.doi:10.1186/1743-7075-6-29 [14] Paganga, G ., Miller, N., Rice-Evans, C.A. (1999) The polyphenolic content of fruit and vegetables and their an- tioxidant activities. What does a serving constitute? Free Radical Research. 30, 153-162. doi:10.1080/10715769900300161 [15] Przeor, M., Flaczyk, E. (2011) The influence of drying temperature on the antioxidative properties of shoots and leaves of White Mulberry (Morus alba L.). Adv Argic Sci Probl Issues, 569, 277-283. [16] Re, R., Pellegrini, N., Proteggente, A., Pannala, A., Yang, M. and Rice-Evans C. (1999) Antioxidant activity apply- ing an improved ABTS radical cation decolorization as- say. Free Radical Biology and Medicine, 26, 1231-1237. doi:10.1016/S0891-5849(98)00315-3 [17] Song, W., Wang, H.J., Bucheli, P., Zhang, P.F., Wei, D.Z. and Lu, Y.H. (2009) Phytochemical Profiles of Different Mulberry (Morus sp.) Species from China. Journal of Agricultural and Food Chemistry, 57, 9133-9140. Copyright © 2013 SciRes. Openly accessible at http://www.scirp.org/journal/as/  E. Flaczyk et al. / Agricultural Sciences 4 (2013) 141-147 Copyright © 2013 SciRes. http://www.scirp.org/journal/as/Openly accessible at 147 doi:10.1021/jf9022228 [18] Srivastava, S., Kapoor, R., Thathola, A. and Srivastava, R.P. (2003) Mulberry (Moms alba) leaves as human food: a new dimension of sericulture. International Journal of Food Sciences and Nutrition, 54, 411-416. doi:10.1080/09637480310001622288 [19] Su, L., Yin, J.-J., Charles, D., Zhou, K., Moore, J. and Yu, L. (2007) Total phenolic contents, chelating capacities, and radical-scavenging properties of black peppercorn, nutmeg, rosehip, cinnamon and oregano leaf. Food Chemistry, 100, 990-997. doi:10.1016/j.foodchem.2005.10.058 [20] Tang, S.Z., Kerry, J.P., Sheehan, D. and Buckley, D.J. (2002) Antioxidative mechanisms of tea catechins in chicken meat systems. Food Chemistry, 76, 45-51. doi:10.1016/S0308-8146(01)00248-5 [21] Wang, L., Tu, Y.-C., Lian, T.-W., Hung, J.-T., Yen, J.-H., Wu, M.-J. (2006) Distinctive Antioxidant and Antiin- flammatory Effects of Flavonols. Journal of Agricultural and Food Chemistry, 54, 9798-9804. [22] Wang, W.X., Yang, H.J., Bo, Y.K., Ding, S. and Cao, B.H. (2012) Nutrient composition, polyphenolic contents, and in situ protein degradation kinetics of leaves from three mulberry species. Livestock Science, 146, 203-206. doi:10.1016/j.livsci.2012.03.009 [23] Yang, J., Guo, J., Yuan, J. (2008) In vitro antioxidant properties of rutin. LWT - Food Science and Technology, 41, 1060-1066.doi:10.1016/j.lwt.2007.06.010
|