 Vol.4, No.5B, 65-72 (2013) Agricultural Sciences doi:10.4236/as.2013.45B013 Optimisation of beef tenderisation treated with bromelain using response surface methodology (RSM) S. Zainal, K. Z. Nadzirah*, A. Noriham, I. Normah Department of Food Science and Technology, Faculty of Applied Sciences, Universiti Teknologi MARA, Shah Alam, Selangor, Malaysia; *Corresponding Author: zira_scorpio@yahoo.com Received 2013 ABSTRACT The purpose of this study is to determine the op- timum condition for the tenderization of beef by bromelain using Response Surface Methodology (RSM). Initially, bromelain powder was produced from pineapple crown of variety N36. Production of the bromelain powder involves several proc- ess steps such as extraction, purification, desalt- ing and freeze drying. The cube s ize beef of round part was treated with bromelain at different pHs of beef, immersion temperatures, bromelain so- lution concentrations, and immersion times ac- cording to the experimental design which was recommended by RSM of MINITAB softw are ver- sion 15. Beef tenderness was then measured by Texture Analyser. The MINITAB software Ver- sion 15 was used to optimise the tenderisation of beef by bromelain. The determination coeffi- cient R2 was 99.97% meaning that the experi- mental data were acceptable. It was found that beef could be optimize tenderised 89.907% at the optimum condition at pH of beef of 5.4, im- mersion temperature of 60℃, bromelain solution concentration of 0.1682% and immersion time of 10 minutes. The verification value of beef ten- derisation at the feasible optimum condition which was determined by experiment was 89.571%. Since the difference between the veri- fication and predicted values was less than 5%, therefore, the optimum condition for the tender- isation of beef predicted by MINITAB software Version 15 could be accepted. Keywords: Beef; Bromelain; Tenderisation; Response Surface Methodology (RSM ) 1. INTRODUCTION Beef from Brahman breed is known for its toughness [1]. Thus, it is unsatisfactory to the consumer, if the meat is so tough that it is difficult to eat [2]. Therefore, numerous attempts have been made to encounter this problem and tenderising beef using bromelain becomes one of the widely used methods to improve the beef tenderness. This is because bromelain showed hydrolytic activity on the connective tissue leading to the better tenderisation of the tough meat [3]. Bromelain is a proteolytic enzyme found in pineapple plant [4-5] where it is accumulated in the entire part with different extents and properties depending on its source [6]. Production of bromelain powder involves extraction, purification, desalting and drying processes which can be performed using varieties of procedure. In the present study, production of the bromelain powder from pineapple crown of variety N36 was carried out according to the method by [7] with slight modification. The action of bromelain in tenderising beef is affected by pHs of beef [8-9] immersion temperatures, bromelain solution concentrations and immersion times [10,11]. Re- search on the optimisation of beef tenderisation treated with bromelain has not been carried. Therefore, this study was conducted to determine the optimum condition for the tenderisation of beef by bromelain using Response Surface Methodology (RSM). RSM is a collection of statistical techniques for design- ing experiments, building models, evaluating the effects of factors on the response and searching for the optimum conditions [12]. The principal advantage of using RSM is the number of experimental runs required to evaluate multiple factors and their interactions can be reduced [13-16]. Consequently, less time-consuming used to op- timise a process compared to other approaches [17]. 2. MATERIALS AND METHODS 2.1. Materials Pineapple crown of variety N36 from maturity index 2 was obtained from Peninsula Plantations Sdn Bhd at Copyright © 2013 SciRes. Openly accessible at http://www.scirp.org/journal/as/ 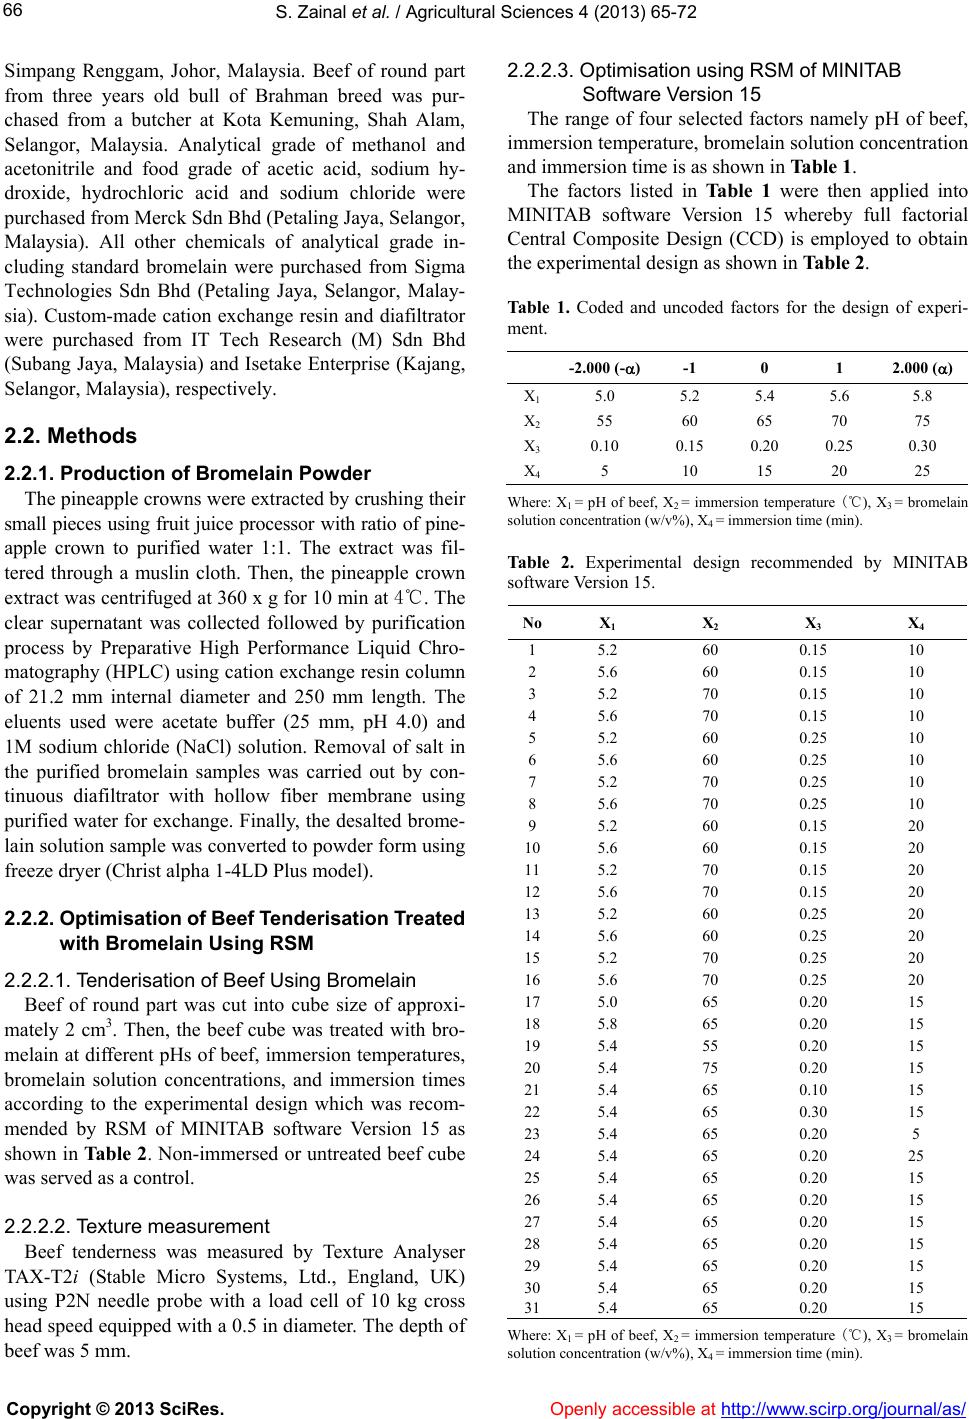 S. Zainal et al. / Agricultural Sciences 4 (2013) 65-72 66 Simpang Renggam, Johor, Malaysia. Beef of round part from three years old bull of Brahman breed was pur- chased from a butcher at Kota Kemuning, Shah Alam, Selangor, Malaysia. Analytical grade of methanol and acetonitrile and food grade of acetic acid, sodium hy- droxide, hydrochloric acid and sodium chloride were purchased from Merck Sdn Bhd (Petaling Jaya, Selangor, Malaysia). All other chemicals of analytical grade in- cluding standard bromelain were purchased from Sigma Technologies Sdn Bhd (Petaling Jaya, Selangor, Malay- sia). Custom-made cation exchange resin and diafiltrator were purchased from IT Tech Research (M) Sdn Bhd (Subang Jaya, Malaysia) and Isetake Enterprise (Kajang, Selangor, Malaysia), respectively. 2.2. Methods 2.2.1. Production of Bromelain Po wder The pineapple crowns were extracted by crushing their small pieces using fruit juice processor with ratio of pine- apple crown to purified water 1:1. The extract was fil- tered through a muslin cloth. Then, the pineapple crown extract was centrifuged at 360 x g for 10 min at 4℃. The clear supernatant was collected followed by purification process by Preparative High Performance Liquid Chro- matography (HPLC) using cation exchange resin column of 21.2 mm internal diameter and 250 mm length. The eluents used were acetate buffer (25 mm, pH 4.0) and 1M sodium chloride (NaCl) solution. Removal of salt in the purified bromelain samples was carried out by con- tinuous diafiltrator with hollow fiber membrane using purified water for exchange. Finally, the desalted brome- lain solution sample was converted to powder form using freeze dryer (Christ alpha 1-4LD Plus model). 2.2.2. Optimisation of Beef Tenderisat ion Treated with Bromelain Using RSM 2.2.2.1. Tenderisation of Beef Usi n g Bromelain Beef of round part was cut into cube size of approxi- mately 2 cm3. Then, the beef cube was treated with bro- melain at different pHs of beef, immersion temperatures, bromelain solution concentrations, and immersion times according to the experimental design which was recom- mended by RSM of MINITAB software Version 15 as shown in Table 2. Non-immersed or untreated beef cube was served as a control. 2.2.2.2. Texture measurement Beef tenderness was measured by Texture Analyser TAX-T2i (Stable Micro Systems, Ltd., England, UK) using P2N needle probe with a load cell of 10 kg cross head speed equipped with a 0.5 in diameter. The depth of beef was 5 mm. 2.2.2.3. Optimisation using RSM of MINITAB Software Version 15 The range of four selected factors namely pH of beef, immersion temperature, bromelain solution concentration and immersion time is as shown in Table 1. The factors listed in Table 1 were then applied into MINITAB software Version 15 whereby full factorial Central Composite Design (CCD) is employed to obtain the experimental design as shown in Table 2. Table 1. Coded and uncoded factors for the design of experi- ment. -2.000 (-)-1 0 1 2.000 () X1 5.0 5.2 5.4 5.6 5.8 X2 55 60 65 70 75 X3 0.10 0.15 0.20 0.25 0.30 X4 5 10 15 20 25 Where: X1 = pH of beef, X2 = immersion temperature (℃), X3 = bromelain solution concentration (w/v%), X4 = immersion time (min). Table 2. Experimental design recommended by MINITAB software Version 15. No X1 X 2 X 3 X 4 1 5.2 60 0.15 10 2 5.6 60 0.15 10 3 5.2 70 0.15 10 4 5.6 70 0.15 10 5 5.2 60 0.25 10 6 5.6 60 0.25 10 7 5.2 70 0.25 10 8 5.6 70 0.25 10 9 5.2 60 0.15 20 10 5.6 60 0.15 20 11 5.2 70 0.15 20 12 5.6 70 0.15 20 13 5.2 60 0.25 20 14 5.6 60 0.25 20 15 5.2 70 0.25 20 16 5.6 70 0.25 20 17 5.0 65 0.20 15 18 5.8 65 0.20 15 19 5.4 55 0.20 15 20 5.4 75 0.20 15 21 5.4 65 0.10 15 22 5.4 65 0.30 15 23 5.4 65 0.20 5 24 5.4 65 0.20 25 25 5.4 65 0.20 15 26 5.4 65 0.20 15 27 5.4 65 0.20 15 28 5.4 65 0.20 15 29 5.4 65 0.20 15 30 5.4 65 0.20 15 31 5.4 65 0.20 15 Where: X1 = pH of beef, X2 = immersion temperature (℃), X3 = bromelain solution concentration (w/v%), X4 = immersion time (min). Copyright © 2013 SciRes. Openly accessible at http://www.scirp.org/journal/as/  S. Zainal et al. / Agricultural Sciences 4 (2013) 65-72 67 Response surface regression analysis was performed to obtain a second-order polynomial equation or model. Statistical analysis of the model was represented in the form of Analysis of Variance (ANOVA). The MINITAB software Version 15 was also used to generate response contour and surface plots. 3. RESULTS AND DISCUSSION Results in Table 3 show that the highest actual and predicted responses were 89.907% and 89.813%, respec- tively at factors whereby pH of beef was 5.6, immersion temperature at 60℃, bromelain solution concentration of 0.15% and immersion time of 10 minutes. The lowest actual and predicted responses were 58.267% and 58.608%, respectively at factors whereby pH of beef was 5.4, immersion temperature at 65℃, bromelain solution concentration of 0.20% and immersion time of 15 min- utes. Table 3. Factors and comparison between actual (Y) and pre- dicted (FITS) responses. Test variables Responses No X1 X 2 X 3 X 4 Y (%) FITS (%) 1 5.2 60 0.15 10 81.530 81.663 2 5.6 60 0.15 10 89.907 89.813 3 5.2 70 0.15 10 86.442 86.429 4 5.6 70 0.15 10 87.551 87.543 5 5.2 60 0.25 10 85.521 85.314 6 5.6 60 0.25 10 86.931 86.971 7 5.2 70 0.25 10 71.343 71.352 8 5.6 70 0.25 10 66.053 65.974 9 5.2 60 0.15 20 85.458 85.263 10 5.6 60 0.15 20 89.147 89.439 11 5.2 70 0.15 20 85.807 86.068 12 5.6 70 0.15 20 83.273 83.208 13 5.2 60 0.25 20 86.146 86.455 14 5.6 60 0.25 20 84.399 84.139 15 5.2 70 0.25 20 68.713 68.534 16 5.6 70 0.25 20 59.013 59.181 17 5.0 65 0.20 15 64.929 64.810 18 5.8 65 0.20 15 64.205 64.209 19 5.4 55 0.20 15 73.532 73.513 20 5.4 75 0.20 15 63.511 63.417 21 5.4 65 0.10 15 62.901 62.589 22 5.4 65 0.30 15 52.202 52.401 23 5.4 65 0.20 5 67.019 67.237 24 5.4 65 0.20 25 65.972 65.640 25 5.4 65 0.20 15 58.663 58.608 26 5.4 65 0.20 15 58.574 58.608 27 5.4 65 0.20 15 58.309 58.608 28 5.4 65 0.20 15 58.267 58.608 29 5.4 65 0.20 15 58.881 58.608 30 5.4 65 0.20 15 58.894 58.608 31 5.4 65 0.20 15 58.328 58.608 Where: X1 = pH of beef, X2 = immersion temperature (℃), X3 = bromelain solution concentration (w/v%), X4 = immersion time (min). Table 4. Estimated regression coefficients of second-order polynomial model for optimisation of beef tenderisation treated with bromelain. Term CoefficientSE Coefficient t p Constant5013.43 122.781 40.832 0.000 X1 -1433.30 47.267 -30.324 0.000 X2 -38.43 0.984 -39.051 0.000 X3 2206.78 50.616 43.599 0.000 X4 -1.13 0.473 -2.380 0.030 X1X1 147.55 4.353 33.895 0.000 X2X2 0.39 0.007 56.609 0.000 X3X3 -445.22 69.648 -6.392 0.000 X4X4 0.31 0.007 44.973 0.000 X1X2 -1.76 0.070 -25.083 0.000 X1X3 -162.31 7.012 -23.146 0.000 X1X4 -0.99 0.070 -14.168 0.000 X2X3 -18.73 0.280 -66.762 0.000 X2X4 -0.04 0.003 -14.119 0.000 X3X4 -2.46 0.280 -8.764 0.000 R² = 99.97 % R² (adj) = 99.95 % Where: X1 = pH of beef, X2 = immersion temperature (℃), X3 = bromelain solution concentration (w/v%), X4 = immersion time (min), SE = standard error, t = student test, p = probability, R2 = R – squared, R2 (adj) = adjusted R – squared. Response surface regression analysis was performed and results of estimated regression coefficients of sec- ond-order polynomial model for optimisation of beef tenderisation treated with bromelain are as shown in Ta- ble 4. Based on Table 4, the second-order polynomial model equation for optimisation of beef tenderisation treated with bromelain is as given in equation 2: Y = 5013.43 – 1433.30X1 – 38.43X2 + 2206.78X3 – 1.13X4 + 147.55X1 2 + 0.39X2 2 – 445.22X3 2 + 0.31X4 2 – 1.76X1X2 – 162.31X1X3 – 0.99X1X4 – 18.73X2X3 – 0.04X2X4 – 2.46X3X4 (1) Where: X1 = pH of beef, X2 = immersion temperature (℃), X3 = bromelain solution concentration (w/v%), X4 = immersion time (min) The significant second-order polynomial model equa- tion at the 5% level for the optimisation of beef tender- isation treated with bromelain is same as in equation (1). By referring to Table 4, it was found that linear factors such as pH of beef (X1), immersion temperature (X2) and immersion time (X4) showed negative coefficients, re- spectively while bromelain solution concentration (X3) Copyright © 2013 SciRes. Openly accessible at http://www.scirp.org/journal/as/ 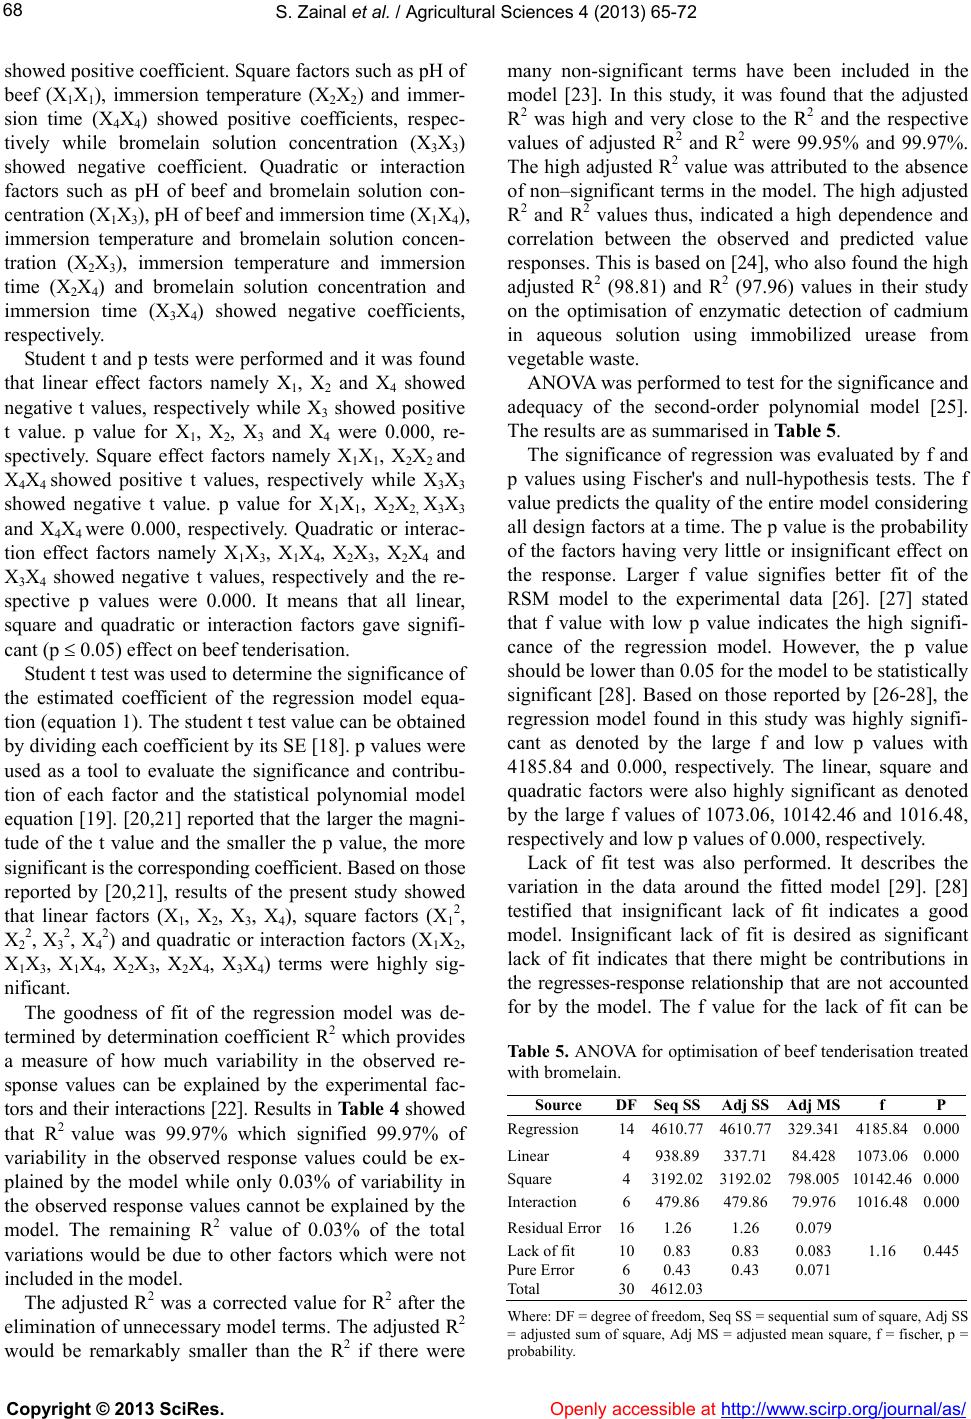 S. Zainal et al. / Agricultural Sciences 4 (2013) 65-72 68 Copyright © 2013 SciRes. Openly accessible at http://www.scirp.org/journal/as/ showed positive coefficient. Square factors such as pH of beef (X1X1), immersion temperature (X2X2) and immer- sion time (X4X4) showed positive coefficients, respec- tively while bromelain solution concentration (X3X3) showed negative coefficient. Quadratic or interaction factors such as pH of beef and bromelain solution con- centration (X1X3), pH of beef and immersion time (X1X4), immersion temperature and bromelain solution concen- tration (X2X3), immersion temperature and immersion time (X2X4) and bromelain solution concentration and immersion time (X3X4) showed negative coefficients, respectively. Student t and p tests were performed and it was found that linear effect factors namely X1, X2 and X4 showed negative t values, respectively while X3 showed positive t value. p value for X1, X2, X3 and X4 were 0.000, re- spectively. Square effect factors namely X1X1, X2X2 and X4X4 showed positive t values, respectively while X3X3 showed negative t value. p value for X1X1, X2X2, X3X3 and X4X4 were 0.000, respectively. Quadratic or interac- tion effect factors namely X1X3, X1X4, X2X3, X2X4 and X3X4 showed negative t values, respectively and the re- spective p values were 0.000. It means that all linear, square and quadratic or interaction factors gave signifi- cant (p 0.05) effect on beef tenderisation. Student t test was used to determine the significance of the estimated coefficient of the regression model equa- tion (equation 1). The student t test value can be obtained by dividing each coefficient by its SE [18]. p values were used as a tool to evaluate the significance and contribu- tion of each factor and the statistical polynomial model equation [19]. [20,21] reported that the larger the magni- tude of the t value and the smaller the p value, the more significant is the corresponding coefficient. Based on those reported by [20,21], results of the present study showed that linear factors (X1, X2, X3, X4), square factors (X1 2, X2 2, X3 2, X4 2) and quadratic or interaction factors (X1X2, X1X3, X1X4, X2X3, X2X4, X3X4) terms were highly sig- nificant. The goodness of fit of the regression model was de- termined by determination coefficient R2 which provides a measure of how much variability in the observed re- sponse values can be explained by the experimental fac- tors and their interactions [22]. Results in Table 4 showed that R2 value was 99.97% which signified 99.97% of variability in the observed response values could be ex- plained by the model while only 0.03% of variability in the observed response values cannot be explained by the model. The remaining R2 value of 0.03% of the total variations would be due to other factors which were not included in the model. The adjusted R2 was a corrected value for R2 after the elimination of unnecessary model terms. The adjusted R2 would be remarkably smaller than the R2 if there were many non-significant terms have been included in the model [23]. In this study, it was found that the adjusted R2 was high and very close to the R2 and the respective values of adjusted R2 and R2 were 99.95% and 99.97%. The high adjusted R2 value was attributed to the absence of non–significant terms in the model. The high adjusted R2 and R2 values thus, indicated a high dependence and correlation between the observed and predicted value responses. This is based on [24], who also found the high adjusted R2 (98.81) and R2 (97.96) values in their study on the optimisation of enzymatic detection of cadmium in aqueous solution using immobilized urease from vegetable waste. ANOVA was performed to test for the significance and adequacy of the second-order polynomial model [25]. The results are as summarised in Table 5. The significance of regression was evaluated by f and p values using Fischer's and null-hypothesis tests. The f value predicts the quality of the entire model considering all design factors at a time. The p value is the probability of the factors having very little or insignificant effect on the response. Larger f value signifies better fit of the RSM model to the experimental data [26]. [27] stated that f value with low p value indicates the high signifi- cance of the regression model. However, the p value should be lower than 0.05 for the model to be statistically significant [28]. Based on those reported by [26-28], the regression model found in this study was highly signifi- cant as denoted by the large f and low p values with 4185.84 and 0.000, respectively. The linear, square and quadratic factors were also highly significant as denoted by the large f values of 1073.06, 10142.46 and 1016.48, respectively and low p values of 0.000, respectively. Lack of fit test was also performed. It describes the variation in the data around the fitted model [29]. [28] testified that insignificant lack of fit indicates a good model. Insignificant lack of fit is desired as significant lack of fit indicates that there might be contributions in the regresses-response relationship that are not accounted for by the model. The f value for the lack of fit can be Table 5. ANOVA for optimisation of beef tenderisation treated with bromelain. Source DFSeq SSAdj SS Adj MS f P Regression 144610.77 4610.77 329.341 4185.840.000 Linear 4938.89337.71 84.428 1073.060.000 Square 43192.023192.02 798.005 10142.460.000 Interaction 6479.86479.86 79.976 1016.480.000 Residual Error161.26 1.26 0.079 Lack of fit 100.83 0.83 0.083 1.16 0.445 Pure Error 60.43 0.43 0.071 Total 304612.03 Where: DF = degree of freedom, Seq SS = sequential sum of square, Adj SS = adjusted sum of square, Adj MS = adjusted mean square, f = fischer, p = probability. 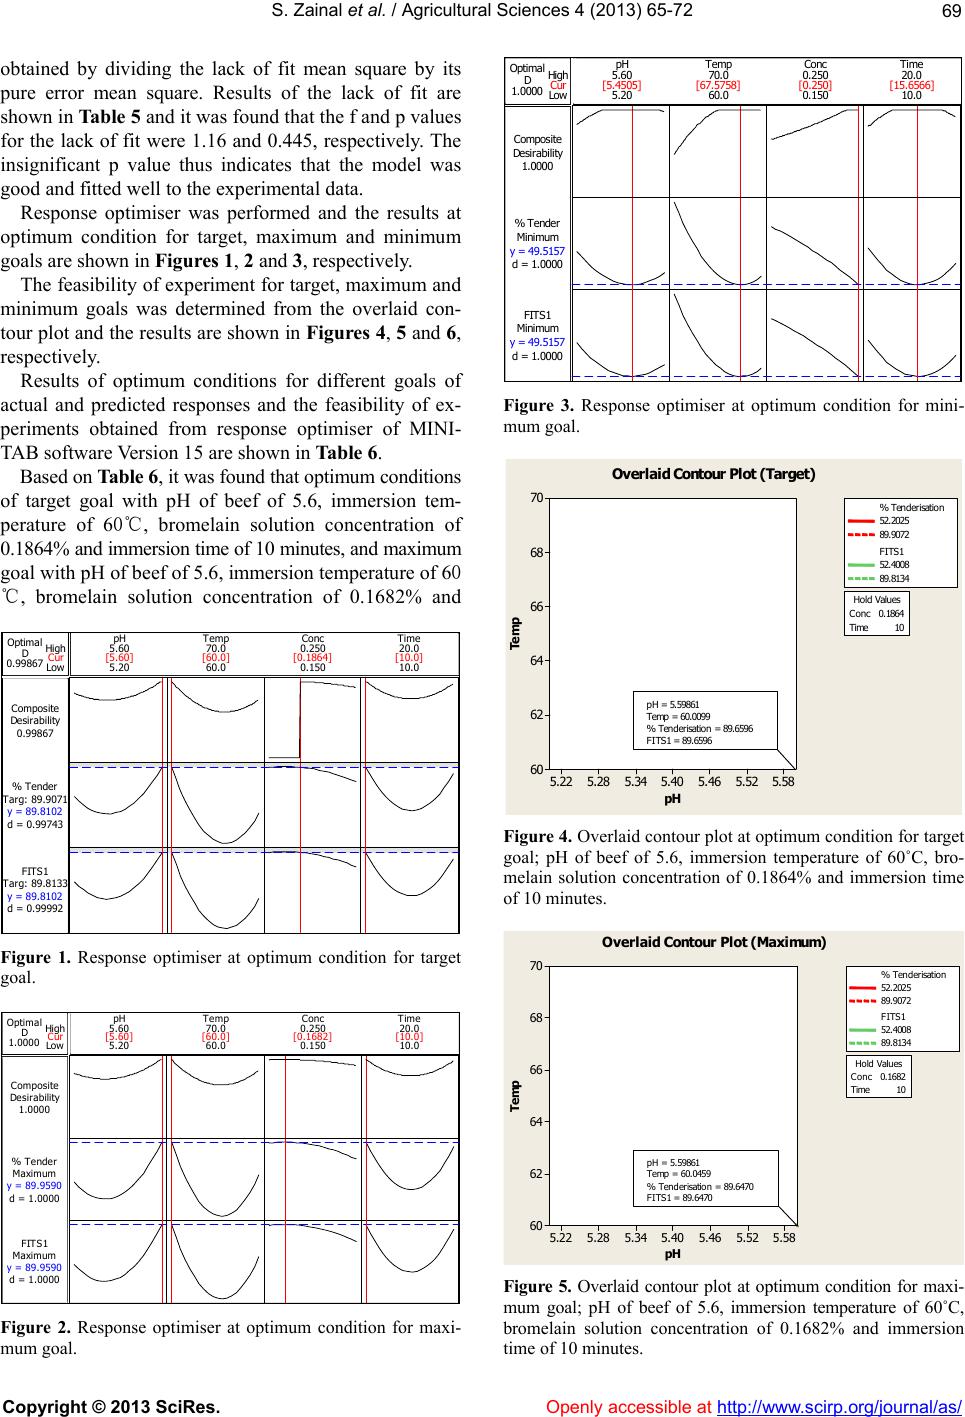 S. Zainal et al. / Agricultural Sciences 4 (2013) 65-72 69 Copyright © 2013 SciRes. Openly accessible at http://www.scirp.org/journal/as/ obtained by dividing the lack of fit mean square by its pure error mean square. Results of the lack of fit are shown in Table 5 and it was found that the f and p values for the lack of fit were 1.16 and 0.445, respectively. The insignificant p value thus indicates that the model was good and fitted well to the experimental data. Response optimiser was performed and the results at optimum condition for target, maximum and minimum goals are shown in Figures 1, 2 and 3, respectively. The feasibility of experiment for target, maximum and minimum goals was determined from the overlaid con- tour plot and the results are shown in Figures 4, 5 and 6, respectively. Results of optimum conditions for different goals of actual and predicted responses and the feasibility of ex- periments obtained from response optimiser of MINI- TAB software Version 15 are shown in Table 6. Based on Table 6, it was found that optimum conditions of target goal with pH of beef of 5.6, immersion tem- perature of 60℃, bromelain solution concentration of 0.1864% and immersion time of 10 minutes, and maximum goal with pH of beef of 5.6, immersion temperature of 60 ℃, bromelain solution concentration of 0.1682% and Cur Hi g h Low 0.99867 D Optimal d = 0.99743 Targ: 89.9071 % Tender y = 89.8102 d = 0.99992 Targ: 89.8133 FITS1 y = 89.8102 0.99867 Desirability Composite 10.0 20.0 0.150 0.250 60.0 70.0 5.20 5.60 [5.60][60.0] [0.1864] [10.0] Temp ConcTimepH Figure 1. Response optimiser at optimum condition for target goal. Cur High Low 1.0000 D Optimal d = 1.0000 Maximum % Tender y = 89. 95 90 d = 1.0000 Maximum FITS 1 y = 89. 95 90 1.0000 Desirability Composite 10.0 20.0 0.150 0.250 60.0 70.0 5.20 5.60 [5.60][60.0][0.1682][10.0] Temp ConcTimepH Figure 2. Response optimiser at optimum condition for maxi- mum goal. Cur Hi g h Low 1.00 00 D Opti m al d = 1.0000 Mini mum % Tender y = 49 .5157 d = 1.0000 Mini mum FITS1 y = 49 .5157 1.0000 Desirability Composite 10.0 20.0 0.15 0 0.25 0 60. 0 70. 0 5.20 5.60 [5.4505] [67.5758][0.250][15.6566] Temp ConcTimepH Figure 3. Response optimiser at optimum condition for mini- mum goal. pH Temp 5.585.525.465.405.345.285.22 70 68 66 64 62 60 Conc 0.1864 Time 10 Hold Values 52.2025 89.9072 % Tenderis ation 52.4008 89.8134 FITS1 O ve rla id C ont o ur P lo t (T a r g e t ) pH = 5.59861 Temp = 60.0099 % Tenderisation = 89.6596 FITS1 = 89.6596 Figure 4. Overlaid contour plot at optimum condition for target goal; pH of beef of 5.6, immersion temperature of 60˚C, bro- melain solution concentration of 0.1864% and immersion time of 10 minutes. pH Temp 5.585. 525.465.405.345.285.22 70 68 66 64 62 60 Conc 0.1682 Time 10 Hold Values 52. 2025 89. 9072 % Tenderisation 52. 4008 89. 8134 FITS1 Ove rlaid C on to ur Plot ( Ma x imum) pH = 5.59861 Temp = 60.0459 % Tenderisation = 89.6470 FITS1 = 89.6470 Figure 5. Overlaid contour plot at optimum condition for maxi- mum goal; pH of beef of 5.6, immersion temperature of 60˚C, bromelain solution concentration of 0.1682% and immersion time of 10 minutes. 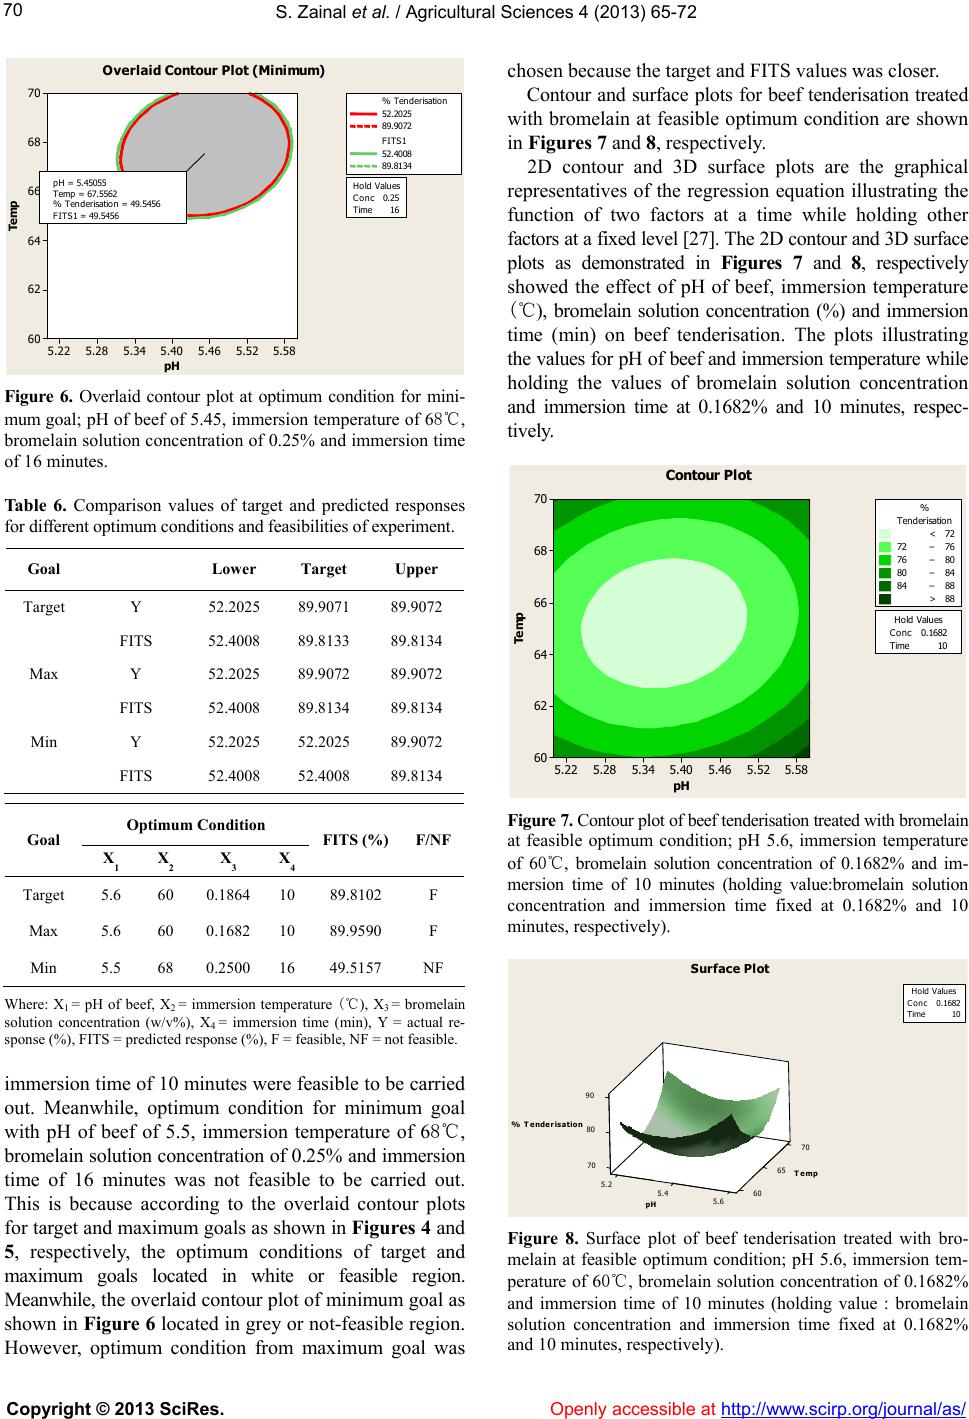 S. Zainal et al. / Agricultural Sciences 4 (2013) 65-72 70 pH Temp 5.585.525.465.405.345.285.22 70 68 66 64 62 60 Conc 0.25 Time 16 Hold Values 52.2025 89.9072 % Tenderisation 52.4008 89.8134 FITS1 Overlaid Con tour Plot ( Minimu m) pH = 5.45055 Temp = 67.5562 % Tenderisat ion = 49.54 56 FITS1 = 49.5456 Figure 6. Overlaid contour plot at optimum condition for mini- mum goal; pH of beef of 5.45, immersion temperature of 68℃, bromelain solution concentration of 0.25% and immersion time of 16 minutes. Table 6. Comparison values of target and predicted responses for different optimum conditions and feasibilities of experiment. Goal Lower Target Upper Target Y 52.2025 89.9071 89.9072 FITS 52.4008 89.8133 89.8134 Max Y 52.2025 89.9072 89.9072 FITS 52.4008 89.8134 89.8134 Min Y 52.2025 52.2025 89.9072 FITS 52.4008 52.4008 89.8134 Optimum Condition Goal X1 X 2 X 3 X 4 FITS (%)F/NF Target 5.6 60 0.186410 89.8102 F Max 5.6 60 0.168210 89.9590 F Min 5.5 68 0.250016 49.5157 NF Where: X1 = pH of beef, X2 = immersion temperature (℃), X3 = bromelain solution concentration (w/v%), X4 = immersion time (min), Y = actual re- sponse (%), FITS = predicted response (%), F = feasible, NF = not feasible. immersion time of 10 minutes were feasible to be carried out. Meanwhile, optimum condition for minimum goal with pH of beef of 5.5, immersion temperature of 68℃, bromelain solution concentration of 0.25% and immersion time of 16 minutes was not feasible to be carried out. This is because according to the overlaid contour plots for target and maximum goals as shown in Figures 4 and 5, respectively, the optimum conditions of target and maximum goals located in white or feasible region. Meanwhile, the overlaid contour plot of minimum goal as shown in Figure 6 located in grey or not-feasible region. However, optimum condition from maximum goal was chosen because the target and FITS values was closer. Contour and surface plots for beef tenderisation treated with bromelain at feasible optimum condition are shown in Figures 7 and 8, respectively. 2D contour and 3D surface plots are the graphical representatives of the regression equation illustrating the function of two factors at a time while holding other factors at a fixed level [27]. The 2D contour and 3D surface plots as demonstrated in Figures 7 and 8, respectively showed the effect of pH of beef, immersion temperature (℃), bromelain solution concentration (%) and immersion time (min) on beef tenderisation. The plots illustrating the values for pH of beef and immersion temperature while holding the values of bromelain solution concentration and immersion time at 0.1682% and 10 minutes, respec- tively. pH Temp 5.585.525.465.405.345.285.22 70 68 66 64 62 60 Conc 0.1682 Time 10 Hold Values > – – – – < 72 72 76 76 80 80 84 84 88 88 Tenderisation % Contour Plot Figure 7. Contour plot of beef tenderisation treated with bromelain at feasible optimum condition; pH 5.6, immersion temperature of 60℃, bromelain solution concentration of 0.1682% and im- mersion time of 10 minutes (holding value:bromelain solution concentration and immersion time fixed at 0.1682% and 10 minutes, respectively). 70 70 65 80 5.2 90 5.4 60 5.6 % T e nd e risation Temp pH Conc0.1682 Time 10 Hold Values Surfac e Pl ot Figure 8. Surface plot of beef tenderisation treated with bro- melain at feasible optimum condition; pH 5.6, immersion tem- perature of 60℃, bromelain solution concentration of 0.1682% and immersion time of 10 minutes (holding value : bromelain solution concentration and immersion time fixed at 0.1682% and 10 minutes, respectively). Copyright © 2013 SciRes. Openly accessible at http://www.scirp.org/journal/as/  S. Zainal et al. / Agricultural Sciences 4 (2013) 65-72 71 Table 7. Comparison of verification and predicted values of beef tenderisation treated with bromelain at feasible optimum condition. Optimum condition X1 X2 X3 X4 V (%) P (%) 5.6 60 0.1682 10 89.571 89.813 Where: X1 = pH of beef, X2 = immersion temperature (℃), X3 = bromelain solution concentration (w/v%), X4 = immersion time (min), V = verification value, P = predicted value. Circular or elliptical shapes of contour plot indicate whether the reciprocal interactions between the factors are significant or not. Circular contour plot indicates the interactions between corresponding factors are negligible, while elliptical contour plot indicates the interactions between corresponding factors are significant [30][20]. Results of the present study showed that the contour plot was elliptical shape thus indicates significant interaction effect between pH of beef and immersion temperature on beef tenderisation. The surface plot showed that the beef tenderisation increased at the lower and higher levels of pH of beef and immersion temperatures while at the middle level of pH of beef and immersion temperature, the beef tenderisation decreased. Verification of beef tenderisation treated with brome- lain at the feasible optimum condition was performed and the result is shown in Table 7. The verification value of the beef tenderisation treated with bromelain at the feasible optimum condition was 89.571% which was very close to the predicted value with 89.813%. Since the difference between the verifica- tion and predicted values was less than 5%, therefore the feasible optimum condition of the beef tenderisation pre- dicted by MINITAB Software Version 15 was accept- able. 4. CONCLUSIONS The determination coefficient R2 (99.97%) was high, thus the experimental data was acceptable. Optimum con- dition for the tenderisation of beef by bromelain using RSM had been determined. It was found that beef could be optimise tenderized 89.907% at the optimum condi- tion pH of beef of 5, immersion temperature of 60℃, bromelain solution concentration of 0.1682% and im- mersion time of 10 minutes. It aws also found that the difference between the verification and predicted values was less than 5%, therefore, the optimum condition for the beef tenderisation predicted by MINITAB Software Version 15 could be accepted. 5. ACKNOWLEDGEMENTS Special thanks to Ministry of Higher Education, Malaysia for fund- ing this project under Fundamental Research Grant Scheme [600- RMI/ST/FRGS/Fst(32/2010)] and also Peninsula Plantation Sdn Bhd, Simpang Renggam, Johor, Malaysia for supplying pineapple for this project. REFERENCES [1] Maiti, A.K., Ahlawat, S.S., Sharma, D.P. and Khanna, N. (2008) Application of natural tenderisers in meat - A re- view. Agricultu ra l Reviews, 29(3), 226-230. [2] Deatherage, F.E.(1974) New approaches to the market- ing of red meats. New protein food, Academic Press, New York. doi:10.1016/B978-0-12-054801-9.50012-0 [3] Żochowska-Kujawska, J., Lachowics, K. and Sobczak, M. (2010). The tenderisation of wild boar meat using a cal- cium chloride, kefir, wine and pineapple marinade. Elec- tronic Journal of Polish Agricultural Universities, 13, 1-8. [4] Umesh Hebbar, H., Sumana, B. and Raghavarao, K.S.M. S.(2008) Use of reverse micellar systems for the extrac- tion and purification of bromelain from pineapple wastes. Bioresour ce Technology, 99, 4896-4902. doi: 10.1016/j.biortech.2007.09.038 [5] Hale, L.P., Greer, P.K., Trinh, C.T. and James, C.L. (2005) Proteinase activity and stability of natural brome- lain preparations. International Immunopharmacology, 5(4), 783-793. doi: 10.1016/j.intimp.2004.12.007 [6] Ngampanya, B. and Phongtongpasuk, S. ( 2006) Effects of sucrose concentration on crude bromelain production of in vitro culture of pineapple (Ananas comosus var. ‘Pattavia’). Kasetsart Journal Natural Science, 40, 129 -134. [7] Devakate, R.V., Patil, V.V., Waje, S.S. and Thorat, B.N. (2009) Purification and drying of bromelain. Separation and Purification Technology, 64, 259-264. doi: 10.1016/j.seppur.2008.09.012 [8] Ke, S., Huang, Y., Decker, E.A. and Hultin, H.O. (2009). Impact of citric acid on the tenderness, microstructure and oxidative stability of beef muscle. Meat Science, 82(1), 113-118. doi: 10.1016/j.meatsci.2008.12.010 [9] Jerez, N.C., Calkins, C.R. and Velazco, J. (2003) Pre- rigor injection using glycolytic inhibitors in low-quality beef muscles. Journal of Animal Science, 81, 997- 1003. [10] Ketnawa, S., Sai-Ut, S., Theppakorn, T., Chaiwut, P. and Rawdkuen, S. (2009) Partitioning of bromelain from pineapple peel (Nang Lae cultv.) by aqueous two phase system. Asian Journal of Food and Agro-Industry, 2, 457-468. [11] Ketnawa, S., Chaiwut, P. and Rawdkuen, S. (2011) Aqueous two-phase extraction of bromelain from pineap- ple peels (‘Phu Lae’ cultv.) and its biochemical properties. Food Science and Biotechnology, 20, 1219-1226. [12] Tripathi, A. and Srivastava, S.K. (2012) Biodegradation of orange G by a novel isolated bacterial strain Bacillus megaterium ITBHU01 using Response Surface Method- ology. African Journal of Biotechnology, 11 , 1768- 1781. [13] Jeong, G.T., Yang, H.S. and Park, D.H. (2009) Optimisa- Copyright © 2013 SciRes. Openly accessible at http://www.scirp.org/journal/as/  S. Zainal et al. / Agricultural Sciences 4 (2013) 65-72 Copyright © 2013 SciRes. http://www.scirp.org/journal/as/Openly accessible at 72 tion of transesterification of animal fat ester. Bioresource Technology, 100(1), 25-30. [14] Sharma, S., Malik, A. and Satya, S. (2009) Application of response surface methodology (RSM) for optimisation of nutrient supplementation for Cr (V1) removal by As- per- gillus lentulus AML05. Journal of Hazardous Materi- als, 164, 1198-1204. [15] Cepeda, E.A. and Calvo, B. (2008) Sunflower oil hy- drogenation: Study using response surface methodology. Journal of Food Engineering, 89(4), 370-374. doi: 10.1016/j.jfoodeng.2008.01.012 [16] Siti Mazlina, M.K., Abdul Ghani, L.A., Nur ‘Aliaa, A.R., Siti Aslina, H. and Rozita, O. (2008) Comparison on op- timisation of star fruit juice using RSM between two Ma- laysian star fruit varieties (B11 and B10). Pertanika Journal of Science and Technology, 16, 1-13. [17] Kongkaew, A., Usansa, U. and Wanapu, C. (2012) Opti- misation of wort production from rice malt using en- zymes and barley malt. African Journal of Biotechnology, 11, 9941-9949. [18] Mullai, P.N., Syed Ali F. and Eldon R.R. (2010) Statisti- cal analysis of main and interaction effects to optimize xylanase production under submerged cultivation condi- tions. Journal of Agricultural Science, 2, 144-153. [19] Thanapimmetha, A., Vuttibunchon, K., Saisriyoot, M. and Srinophakun, P. (2011) Chemical and microbial hydroly- sis of sweet sorghum bagasse for ethanol production. World Renewable Energy Congress-Sweden, Linköping, Sweden. 8-13 May 2011, 1, 389-396. [20] Rengadurai, S., Preetha, B. and Viruthagiri, T. (2012) Response surface technique for optimisation of parame- ters for decolorization of Reactive red BS using Trametes hiruta. International Journal of ChemTech Research, 4, 21-28. [21] Sudamalla, P., Saravanan, P. and Matheswaran, M. (2012) Optimisation of operating parameters using response sur- face methodology for adsorption of crystal violet by acti- vated carbon prepared from mango kernel. Sustainable Environment Research, 22, 1-7. [22] Sudamalla, P., Saravanan, P. and Matheswaran, M. (2012) Optimisation of operating parameters using response sur- face methodology for adsorption of crystal violet by acti- vated carbon prepared from mango kernel. Sustainable Environment Research, 22, 1-7. [23] Fang, X.L., Feng, J.T., Zhang, W.G., Wang, Y.H. and Zhang, X. (2010) Optimization of growth medium and fermentation conditions for improved antibiotic activity of Xenorhabdus nematophila TB using a statistical ap- proach. African Journal of Biotechnology, 9, 8068-8077. doi: 10.5897/ajb09.1939 [24] Hismath, I., Wan Aida, W.M. and Ho, C.W. (2011) Opti- misation of extraction conditions for phenolic compounds from neem (Azadirachta indica) leaves. International Food Research Journal, 18, 931-939. [25] Prakash. O, Talat, M., Hasan, S.H. and Pandey, R.K. (2008) Factorial design for the optimisation of enzymatic detection of cadmium in aqueous solution using immobi- lised urease from vegetable waste. Bioresource Technol- ogy, 99, 7565-7572. [26] Panwal, J.H., Viruthagiri, T. and Baskar, G. (2011) Statis- tical modeling and optimization of enzymatic milk fat splitting by soybean lecithin using response surface methodology. International Journal of Nutrition and Me- tabolism, 3, 50-57. [27] Datta, D. and Kumar, S. (2012) Modeling and optimisa- tion of recovery process of glycolic acid using reactive extraction. International Journal of Chemical Engineer- ing and Applications, 3, 141-146. doi: 10.7763/ijcea.2012.v3.175 [28] Patel, S., Kothari, D. and Goyal, A. (2011) Enhancement of dextransucrase activity of Pediococcus pentosaceus SPAm1 by Response Surface Methodology. Indian Jour- nal of Biotechnology, 10, 346-351. [29] Noordin, M.Y., Venkatesh, V.C., Sharif, S., Elting, S. and Abdullah, A. (2004) Application of response surface methodology in describing the performance of coated carbide tools when turning AISI 1045 steel. Journal of Materials Processing Technology, 145, 46-58. doi: 10.1016/s0924-0136(03)00861-6 [30] Trinh, T.K. and Kang, L.S. (2010) Application of re- sponse surface method as an experimental design to op- timise coagulation tests. Environmental Engineering Re- search, 15, 63-70. doi: 10.4491/eer.2010.15.2.063 [31] Yu, S.-J., Zhang, Y., Li, C.-R., Zhang, Q., Ma, Z.-Y. and Fan, M.-Z. Optimisation of ultrasonic extraction of myce- lia polysaccharides from Paecilomyces hepiali using re- sponse surface methodology and its antioxidant activity. African Journal of Biotechnology, 10, 17241-17250.
|