T. Muthurayar, M. S. Dhanarajan / Agricultur al Sciences 4 (2013) 28-30 29
2.3. Compost Bed Preparation
Organic additives were weighed on fresh weight basis
and added individually. Coir pith was spread and com-
pacted well to get a layer of combination using different
additives such as cow dung, vegetable market waste,
mixed microbial culture, tank slit and poultry waste. 10
mg of Microbial cultures (Inoculation load 1 × 10⁷ Cfu)
was added and a moisture content of 50% - 60% was
maintained. Height of each layer was maintained at a
height of 10 cm. Over this another layer was made with
coir pith. This procedure was repeated an d finally the top
of each cistern was covered with soil slurry. Turning was
given once in every three weeks and required reading
was made periodically. At the end of the 12th week, the
samples were analyzed for their biochemical properties
such as organic carbon, nitrogen, phosphorous and po-
tassium according to the methods of Sadashivam and
Manickam [5] and Jackson [3]. Cellulose and Lignin
content of the samples were determined periodically ac-
cording to the methods of Ververis et al. [7]. The initial
Biochemical composition of raw coir pith is presented in
Tab le 2. The final biochemical constituents were deter-
mined at the end of 12th week according to the protocols
as described earlier.
3. RESULTS
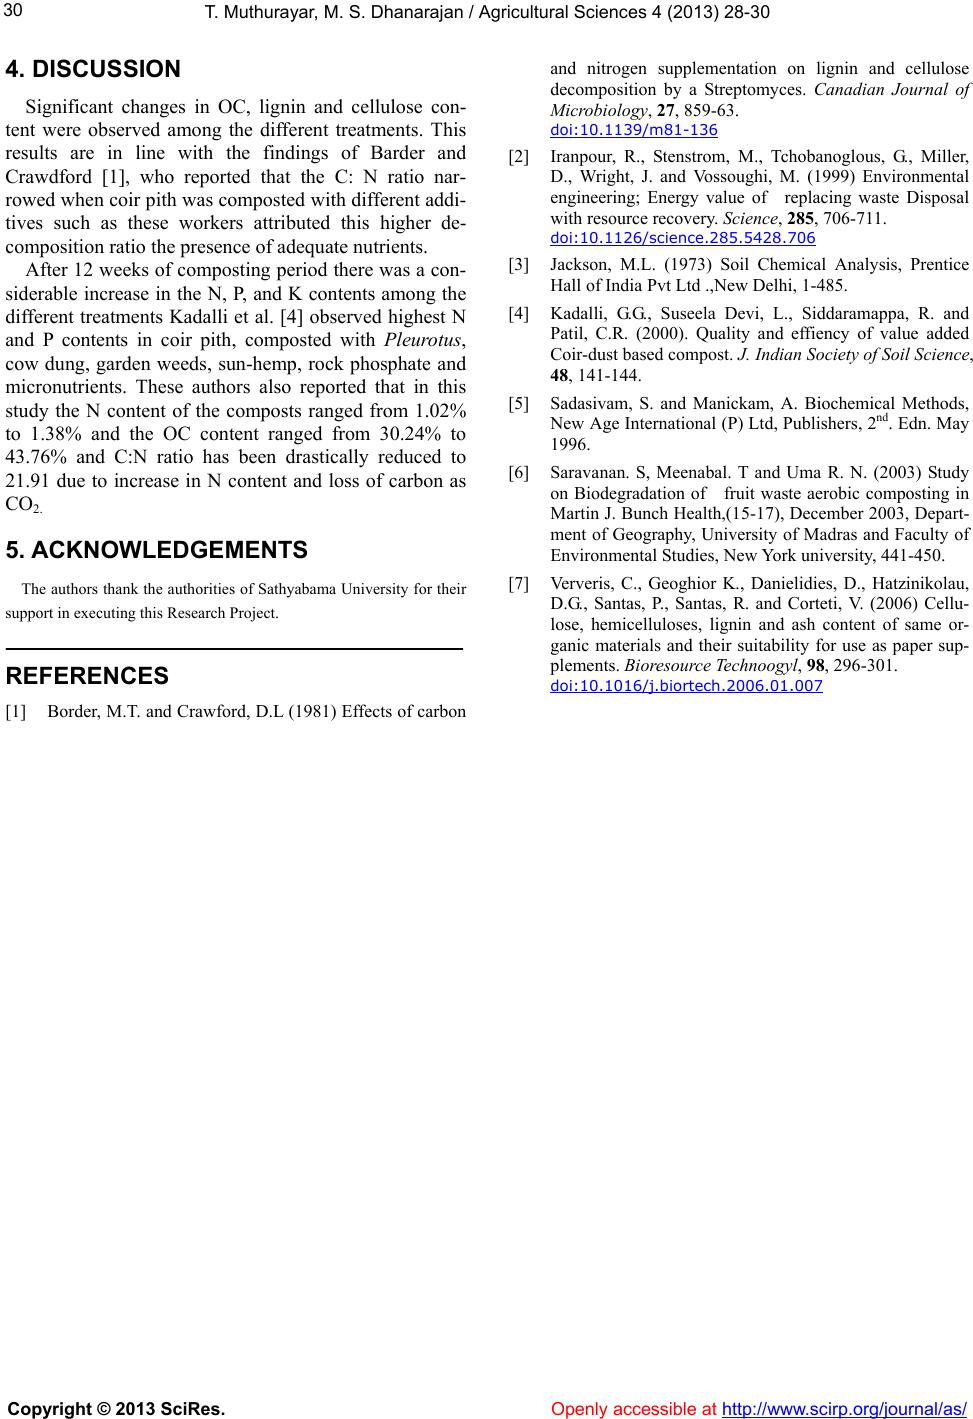
Biochemical composition of raw coir pith was evalu-
ated and presented in Table 1. Raw coir pith recorded
phosphorous, potassium, cellulose and lignin contents of
0.02, 0.30, 35.7 and 54.3%, respectively. The pH was
found to be acidic (5.4) and C: N ratio was found to be
high (162:1).
Changes in the different biochemical constituents such
as C: N ratio, Phosphorous, Potassium, Cellulose, and
lignin contents and pH was recorded at different intervals.
There was a steep decrease in the C: N ratio at the end of
third week and this trend contin ued up to a period of 12th
week. At the end of 12th week in treatment T1, a C: N
ratio of 21.8:1 was observed in the composted coir pith
sample. Irrespective of the observed samples there was a
slight increase in the pH content of samples. Highest pH
of 7.4 was observed in the treatment T3; this was fol-
lowed by T1 and T2 treatments that recorded a pH of 7.2
and 6.7, respectively. There was an increase in the K
content of coir pith as influenced by different treatment
methods. This increase was found to be significantly
higher in all treatments, when compared to control.
Highest K content of 1.2% was recorded in the T1
Treatment. No significant differences in P content were
observed in all treatments, when compared to control
treatment up to a time period of 2 weeks. After a period
of 3 weeks a steep increase in P content was observed.
This increase was found to significantly higher, com-
pared to control. Maximum P content of 0.47% was ob-
served in T1 Treatment, followed by 0.45%, and 0.39%
in T2, and T3, respectively (Table 2).
Cellulose content of all treatments was found to be
significantly decreased at the end of 12 weeks of com-
posting period. However, no significant differences among
different treatments were observed during the entire pe-
riod. At the end of the 12th week of composting period
the cellulose content recorded in T1, T2, and T3 treat-
ments, were 22.8%, 25 .8% and 27.3%, respectively. Lig-
nin content among treatments was found to be signifi-
cantly decreased after 9th week of treatment. At the end
of the composted period of 12th week the lignin content
recorded at different treatments were T1, T2, and T3
were 10.3%, 15.3% and 23.3%.
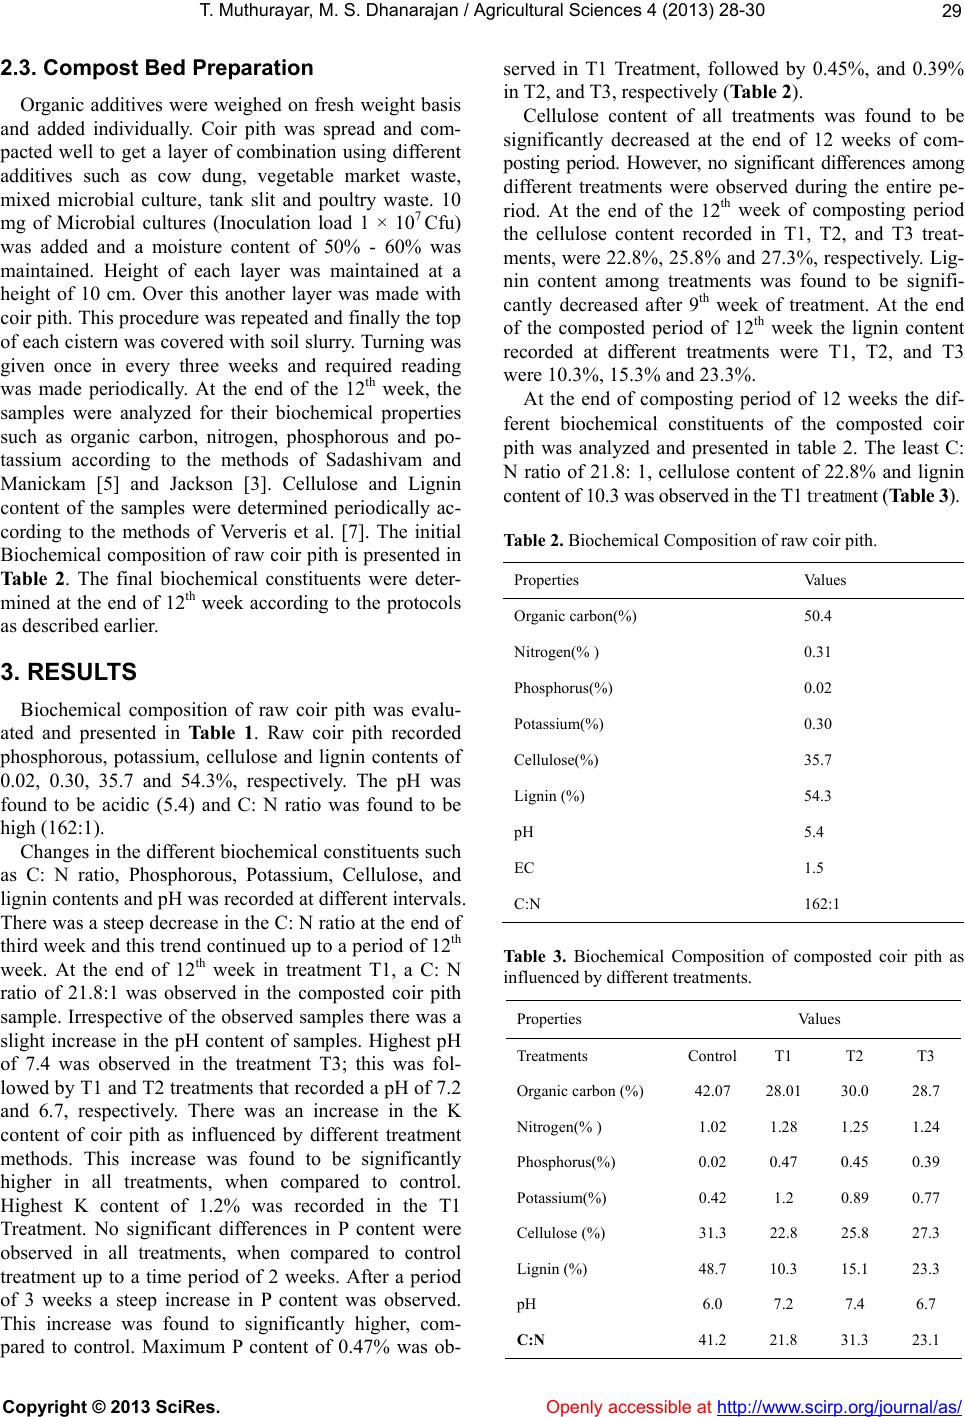
At the end of composting period of 12 weeks the dif-
ferent biochemical constituents of the composted coir
pith was analyzed and presented in table 2. The least C:
N ratio of 21.8: 1, cellulose content of 22.8% and lignin
content of 10.3 was observed in the T1 treatment (Table 3).
Table 2. Biochemical Composition of raw coir pith.
Properties Values
Organic c arbon(%) 50.4
Nitrogen(% ) 0.31
Phosphorus(%) 0.02
Potassium(%) 0.30
Cellulose(%) 35.7
Lignin (%) 54.3
pH 5.4
EC 1.5
C:N 162:1
Table 3. Biochemical Composition of composted coir pith as
influenced by different treatments.
Properties Values
Treatments Control T1 T2 T3
Organic carbon (%) 42.07 28.01 30.0 28.7
Nitrogen(% ) 1.02 1.28 1.25 1.24
Phosphorus(%) 0.02 0.47 0.45 0.39
Potassium(%) 0.42 1.2 0.89 0.77
Cellulose (%) 31.3 22.8 25.8 27.3
Lignin (%) 48.7 10.3 15.1 23.3
pH 6.0 7.2 7.4 6.7
C:N 41.2 21.8 31.3 23.1
Copyright © 2013 SciRes. Openly accessible at http://www.scirp.org/journal/as/