Paper Menu >>
Journal Menu >>
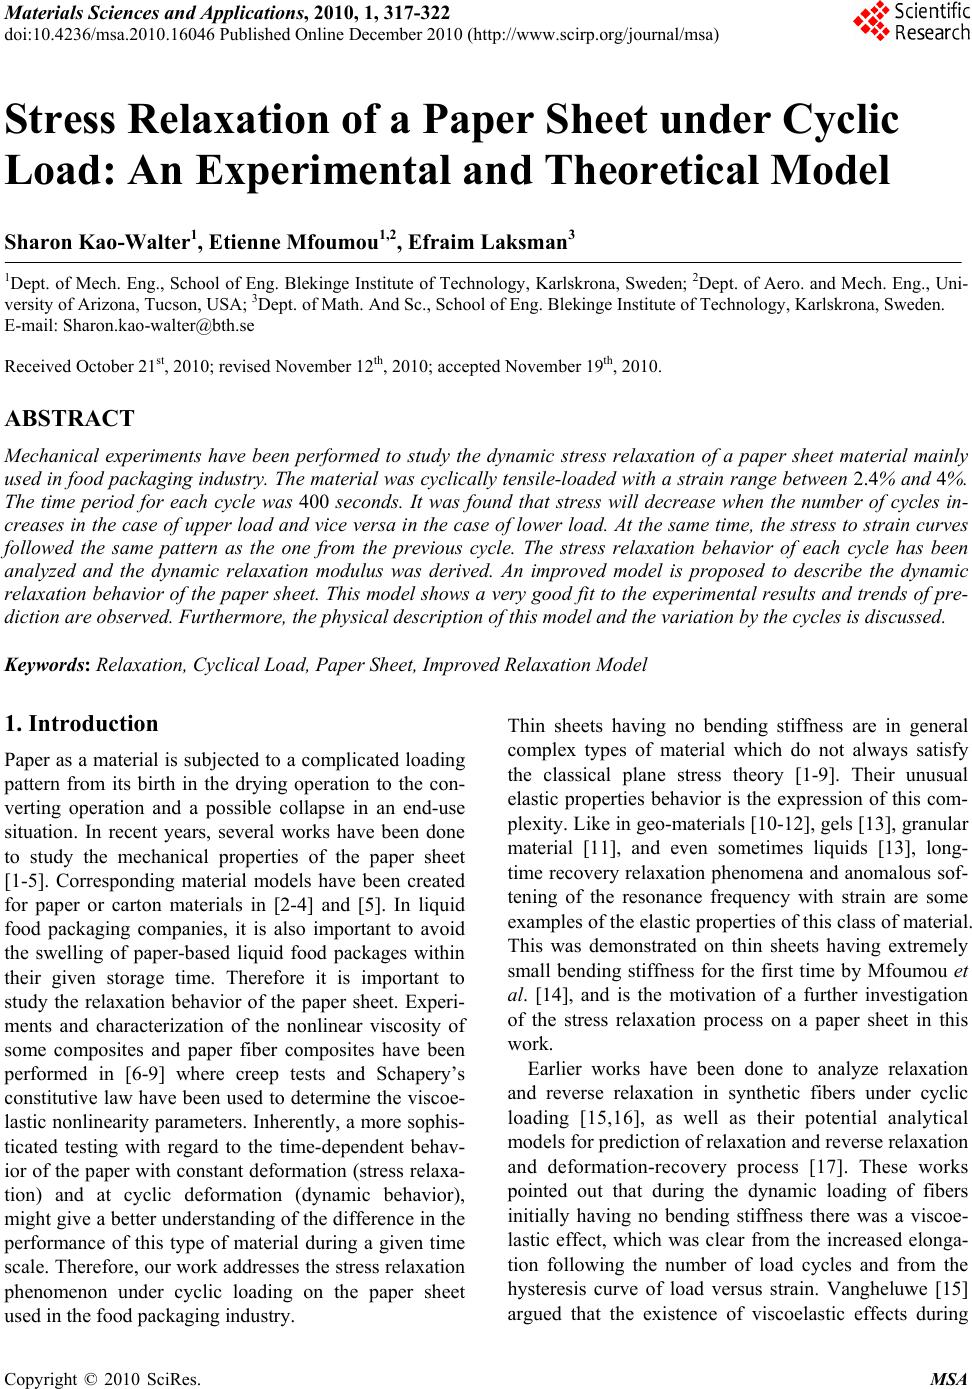 Materials Sciences and Applicatio ns, 2010, 1, 317-322 doi:10.4236/msa.2010.16046 Published Online December 2010 (http://www.scirp.org/journal/msa) Copyright © 2010 SciRes. MSA 317 Stress Relaxation of a Paper Sheet under Cyclic Load: An Experimental and Theoretical Model Sharon Kao-Walter1, Etienne Mfoumou1,2, Efraim Laksman3 1Dept. of Mech. Eng., School of Eng. Blekinge Institute of Technology, Karlskrona, Sweden; 2Dept. of Aero. and Mech. Eng., Uni- versity of Arizona, Tucson, USA; 3Dept. of Math. And Sc., School of Eng. Blekinge Institute of Technology, Karlskrona, Sweden. E-mail: Sharon.kao-walter@bth.se Received October 21st, 2010; revised November 12th, 2010; accepted November 19th, 2010. ABSTRACT Mechanical experiments have been performed to study the dynamic stress relaxation of a paper sheet material mainly used in food packaging industry. The material was cyclically tensile-loaded with a strain range between 2.4% and 4%. The time period for each cycle was 400 seconds. It was found that stress will decrease when the number of cycles in- creases in the case of upper load and vice versa in the case of lower load. At the same time, the stress to strain curves followed the same pattern as the one from the previous cycle. The stress relaxation behavior of each cycle has been analyzed and the dynamic relaxation modulus was derived. An improved model is proposed to describe the dynamic relaxation behavior of the paper sheet. This model shows a very good fit to the experimental results and trends of pre- diction are observed. Furthermore, the physical description of this model and the variation by the cycles is discussed. Keywords: Relaxation, Cyclical Load, Paper Sheet, Improved Relaxation Model 1. Introduction Paper as a material is subjected to a complicated loading pattern from its birth in the drying operation to the con- verting operation and a possible collapse in an end-use situation. In recent years, several works have been done to study the mechanical properties of the paper sheet [1-5]. Corresponding material models have been created for paper or carton materials in [2-4] and [5]. In liquid food packaging companies, it is also important to avoid the swelling of paper-based liquid food packages within their given storage time. Therefore it is important to study the relaxation behavior of the paper sheet. Experi- ments and characterization of the nonlinear viscosity of some composites and paper fiber composites have been performed in [6-9] where creep tests and Schapery’s constitutive law have been used to determine the viscoe- lastic nonlinearity parameters. Inherently, a more sophis- ticated testing with regard to the time-dependent behav- ior of the paper with constant deformation (stress relaxa- tion) and at cyclic deformation (dynamic behavior), might give a better understanding of the difference in the performance of this type of material during a given time scale. Therefore, our work addresses the stress relaxation phenomenon under cyclic loading on the paper sheet used in the food packaging industry. Thin sheets having no bending stiffness are in general complex types of material which do not always satisfy the classical plane stress theory [1-9]. Their unusual elastic properties behavior is the expression of this com- plexity. Like in geo-materials [10-12], gels [13], granular material [11], and even sometimes liquids [13], long- time recovery relaxation phenomena and anomalous sof- tening of the resonance frequency with strain are some examples of the elastic properties of this class of material. This was demonstrated on thin sheets having extremely small bending stiffness for the first time by Mfoumou et al. [14], and is the motivation of a further investigation of the stress relaxation process on a paper sheet in this work. Earlier works have been done to analyze relaxation and reverse relaxation in synthetic fibers under cyclic loading [15,16], as well as their potential analytical models for predi c t i on of rel a x a t i on and reverse relaxati o n and deformation-recovery process [17]. These works pointed out that during the dynamic loading of fibers initially having no bending stiffness there was a viscoe- lastic effect, which was clear from the increased elonga- tion following the number of load cycles and from the hysteresis curve of load versus strain. Vangheluwe [15] argued that the existence of viscoelastic effects during 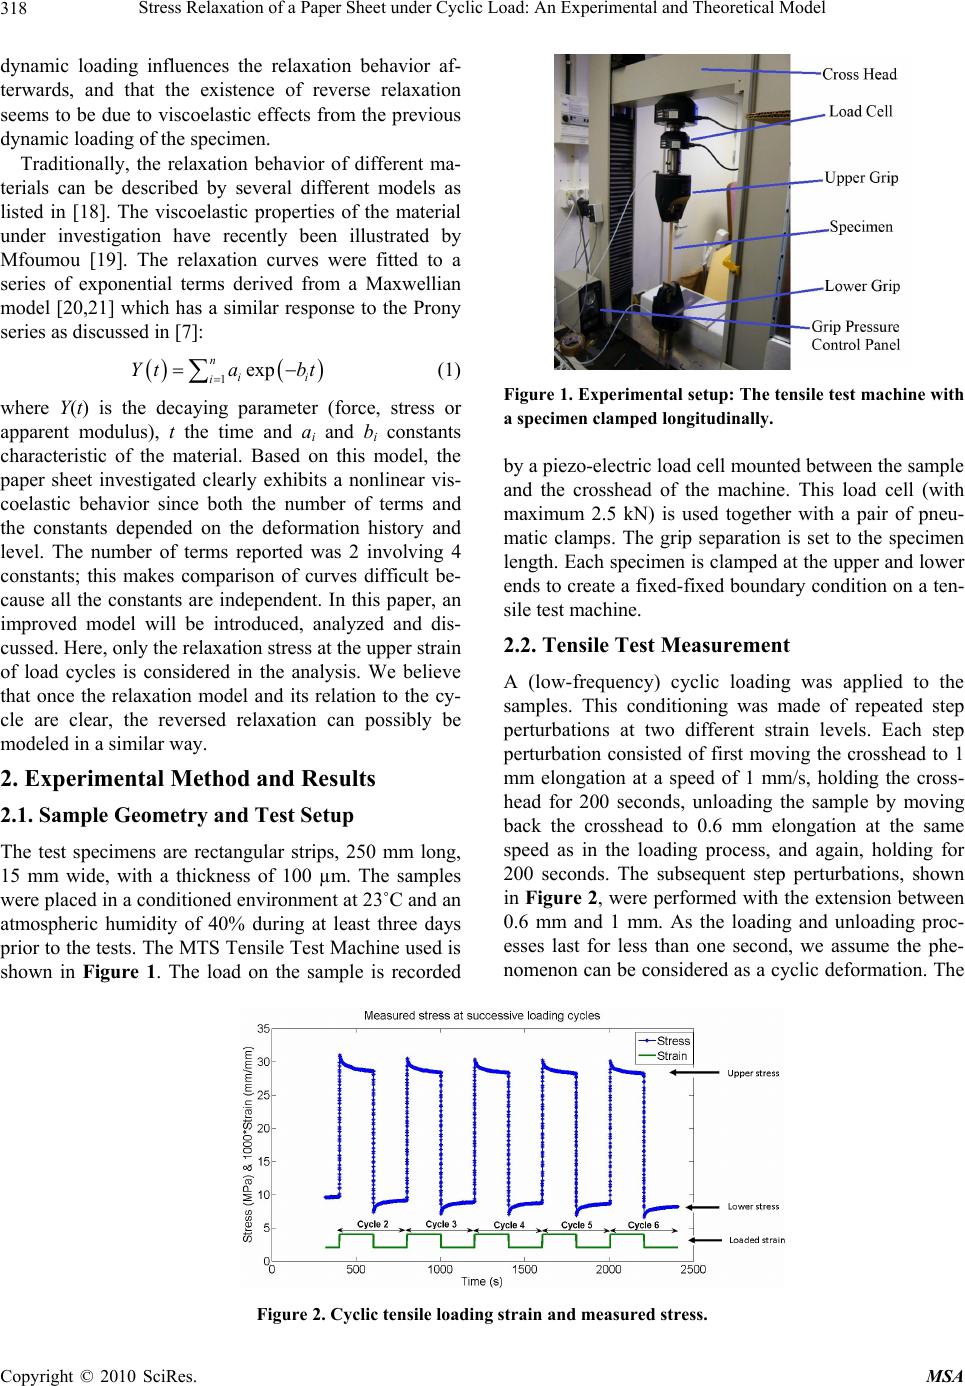 Stress Relaxation of a Paper Sheet under Cyclic Load: An Experimental and Theoretical Model 318 dynamic loading influences the relaxation behavior af- terwards, and that the existence of reverse relaxation seems to be due to viscoelastic effects from the previous dynamic loading of the specimen. Traditionally, the relaxation behavior of different ma- terials can be described by several different models as listed in [18]. The viscoelastic properties of the material under investigation have recently been illustrated by Mfoumou [19]. The relaxation curves were fitted to a series of exponential terms derived from a Maxwellian model [20,21] which has a similar response to the Prony series as discussed in [7]: () ( 1exp n i i Yta bt = = ∑ ) i − (1) where Y(t) is the decaying parameter (force, stress or apparent modulus), t the time and ai and bi constants characteristic of the material. Based on this model, the paper sheet investigated clearly exhibits a nonlinear vis- coelastic behavior since both the number of terms and the constants depended on the deformation history and level. The number of terms reported was 2 involving 4 constants; this makes comparison of curves difficult be- cause all the constants are independent. In this paper, an improved model will be introduced, analyzed and dis- cussed. Here, only the relaxation stress at the upper strain of load cycles is considered in the analysis. We believe that once the relaxation model and its relation to the cy- cle are clear, the reversed relaxation can possibly be modeled in a similar way. 2. Experimental Method and Results 2.1. Sample Geometry and Test Setup The test specimens are rectangular strips, 250 mm long, 15 mm wide, with a thickness of 100 µm. The samples were placed in a conditioned environment at 23˚C and an atmospheric humidity of 40% during at least three days prio r to the t ests. Th e MTS Tensile Test Machine used is shown in Figure 1. The load on the sample is recorded Figure 1. Experime ntal setup: The tensile test machine with a specimen clamped longitudinally. by a piezo-electric load cell mounted between the sample and the crosshead of the machine. This load cell (with maximum 2.5 kN) is used together with a pair of pneu- matic clamps. The grip separation is set to the specimen length. Each specimen is clamped at the upper and lower ends to create a fixed-fixed boundary condition on a ten- sile test machine. 2.2. Tensile Test Measurement A (low-frequency) cyclic loading was applied to the samples. This conditioning was made of repeated step perturbations at two different strain levels. Each step perturbation consisted of first moving the crosshead to 1 mm elongation at a speed of 1 mm/s, holding the cross- head for 200 seconds, unloading the sample by moving back the crosshead to 0.6 mm elongation at the same speed as in the loading process, and again, holding for 200 seconds. The subsequent step perturbations, shown in Figure 2, were performed with the extension between 0.6 mm and 1 mm. As the loading and unloading proc- esses last for less than one second, we assume the phe- nomenon can be considered as a cyclic deformation. The Figure 2. Cyclic tensile loading strain and measured stress. Copyright © 2010 SciRes. MSA 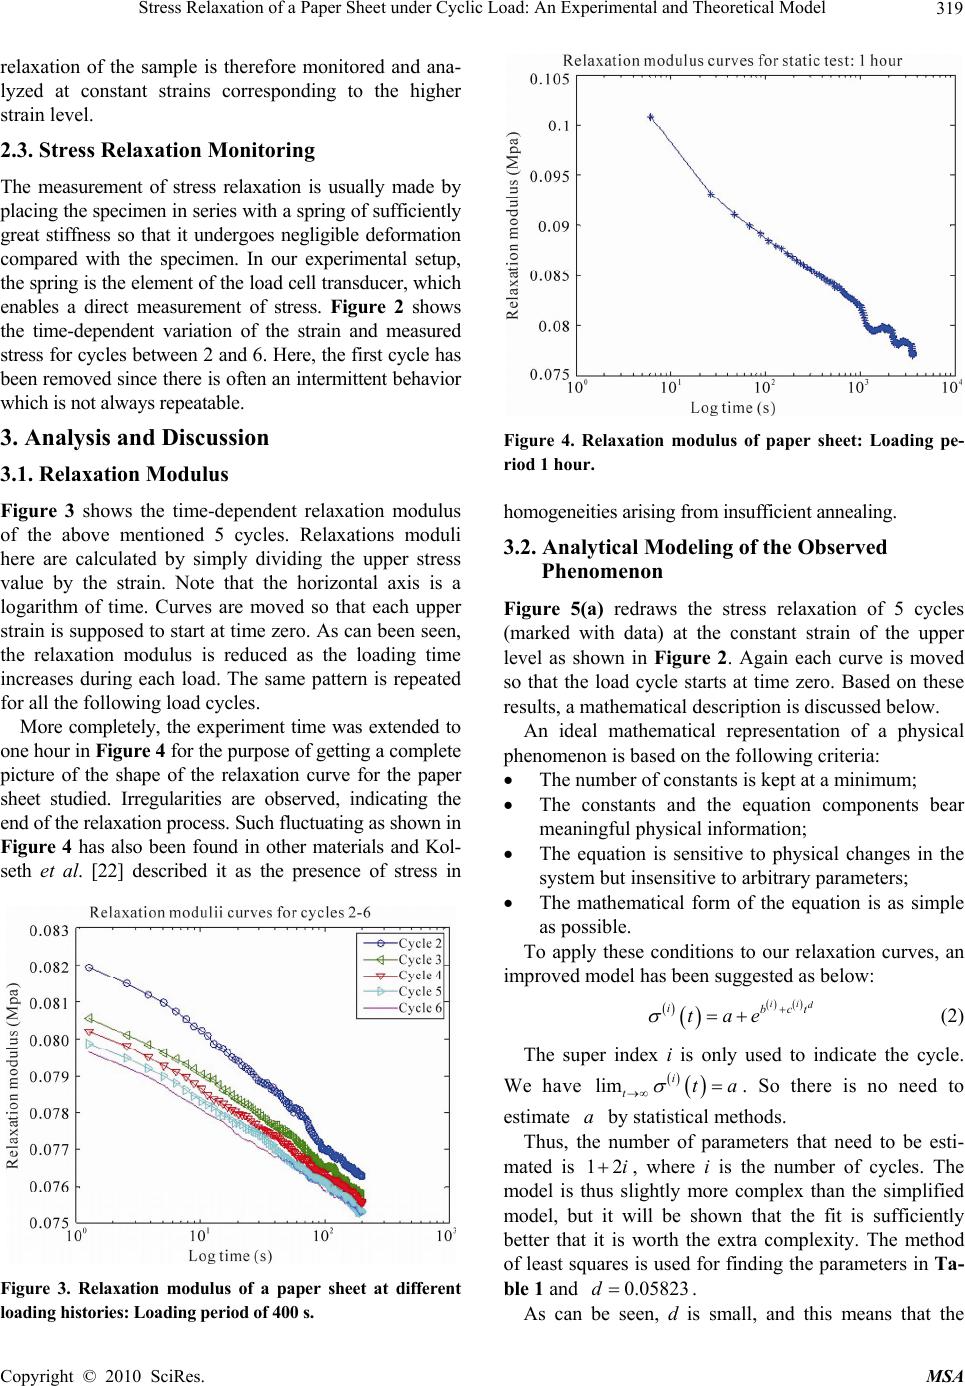 Stress Relaxation of a Paper Sheet under Cyclic Load: An Experimental and Theoretical Model 319 relaxation of the sample is therefore monitored and ana- lyzed at constant strains corresponding to the higher strain level. 2.3. Stress Relaxation Monitoring The measurement of stress relaxation is usually made by placing the specimen in series with a spring of sufficiently great stiffness so that it undergoes negligible deformation compared with the specimen. In our experimental setup, the spring is the element of the load cell transducer, which enables a direct measurement of stress. Figure 2 shows the time-dependent variation of the strain and measured stress for cycles between 2 and 6. Here, the first cycle has been removed since there is often an intermittent behavior which is not always repeatable. 3. Analysis and Discussion 3.1. Relaxation Modulus Figure 3 shows the time-dependent relaxation modulus of the above mentioned 5 cycles. Relaxations moduli here are calculated by simply dividing the upper stress value by the strain. Note that the horizontal axis is a logarithm of time. Curves are moved so that each upper strain is supposed to start at time zero. As can been seen, the relaxation modulus is reduced as the loading time increases during each load. The same pattern is repeated for all the following load cycles. More completely, the experiment time was extended to one hour in Figure 4 for the purpose of getting a complete picture of the shape of the relaxation curve for the paper sheet studied. Irregularities are observed, indicating the end of the relaxation process. Such fluctuating as shown in Figure 4 has also been found in other materials and Kol- seth et al. [22] described it as the presence of stress in Figure 3. Relaxation modulus of a paper sheet at different loading histories: Loading period of 400 s. Figure 4. Relaxation modulus of paper sheet: Loading pe- riod 1 hour. homogeneities arising from insufficient annealing. 3.2. Analytical Modeling of the Observed Phenomenon Figure 5(a) redraws the stress relaxation of 5 cycles (marked with data) at the constant strain of the upper level as shown in Figure 2. Again each curve is moved so that the load cycle starts at time zero. Based on these results, a mathematical description is discussed below. An ideal mathematical representation of a physical phenomenon is based on the following criteria: • The number of constants is kept at a minimum; • The constants and the equation components bear meaningful physical information; • The equation is sensitive to physical changes in the system but insensitive to arbitrary parameters; • The mathematical form of the equation is as simple as possible. To apply these conditions to our relaxation curves, an improved model has been suggested as below: () () () () ii d ibct tae σ + =+ (2) The super index i is only used to indicate the cycle. We have () () lim i tta σ →∞ = . So there is no need to estimate by statistical methods. a Thus, the number of parameters that need to be esti- mated is 12i + , where i is the number of cycles. The model is thus slightly more complex than the simplified model, but it will be shown that the fit is sufficiently better that it is worth the extra complexity. The method of least squares is used for finding the parameters in Ta- ble 1 and 0.05d823 = . As can be seen, d is small, and this means that the Copyright © 2010 SciRes. MSA 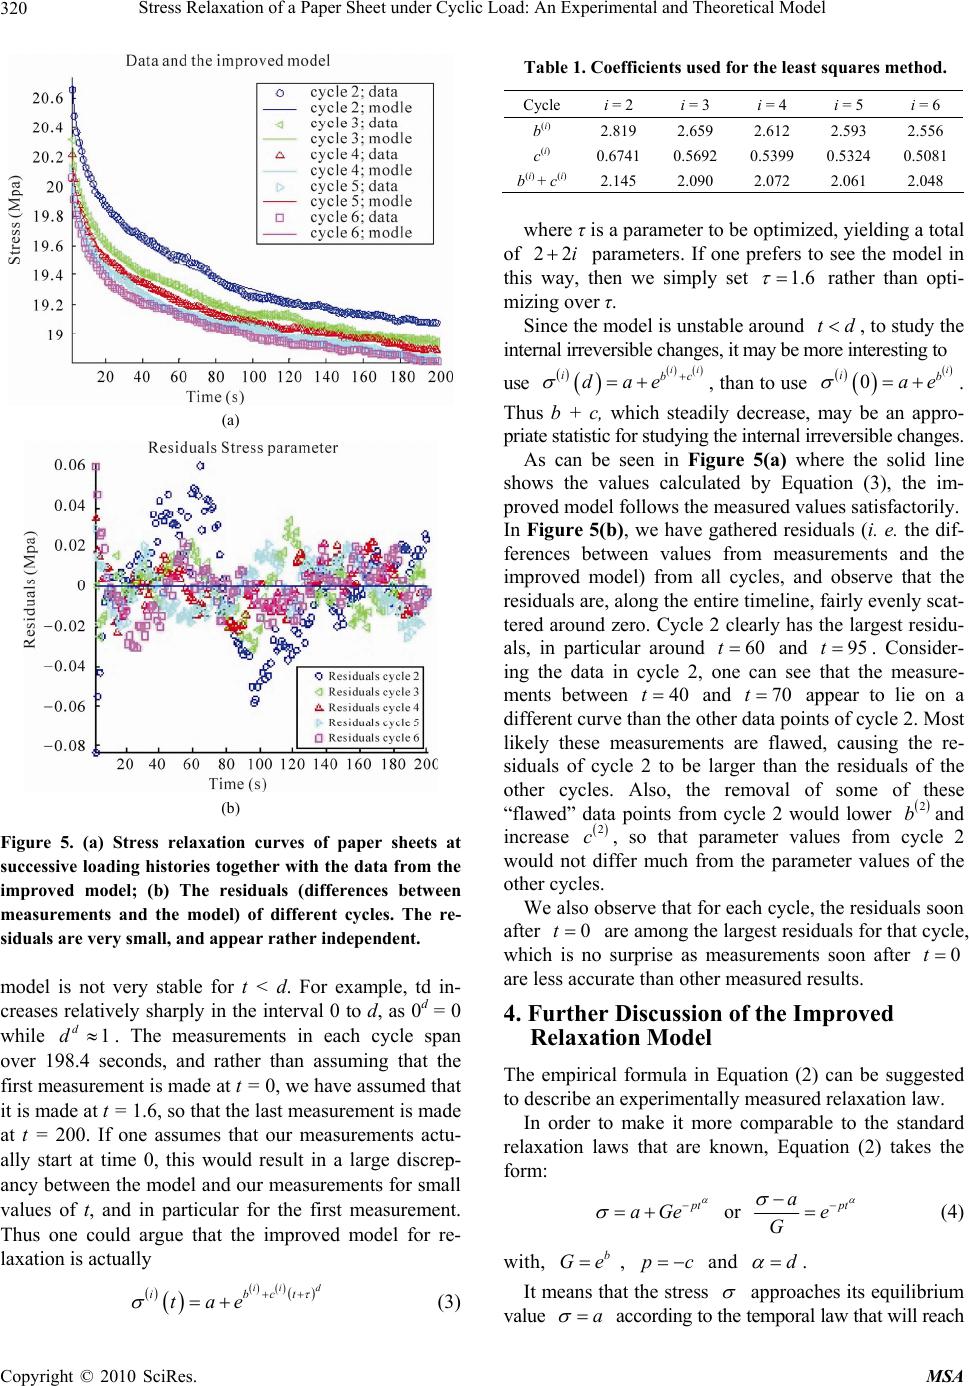 Stress Relaxation of a Paper Sheet under Cyclic Load: An Experimental and Theoretical Model 320 (a) (b) Figure 5. (a) Stress relaxation curves of paper sheets at successive loading histories together with the data from the improved model; (b) The residuals (differences between measurements and the model) of different cycles. The re- siduals are very small, and appear rather independent. model is not very stable for t < d. For example, td in- creases relatively sharply in the interval 0 to d, as 0d = 0 while . The measurements in each cycle span over 198.4 seconds, and rather than assuming that the first measurement is made at t = 0, we have assumed that it is made at t = 1.6, so that the last measurement is made at t = 200. If one assumes that our measurements actu- ally start at time 0, this would result in a large discrep- ancy between the model and our measurements for small values of t, and in particular for the first measurement. Thus one could argue that the improved model for re- laxation is actually 1 d d≈ () () () () () d ii ibc tae Table 1. Coefficients used for the least squares method. Cycle i = 2 i = 3 i = 4 i = 5 i = 6 b(i) 2.819 2.659 2.612 2.593 2.556 c(i) 0.6741 0.5692 0.5399 0.5324 0.5081 b(i) + c(i)2.145 2.090 2.072 2.061 2.048 where τ is a parameter to be optimized, yielding a total of 22i + parameters. If one prefers to see the model in this way, then we simply set 1.6 τ = rather than opti- mizing over τ. Since the model is unstable around , to study the internal irreversible changes, it m ay be more interesti ng to td< use , than to use . Thus b + c, which steadily decrease, may be an appro- priate statistic for studying the internal irreversible changes. () () () () ii ibc dae σ + =+ () () 0 i σ =+ () i b ae As can be seen in Figure 5(a) where the solid line shows the values calculated by Equation (3), the im- proved model follows the measured values satisfactorily. In Figure 5(b), we have gathered residuals (i. e. the dif- ferences between values from measurements and the improved model) from all cycles, and observe that the residuals are, along the entire timeline, fairly evenly scat- tered around zero. Cycle 2 clearly has the largest residu- als, in particular around and . Consider- ing the data in cycle 2, one can see that the measure- ments between 60t=95t= 40t = and appear to lie on a different curve than the other data points of cycle 2. Most likely these measurements are flawed, causing the re- siduals of cycle 2 to be larger than the residuals of the other cycles. Also, the removal of some of these “flawed” data points from cycle 2 would lower and increase , so that parameter values from cycle 2 would not differ much from the parameter values of the other cycles. 70t= () 2 b () 2 c We also observe that for each cycle, th e residuals soon after 0t = are among the largest residuals for that cycle, which is no surprise as measurements soon after 0t = are less accurate than other measured results. 4. Further Discussion of the Improved Relaxation Model The empirical formula in Equation (2) can be suggested to describe an experimentally measured relaxation law. In order to make it more comparable to the standard relaxation laws that are known, Equation (2) takes the form: p t aGe α σ − =+ or p t ae G α σ − −= (4) with, , b Ge=pc = − and d α =. It means that the stress σ approaches its equilibrium value a σ = ac cording to th e tempo ral law that w ill reach t τ σ ++ =+ (3) Copyright © 2010 SciRes. MSA  Stress Relaxation of a Paper Sheet under Cyclic Load: An Experimental and Theoretical Model 321 one at . On the side, at t = 0, t→∞ α pt e−aG σ = +. Notice that this relaxation law in Equation (4) differs significantly from the standard relaxation law (see [23-25]): t T aGe σ − =+ or t T ae G σ − −= (5) which satisfies the ordinary differential equation: d dt T σσ a − =− (6) As it is known, T is the “relaxation time”, a is the “equilibrium stress” and is the initial stress. aG+ To reconstruct the differential equation of type Equation (6) by empirical relaxation law, Equation (4) is differentiated to get: () 1 a d dt t p α σ σ α − − =−⎛⎞ ⎜⎟ ⎝⎠ (7) Comparing this equation with Equation (6), we can conclude that formally the governing equation is the same. But the relaxation time is now time-dependent. Now define: () 1 t TTtp α α − ⎛⎞ == ⎜⎟ ⎝⎠ (8) Equation (7) can be rewritten by a similar way as Equa- tion (6). As discussed before, 1 α is the characteristic time that increases with an increase in “physical time” t. If formally 1 α = in Equation (8), the equation will reduce to 11. Tcon p == st Consequently, at 1 α =, our empirical law transforms to the usual one as in Equation (5) in which . 11 TT p == Correspondingly, the Equation (7) transforms to Equa- tion (6). We can come to two important conclusions as follows from this consideration: 1) () 11Tt Tp=, because we know 1 α . This means that the relaxation of the paper sheet is much slower than the usual relaxation process as soon as t α . 2) () Tt increases with time as can be seen by Equa- tion (8). This means that the more time that has passed since the beginning of the process, the slower will the stress/tension of the paper decrease/relax. The second form of governing equation can now be derived which does not contain time t in the coefficients. Rewriting Equation (4) as: 1 ln ln lnln apt G at G α σ σα − −=− ⎛⎞ − ⎛⎞ = ⎜⎟ ⎜⎟ ⎜⎟ ⎝⎠ ⎝⎠ (9) After differentiation on time t, we get: ln ln ln G dG a dt a σασ ⎛ −=⎜ − ⎝⎠ ⎞ ⎟ (10) or lndY Y d α ξ = (11) where ln, ln G Yt a ξ σ == − This logarithmic dependence on time indicates a slow- ness of the relaxation process. 5. Conclusions From the experimental tests and theoretical modeling it can be concluded that: • The paper sheet clearly shows the relaxation be- havior. This behavior cannot be described by the well known Maxwell model since its relaxation is much slower than the usual relaxation process in materials like metals. • Paper relaxation, moreover, demonstrates the presence of a wide spectrum of relaxation time. • The relaxation modulus is reduced by the loading time and loading cycles with the same pattern. This can be explained by the nonlinearity of the stress and strain relation of the paper sheet. • An improved relaxation model: p t ae G α σ − −= shows very close correspondence with the experi- mental results and its governing equation is similar to that of the Maxwell model but with variable re- laxation time. • This model can also describe the behavior of the material under a wide range of material condition- ing (loading levels) without becoming inconsis- tent. • The main characteristic of the improved model is that the parameters play a major role in the overall response of the material. One of the important ad- vantages is the possibility to anticipate the asymp- Copyright © 2010 SciRes. MSA  Stress Relaxation of a Paper Sheet under Cyclic Load: An Experimental and Theoretical Model Copyright © 2010 SciRes. MSA 322 totic limiting value at which the stress will tend at infinite time. 6. Acknowledgements The authors would like to thank Professor Oleg Rudenko and Professor Claes Hedberg for valuable discussions during the work. The Swedish Foundation for Knowl- edge and Competence Development and Blekinge Insti- tute of Technology in Sweden are acknowledged for their financial support. REFERENCES [1] J. Tryding, “In-Plane Fracture of Paper,” Ph.D. Thesis, Lund University, Lund, 1996. [2] Q. S. Xia, M. C. Boyce and D. M. Parks, “A Constitutive Model for the Anisotropic Elastic-Plastic Deformation of a Paper and Paperboard,” International Journal of Solids and Structures, Vol. 39, No. 15, 2002, pp. 4053-4071. [3] M. K. Ramasubramanian, Y. Y. Wang, “Constitutive Models for Paper and Other Ribbon-Like Nonwov- ens—A Literature Review,” In: R. Perkins, Ed., Me- chanics of Cellulosic Materials, The American Society of Mechanical Engineers, New York, 1999, pp. 31-42. [4] G. A. Baum, D. C. Brennan and C. C. Habeger, “Orthotropic Elastic Constants of Paper,” Tappi Journal, Vol. 64, No. 8, 1981, pp. 97-101. [5] P. Mäkelä and S. Östlund, “Orthotropic Elastic-Plastic Material Model for Paper Materials,” International Jour- nal of Solids and Structures, Vol. 40, No. 21, 2003, pp. 5599-5620. [6] A. DeMaio and T. Patterson, “Similarities in Bonding Influence between Pre-Failure Tensile Creep and Stress-Strain Behavior of Paper,” Mechanics of Materials, Vol. 40, 2008, pp. 133-149. [7] L. O. Nordin and J. Varna, “Nonlinear Viscoelastic Be- havior of Paper Fiber Composites,” Composites Science and Technology, Vol. 65, 2005, pp. 1609-1625. [8] R. M. Guedes, A. T. Marwues and A. Cardon, “Analyti- cal and Experimental Evaluation of Nonlinear Viscoelas- tic-Viscoplastic Composite Laminates under Creep, Creep-Recovery, Relaxation and Ramp Loading” Me- chanics of Time-Depend Materials, Vol. 2, 1998, pp. 113- 128. [9] M. Megnis and J. Varna, “Micromechanics Based Mod- eling of Nonlinear Viscoplastic Response of Unidirec- tional Composite,” Composites Science and Technology, Vol. 63, 2003, pp. 19-31. [10] J. A. TenCate and T. J. Shankland, “Slow Dynamics in the Nonlinear Response of Berea Sandstone,” Geophysics Research Letters, Vol. 23, 1996, pp. 3019-3022. [11] J. A. TenCate, E. Smith and R. A. Guyer, “Universal Slow Dynamics in Granular Solids,” Geophysical Re- search Letters, Vol. 85, No. 5, 2000, pp. 1020-1023. [12] P. A. Johnson, B. Zinszer and P. N. J. Rasolofosaon, “Resonance and Elastic Nonlinear Phenomena in Rock,” Journal of Geophysical Research, Vol. 101, 1995, pp. 11553-11564. [13] K. Trachenko, “Slow Dynamics and Stress Relaxation in a Liquid as an Elastic Medium,” Physical Review B, Vol. 75, 2007, pp. 212-201. [14] E. Mfoumou, K. Haller, C. Hedberg and S. Kao-Walter, “Slow Dynamics Experiments on Thin Sheets,” Pro- ceedings of the V Iberian Congress of Acoustics, XXXIX Spanish Congress of Acoustics TECNICACUSTICA 2008, and the European Symposium of Acoustics, Coimbra, 2008, ID-197. [15] L. Vangheluwe, “Relaxation and Inverse Relaxation of Yarns after Dynamic Loading,” Textile Research journal, Vol. 63, No. 9, 1993, pp. 552-556. [16] R. Milasius, D. Milasiene and V. Jankauskaite, “Investi- gation of Stress Relaxation of Breathable-Coated Fabric for Clothing and Footwear,” Fibres & Textiles in Eastern Europe, Vol. 11, No. 2, 2003, p. 41. [17] A. G. Makarov and A. M. Stalevich, “Prediction of Re- verse Relaxation and Deformation-Recovery Processes in Synthetic Fibres,” Fibre Chemistry, Vol. 34, No. 6, 2002, 448-451. [18] R. Rajdip. and Q. Lu, “Stress Relaxation Study of Paper and Plastic Film Based Packaging Material,” Master’s Thesis, Blekinge Institute of Technology, Karlskrona 2009. [19] E. Mfoumou, “Low Frequency Acoustic Excitation and Laser Sensing of Vibration as a Tool for Remote Charac- terization of Thin Sheets,” Ph.D. Thesis, Blekinge Insti- tute of Technology, Karlskrona, 2008. [20] P. Sherman, “Industrial Rheology,” Academic Press, New York, 1970. [21] N. N. Mohsenin, “Physical Properties of Plant and Ani- mal Materials,” Breach Science Publishers 1, New York, 1970. [22] P. Kolseth and A. de Ruvo, “Swedish Forest Products Research Laboratory,” Unpublished results. [23] R. E. Mark, “Handbook of Physical and Mechanical Testing of Paper and Paperboard,” Dekker, New York, 1983. [24] E. N. Laowrence and R. F. Landel, “Mechanical Proper- ties of Polymers and Composites,” 2nd Edition, Marcel Dekker, New York, 1994. [25] Wikipedia, “Viscoelasticity,” 2010. http://en.wikipedia. org/wiki/Viscoelasticity. |