 Vol.4, No.5B, 12-20 (2013) Agricultural Sciences doi:10.4236/as.2013.45B003 Economic and environmental sustainability assessment of wine grape production scenarios in Southern Italy Alfio Strano, Anna Irene De Luca*, Giacomo Falcone, Nathalie Iofrida, Teodora Stillitano, Giovanni Gulisano Department of AGRARIA, Mediterranean University of Reggio Calabria, Reggio Calabria, Italy; *Corresponding Author: anna.deluca@unirc.it Received 2013 ABSTRACT The low resilience of ecosystems imposes a sus- tainable management of natural resources through more rational use s, la nd pro tec ti on, en er gy sav ing and low carbon production technologies. Agri- culture has a great responsibility in managing these resources that are the principal inputs of its processes. Production systems must pay attention, at the same time, to ec onomic viability and environmental protection. Since decades, the international scientific community is facing the great challenge of assessing the sustain- ability of agricultural engineering techniques, in order to help both private and public decision making, but also to meet consumer’s require- ments for high quality and low impact products. To achieve that, widely accepted assessment instruments, w hose results have to be clear and understandable to a broad public, and that are necessary. In this direction, Life Cycle Thinking (LCT) is gaining consensus as conceptual model, considering goods and services produc- tion and consumption all along the whole life cycle, from planning to disposal. Its methodo- logical frame- work, the Life Cycle Management (LCM), offers many standardised tools to assess impacts of products and processes: Life Cycle Assessment (LCA), to evaluate environmental impacts and Life Cycle Costing (LCC) for eco- nomic ones. Among many impacts categories LCA also allows to identify the carbon footprint, that can be quantified in terms of Global Warm- ing Potential (GWP). This re-search has ana- lyzed and compared different scenarios of wine grapes production in Cirò, an important viticul- tural area located in Calabria region (Southern Italy). LCA and LCC methodologies have been useful to assess them from an environmental and economic standpoint. Results have allowed the authors to rank training and farming sys- tems performances. Keywords: Life Cycle Assessment (LCA); Life Cycle Costing ( LCC); Sus tainable agriculture; Decision Ma kin g; Glob al Warming; CO2 Equivalents 1. INTRODUCTION Anthropic activities are the principal responsible for the depletion of natural resources, because exploitations are carried out faster than the ability of ecosystems to regenerate themselves. The results are global warming, loss of biodiversity, exhaustion of energy resources, pol- lution and wastes production that lead, in the long run, to social and economic consequences too. There is a grow- ing interest in knowledge acquisition about how to measure impacts and how to relate them to their causes, such as carbon footprint for global warming and climate change. The assessment of environmental and economic sus- tainability relating to a product or a process is a high concern for many stakeholders, e.g. public deciders, farmers, entrepreneurs and consumers. According to [1], agriculture and food production are one of the principal responsible for environmental im- pacts and natural resources overexploitation. In this sense, it is preferable to carry out a farm management which combines carbon capture and emissions reduction considering several farming phases like grazing and fer- tilizing, tillage, crops alternation, harvesting and so on [2]. Today more than ever, new methodological approaches are required for management and decision making to meet consumers’ needs for high quality and healthy products, and entrepreneurs’ necessity of economic vi- ability, using natural resour ces rationally. Copyright © 2013 SciRes. Openly accessible at http://www.scirp.org/journal/as/  A. Strano et al. / Agricultural Sciences 4 (2013) 12-2 0 13 In this way, Life Cycle Management (LCM) is gaining great consensus as methodological framework helpful to decrease footprints, add value to products (i.e. goods or services) or supply chains and improve th e sustainability performance of a business or organization. These tools enable the evaluation of all production phases, “from cradle to grave”, in order to understand how to make them more compatible with environment, economics and society. The purpose of this study moves from the necessity to know how to use natural resources in a more rational way, and how to farm saving energy, protecting land and reducing carbon footprint. It is focused on four different productive scenarios in the viticultural area of Cirò, in Calabria region (Southern Italy). Grapevine production has been analyzed from both an economic and environmental standpoint through Life Cycle Costing (LCC) and Life Cycle Assessment (LCA) methodologies. Results have allowed to make comparisons and to rank performances of each scenario for every field of study. Findings of this study highlighted the possible effective- ness of the joint use of LCA and LCC, and that they can be a useful decision making instrument for both public and private deciders. 2. METHODOLOGICAL BACKGROUND The widely accepted definition of sustainable devel- opment was given by the commonly known Brundtland Report in 1987 “Our common future”, that described it as the “development that meets the needs of the present without compromising the abilit y of future generation s to meet their own needs” [3]. According to this definition, sustainability is achieved through the in tegration of three interrelated features such as social equity, economic viability and environmental protection. In this sense, global warming and climate change are a high concern that putted the attention to the necessity of low carbon human activities, which main indicator is “carbon footprint” [4] that measures human activities impacts on global climate [5]. A new conceptual model, called Life Cycle Thinking (LCT), has arisen from the necessity to deepen the knowledge about all the impacts (i.e. environmental im- pacts, economic and social ones) that products and ser- vices generate during every stage of their life cycle, “from cradle to grave”, or rather, from planning to dis- posal, taking into account all inputs and outputs of re- source and energy [6]. Many methodological tools have been developed to achieve this goal, such as LCA and LCC for environ- mental and economic sustainability assessment. They belong to a toolbox named LCM, which is the methodo- logical framework that can help public deciders, entre- preneurs and managers addressing their activities in a more sustainable way. The LCM multidisciplinary ap- proach have been successfully used in food production [7,8], a sector that notoriously has a strong environ- mental impact and often a low profitability. 2.1. Life Cycle Assessment The Society of Environmental Toxicology and Chem- istry (SETAC) defined LCA as “an objective process to evaluate the environmental burdens associated to a product, a process, or an activity by identifying energy and materials usage and environmental releases, and to evaluate opportunities to achieve environmental im- provements” [9]. These improvements can be measured in order to un- derstand which useful changes should be adopted during the life cycle of a product (good or service). The Interna- tional Organization for Standardization (ISO) has pub- lished international standards ISO 14040-14044 about principles, framework and requirements for a correct use of LCA [10,11]. Several categories of impact are taken into account, and among them, climate change is evaluated in terms of Global Warming Potential (GWP), i.e. greenhouse gases emissions in CO2 equivalents, as suggested by the Inter- governmental Panel on Climate Change (IPCC) [12]. It is well known that carbon dioxide, with others greenhouse gases, is responsible for global warming; the overall amount of CO2 and other greenhouse gas emissions as- sociated to a product along its lifecycle is commonly known as carbon footprint [4], for which LCA provides requirements for performing transparent and widely ac- cepted calculations [12,13]. According to [10,14], the four steps to implement a LCA study are the following: a) Goal and scope definition. It means defining: field of application, addressees, functions of the object to be assessed, functional equivalent for comparing assertions, system boundaries and procedures of allocation, choice of environmental impact categories and methodologies for their interpretation, data requirements and quality, source, assumptions and limitations, critical review, re- port format; b) Life Cycle Inventory (LCI). This second step con- sists of qualitative and quantitative data collection, cal- culation of incoming and exiting flows (e.g. energy, ma- terials and emissions) and validation. LCI is an iterative process, so a re vi ew of procedures or goals may occur; c) Life Cycle Impact Assessment (LCIA). It consists of quantifying potential environmental impacts, through three sub-steps: selection of impact categories, category indicators and characterisation models; classification in impact categories; impact measurement by characterisa- tion. Optional analysis-normalisation, grouping and weighting-and evaluation of indicators results reliability Copyright © 2013 SciRes. Openly accessible at http://www.scirp.org/journal/as/  A. Strano et al. / Agricultural Sciences 4 (2013) 12-2 0 14 - importance, uncertainty and sensitiv ity - can be useful; d) Life cycle interpretation of results. It highlights hot spots and allows formulating conclusions and helpful recommendations for deciders, which is the reason why LCA can be a valuable decision support system. Regarding the application of LCA to food farming, some examples have been found in literature [15-17] among which empirical studies on viticulture activities, such as wine production, including agricultural phases. 2.2. Life Cycle Costing At its origins, LCC was an instrument of management accountability to assess investments that did not take into account environmental costs [18,19]. But as sustainabil- ity entails managing the integration of different issues (i.e. environmental issues, economic and social ones), more specific tools are required to measure and to evalu- ate both environmental and economic feasibility of changes and renovations that occur during the life cycle of a product [20]. An example is the so-called LCA-type LCC [21] or Environmental LCC, based on the assess- ment of all kind of costs during life cycle afforded by every involved actor, including long run externalities. However, to be effective, LCC has to be developed jointly with a LCA, taking into accoun t the same product system, boundaries, and functional unit, in order to ob- tain a complete assessment of environmental impacts and production costs. It does not exist a specific standard for the joint implementation of LCC and LCA, however, some guidelines can be found in [10,11,22]. According to [23] three conditions have to be defined before starting a LCC analysis: life cycle phases, inven- tory elements for each phase, environmental effects con- nected to different impacts. Applying LCC allows to achieve two main goals: adapting costs estimation ap- proaches to relate environmental costs to specific proc- esses and products, and facilitating the identification of best practices to prevent pollution and to reduce wastes. 3. MATERIALS AND METHODS 3.1. Regional Context and Site Description According to the 6th Italian Agriculture Census [24], vineyard surfaces of Calabria region, in Southern Italy, amount to 9,075.90 hectares (ha), representing 2.4% of the national surface and 34.4% less than 2000. Concerning farms number, a general negative trend of Italian viticulture is confirmed by regional data: Calabrian vine growing farms were 34,291 in 2000, and 13,390 in 2010, with a re duct i o n o f 61 % . In this regional context, the province of Crotone (where the case study is located) counts a vineyard surface of 3,236 ha, that represents the 32.3% of the regional viti- cultural area. In this province the general decrease of surface and farms is attenuated. This is consistent with the important role played by viticulture in this province that represents over 70% of the cultiv ated areas with cer- tificated labels products. In this province, the “Cirò” production area is very significant because its “Protected Designations of Origin” (PDO) wines amounts to 80% of Calabrian production. The research context is located in the above mentioned area (Figure 1) and extends along the Ionian cost for about 25 km and inland up to Sila’s mountains. The area includes the municipalities of Cirò, Cirò Ma- rina and, partly, of Melissa and Crucoli. The orography is rather varied, with a coastal strip at the sea level and the terraced hills at about 300 - 350 m above sea level. Pre- cipitations are mainly distributed in the autumn-winter season, maximum temperatures occur in August requir- ing the use of emergency irrigation, and soils texture varies from sandy loam to medium texture. Despite wine production represents a historic activity of great importance within the Cirò area, farms produc- tion structures are quite obsolete: grapevines are culti- vated with traditional techniques, with low levels of mechanization. Most of the vineyards are conducted with “gobelet” or “espalier” (cordon and Guyot) training sys- tems, which require high levels of labour generating so high production costs. Organic viticulture is very devel- oped and it is characterized by low levels of external inputs in the production cycle, coherently with the pro- cedural guidelines of “Cirò” PDO. Two cropping systems-organic and conventional-and two training systems-espalier and gobelet-have been identified and therefore, four production scenarios have been studied: “organic-espalier” (OE), “conven- tional-espalier” (CE), “organic-gobelet” (OG) and “con- ventional-gobelet” (CG). After analyzing the main tech- nical and economic characteristics, values per area unit Vineyard Figure 1. Study area. The Cirò territory in Calabria re- gion (South Italy). Copyright © 2013 SciRes. Openly accessible at http://www.scirp.org/journal/as/  A. Strano et al. / Agricultural Sciences 4 (2013) 12-2 0 15 and their relative impacts have been calculated. 3.2. Application of LCA Method to the Case Study The first phase of the analysis, according to LCA guidelines [10,11], has been the identification and defini- tion of the above mentioned scenarios. In a second phase, 1 ha of planted surface has been chosen as a “functional unit”, and then system limits have been defined considering production phases “from cradle to gate”, or rather from plantation to wine grapes harvesting, excluding wine processing, distribution and consumption. Therefore, the considered life cycle goes from vine- yard plantation to disposal (25 years). The same life cy- cle has been object of an economic assessment through the LCC methodology. Inputs and outputs data related to production have been directly collected from the field. Data on emissions have been obtained from secondary sources; these last data did not correspond exactly to the reality of the ana- lyzed farms, however errors have been systemic and did not affect comparison results. Data have been collected from a group of 24 ordinary farms with an average surface of about 15 - 20 ha, be- cause of their significance among others. Techno-economic data of three growing seasons - 2009, 2010 and 2011 - have been collected and consid- ered in order to reduce the uncertainty degree connected to seasonality and subjectiv ity of farms management, but also to attenuate production fluctuations and other exter- nal factors that could have influenced plants productivity. Therefore, for each farm, average values per hectare have been processed. To identify analytically all inputs and outputs, both environmental and economic ones, a specific questionnaire has been arranged. In addition to general questions about the farm, it has also included specific questions on inputs quantities and prices, as well as the obtained yields. For the analyzed three-year period, the following factors have been con- sidered: fuel consumption, for each technical operation; water consumption required for rescue irrigation; modal- ity of water distribution and related energy consumptions; quantity, type, period and distribution modality of pesti- cides; wastes disposal modality. In order to adopt the LCA method, collected data have been processed and grouped into macro categories as shown in Table 1. Inventory data were processed using SimaPro 7.2 software, Eco-invent V. 2.0 database and Eco-indicator method to elaborate each scenario. At a latter time, data have been processed with an additional method, EDIP 2003 (Environmental Design of Industrial Products), in order to compare the LCA results and to focus the GWP impact of the four considered scenarios, and so pointing out the carbon footprint. 3.3. Application of LCC Method to the Case Study In order to implement an economic analysis the LCC method has been used, considering farm labour remu- neration, land and working capital [25]. In this way, it has been possible to realize an inventory costs complementary to LCA inventory [18], as estab- lished in [10]. The same parameters and life cycle described in the previous paragraph has been considered for LCC imple- mentation. Each input and output considered in LCA analysis (i.e. inventory data) has been transformed in monetary values by multiplying the average quantity (of the three year period) by the unit price related to the last year of production. In order to reach the total cost o f every single process, all other costs associated to the inputs (e.g. those costs afforded for labour, disposal, etc.) have been considered. Furthermore, fixed costs linked to the overall production process (e.g., shares of insurance, taxes, etc.) have been considered for each production phase. Obtained data have been used to perform an invest- ments analysis, and so assessing the overall life cycle cost through appropriate financial indices: the Net Pre- sent Value (NPV) and the Internal Rate of Return (IRR)1. Table 1. Scheme for LCA data collection. Considered elements Measurement unit Description Fuel consumption l/ha/year Fuel consumptions per si ng l e fa rming operation Water consumption m3/ha/ yearWater consumptions per irrigation operation and pesticid es d is tribution Fertilisationkg/ha/year Quantities of fertilizers considering titrations of nutritive elements Pesticides treatments kg/ha/year Active principles distributed Electricity kW/ha/yearE nergy consumption per farming operation Wastes kg/ha/year Wastes per farming cycle in terms of High-density polyethy lene (HDPE) disposal (crates, packagi ng materials, bottles) Yield t/ha/year Average of wine grapes produced Source:[25]. 1Net Present Value (NPV) expresses the sum total of an investment’s discounted future cash flows. Internal Rate of Return (IRR) is a rate o return used to measure and compare the profitability of investments. Copyright © 2013 SciRes. Openly accessible at http://www.scirp.org/journal/as/ 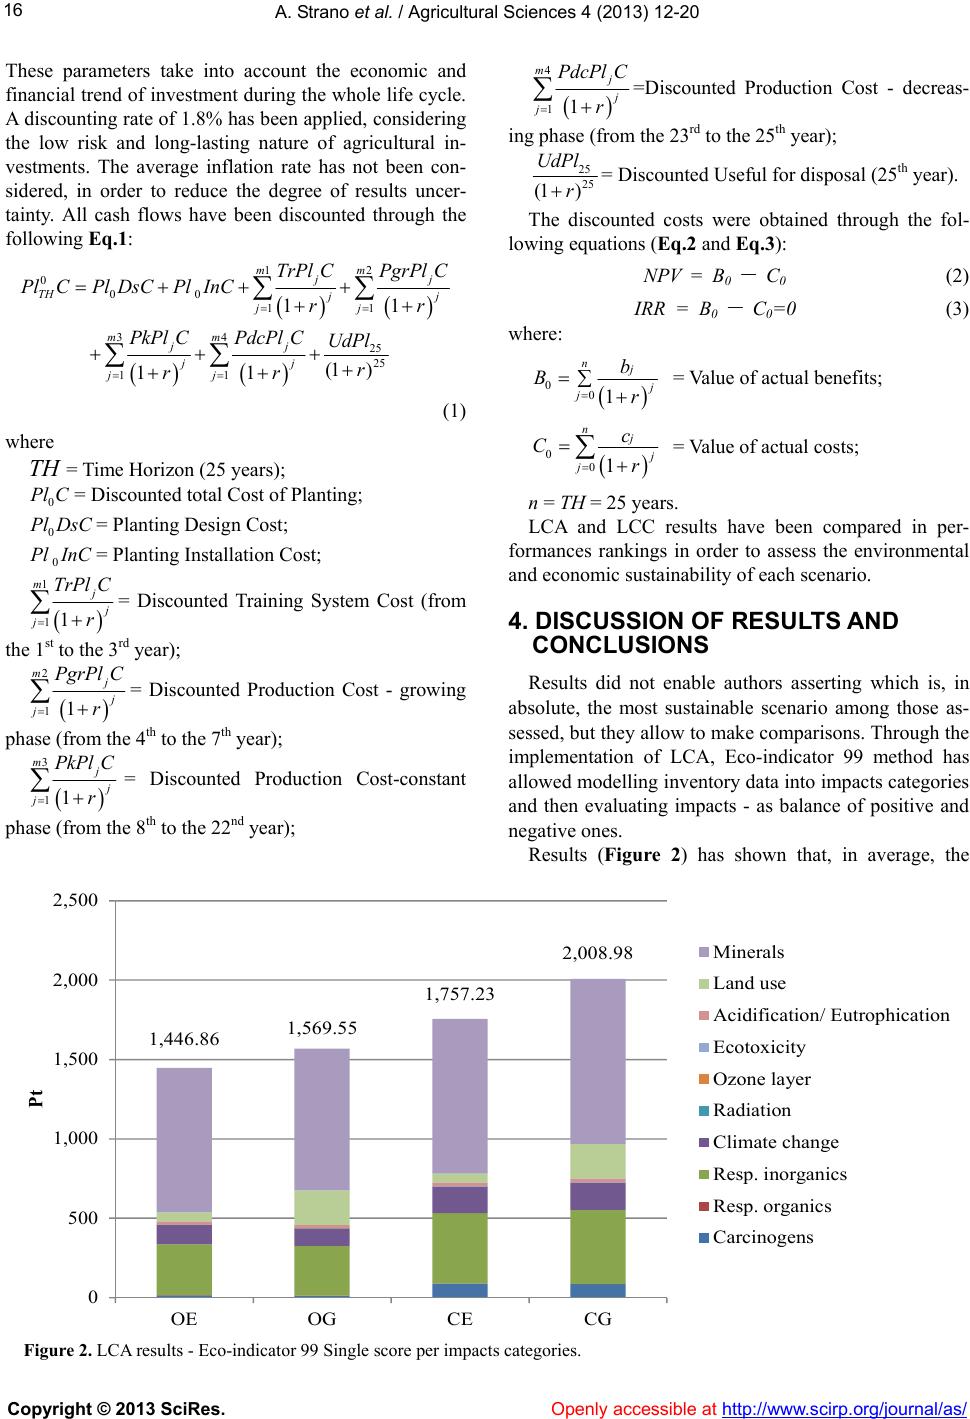 A. Strano et al. / Agricultural Sciences 4 (2013) 12-2 0 Copyright © 2013 SciRes. http://www.scirp.org/journal/as/ 16 These parameters take into account the economic and financial trend of investment during the whole life cycle. A discounting rate of 1.8% has been applied, considering the low risk and long-lasting nature of agricultural in- vestments. The average inflation rate has not been con- sidered, in order to reduce the degree of results uncer- tainty. All cash flows have been discounted through the following Eq.1: 4 11 mj j PdcPl C r =Discounted Production Cost - decreas- ing phase (from the 23rd to the 25th year); 25 25 (1 ) UdPl r= Discounted Useful fo r di sp osal (2 5th year). The discounted costs were obtained through the fol- lowing equations (Eq.2 and Eq.3): 12 000 11 34 25 25 11 11 (1 ) 11 mm jj TH j jj mm jj jj jj TrPl CPgrPl C PlCPl DsCPlInCrr PkPl CPdcPl CUdPl r rr NPV = B0 - C 0 (2) IRR = B0 - C 0=0 (3) where: 001 nj j b Br = Value of actual benefits; (1) 001 nj j c Cr = Value of actual costs; where TH = Time Horizon (25 years); 0 Pl C = Discounted total Cost of Planting; n = TH = 25 years. 0 PlDsC = Planting Design Cost; LCA and LCC results have been compared in per- formances rankings in order to assess the environmental and economic sustainability of each scen ario. 0 PlInC = Planting Installation Cost; 1 11 mj j TrPl C r = Discounted Training System Cost (from the 1st to the 3rd year); 4. DISCUSSION OF RESULTS AND CONCLUSIONS 2 11 mj j PgrPl C r = Discounted Production Cost - growing phase (from the 4th to the 7th year); Results did not enable authors asserting which is, in absolute, the most sustainable scenario among those as- sessed, but they allow to make comparisons. Throug h the implementation of LCA, Eco-indicator 99 method has allowed modelling inventory data into impacts categories and then evaluating impacts - as balance of positive and negative ones. 3 11 mj j PkPl C r = Discounted Production Cost-constant phase (from the 8th to the 22 nd year); Results (Figure 2) has shown that, in average, the 1,446.86 1,569.55 1,757.23 2,008.98 0 500 1,000 1,500 2,000 2,500 OE OG CECG Pt Minerals Land use Acidification/ Eutrophication Ecotox ic ity Ozone layer Radiation Climate change Resp. ino rg ani cs Resp. organics Carcinogens Figure 2. LCA results - Eco-indicator 99 Single score per impacts categories. Openly accessible at  A. Strano et al. / Agricultural Sciences 4 (2013) 12-2 0 17 most sustainable scenario is “OE” with 1,446.86 Eco- points, and the worst performing one is “CG” scenario with 2,008.98 Ecopoints. The gap between them amount to 38.9%. Regarding life cycle phases, and taking into account the duration of each one, in all cases the most affecting ones are the “planting” (the year zero) and the “constant production” phase (from the 8th to the 22nd year), imputable to “minerals”, “land use” and “carcino- gens” categories because of the use of fertilizers, pesti- cides and machines. EDIP methodology (Figure 3), that includes global warming assessment, has shown that the best performing scenario is “OG” with 106.71 Ecopoints, and the worst one is “CE” scenario with 140.63 Ecopoints; the gap between them amount to 31.8%. These impacts are im- putable to the following categories, ranked from the most impacting: “Radioactive waste”, “Aquatic eutrophication EP(N)”, “Aquatic eutrophication EP(P)”, “Human toxic- ity water”, “Human toxicity soil” and “Bulk waste”. These categories of impacts refer to the use of chemicals and machines, especially in “planting” and “farming” (from the 1st to the 3rd year) phases. The comparison between obtained environmental re- sults using Eco-indicator 99 and EDIP highlights that organic cropping system is the best in both cases. In Figure 3, Global Warming Potential (kg of CO2 equivalents) has been highlighted, showing that “OG” scenario produces less emissions (24,317.64 kg of CO2 eq.), while “CG” scenario produces more emissions (28,875.10 kg of CO2 eq.), 18.7% more than the first one. Concerning the implementation of LCC methodology to assess economic performances, Figure 4 shows life cycle discounted costs: “OE” is the best performing sce- nario, amounting to 80,257.45 Euro, while the worse one is the “CG” scenario with an amount of 87,476.18 Euro, a 9% more than the first one. Financial indicators to analyze profitability of investments, i.e. NPV and the IRR, have been calculated for each scenario; they have shown that “CE” scenario is the most economically ad- vantageous one, with a NPV of 24,274.27 € and an IRR of 6.6%, followed by “OE”, “CG” and “OG” scenarios (Figure 4). The difference between “CE” and “OG” sce- narios amount to 51.5% in terms of IRR and to 76.9% in terms of NPV. It is also necessary specifying that these last results have taken into consideration European subsidies to farming, without which only investments for the “CE” scenario would have been profitable. The relative gaps (in percentage) between each sce- nario performances are shown in Graphic 4, allowing a visualization of both environmental and economical re- sults. A percentage of 100% has been given to the best performing scenario, or rather, the most sustainable among the others. Greater performance differences between scenarios are evident, above all, in Eco-indicator 99, in NPV and IRR values. “CG” and “CE” scenarios are nearly always the worst performing: this occurs in terms of environmental damages for all indicators and in terms of discounted costs. 110.35 106.71 140.63 140.25 25,152.99 24,317.64 28,579.7428,875.10 0.00 5,000.00 10,000.00 15,000.00 20,000.00 25,000.00 30,000.00 0 20 40 60 80 100 120 140 160 OE OGCECG kg C O 2 eq Pt Global warming 100a Resources (all) Radioactive waste Bulk waste Slags/ashes Hazardous waste Ecotox icity soil chronic Ecotoxicity water acu t e Ecotoxicity water chronic Human toxicity soil Human toxicity water Human toxicity air Aquatic eutrophication EP(P) Aquatic eutrophication EP(N) Terrestrial eutrop hication Acidification Ozone form ati on (Human) Ozone form ati on (Vegetat ion) Ozone depletion Global warming 100a Value Figure 3. LCA results - EDIP 2003 Single score per impacts categories (Pt) and GWP100a Values (kg of CO2 eq). Copyright © 2013 SciRes. Openly accessible at http://www.scirp.org/journal/as/  A. Strano et al. / Agricultural Sciences 4 (2013) 12-2 0 18 Concerning NPV and IRR values, there is a great dif- ference between the best performing scenario, “CE”, and the others, with a relative gap between the best and the worst (“OG”) of about a 76.9% in terms of NPV, and about a 51.5% in terms of IRR. In spite of the impossibility of an integrated assess- ment, comparisons in terms of “percentage distance” of each scenario from the best one (Figure 5) have high- lighted some valuable information. LCA results indicate organic growing systems (“OE” and “OG”) as those best performing in environmental terms, with very few differences on gaps’ averages. LCC results have shown that the espalier training systems are the most economically viable, with a difference between gaps’ averages of 24.37 percentage points (p.p.) between “CE” (the best in terms of average results’ LCC) and “OE” s cenario. Concluding, on average, “OE” scenario is the most environmentally performing and the “CE” is the most economically viable; differences between their average performance values are similar, corresponding to 21.31 p.p. in terms of environmental performances, and 24.37 p.p. in terms of economic ones. Results did not allow to assert which is the best sus- tainable scenario in absolute, because further analysis should be necessary in order to assess trade-offs between all concerns, considering also social ones. However, LCA and LCC methodologies are useful tools for deci- sion making, as they can help deciders (farmers, politi- cians and consumers) to understand what they are choosing within their actions, how to identify hot points of their operation phases and where interventions on processes are necessary. 12,833.00 5,605.35 24,274.27 9,294.51 80,257.45 83,737.91 81,423.97 87,476.18 4,60 %3,20 %6,60 %4,00% 0 10 20 30 40 50 60 70 80 90 100 0.00 10,000.00 20,000.00 30,000.00 40,000.00 50,000.00 60,000.00 70,000.00 80,000.00 90,000.00 100,000.00 OE OG CECG r (%) € NPV Discounted C ost s IRR Figure 4. LCC results - NPV and Discounted Costs (€); IRR (%). 0 10 20 30 40 50 60 70 80 90 100 Eco - indicato 99 EDIP 2003 Globa arming 100aDiscounte costs PV IR OE OG CE CG LCA LCC p.p. Figure 5. Comparison of gaps between scenarios. Copyright © 2013 SciRes. Openly accessible at http://www.scirp.org/journal/as/  A. Strano et al. / Agricultural Sciences 4 (2013) 12-2 0 19 This deepened knowledge about the consequences of human activities permits to fo cus possible improvements on sustainability performances, reducing impacts on the environment and make farming more economically vi- able. 5. ACKNOWLEDGEMENTS This work is a part of the “Agreement Framework Program” - Action 3 “Caparra & Siciliani” Research Project ca rried out by the Depart ment of AGRARIA (Mediterranean University of Reggio Calabria) and sup- ported by the Regional Authority of Calabria (Italy). REFERENCES [1] Gaillard, G., Nemecek, T. (2009) 6th International confer- ence on lca in the agri-food sector. The International Journal of Life Cycle Asses sment, 14, 687-689. doi:10.1007/s11367-009-0121-5. [2] Khan, S., Hanjra, M. A. (2009) Footprints of water and energy inputs in food production - global perspectives, Food Policy, 34, 130-140. doi:10.1016/j.foodpol.2008.09.001. [3] WCED (1987) Report of the world commission on envi- ronment and development: our common future, Oxford University Press. [4] Wiedmann, T., Minx, J. (2010) A definition of “carbon footprint”. Research and consulting-ISAUK Research Re- port 07-01. [5] Luciani, R., Masoni, P. and Santino, D. (2011) Indicatori di sostenibilità ambientale: la carbon footprint. Energia, Ambiente e Innovazione, 3. [6] Guinée, J.B. (2002) Handbook on life cycle assessment - Operational guide to the ISO standards, Kluwer Aca- demic Publishers. [7] Saling, P., Rether, J. and Gipmans, M. (2010) Measuring sustainability in the agri-food sector: BASF’s eco-efficiency and SEEBALANCE analysis, in Notarni- cola, B., Settanni, E., Tassielli, G; Giungato, P. (Eds.) Proceedings of LCAFOOD 2010 VII International con- ference on life cycle assessment in the agri-food sector, Bari. [8] De Gennaro, B., Notarnicola, B., Roselli, L. and Tassielli, G. (2012) Innovative olive-growing models: an economic and environmental assessment. Journal of Cleaner Pro- duction, 28, 70-80. doi:10.1016/j.jclepro.2011.11.004 [9] SETAC (1991) A technical framework for [product] life-cycle assessments. Held in Smuggler’s Notch, Ver- mont, USA. [10] ISO (2006) ISO 14040:2006 Environmental management - Life Cycle Assessment - Principles and framework, In- ternational Organization for Standardization (ISO), Ge- neva. [11] ISO (2006) ISO 14044:2006 Environmental management - Life Cycle Assessment - Requirements and guidelines, International Organization for Standardization (ISO), Geneva. [12] European Commission (2007) Carbon footprint - what it is and how to measure it. http://lct.jrc.ec.europa.eu/pdf-directory/Carbon-footprint. pdf. [13] Pandey, D., Agrawal, M. and Pandey, J.S., (2011) Carbon footprint: current methods of estimation. Environmental Monitoring and Assessment, 178, 135-160. doi:10.1007/s10661-010-1678-y. [14] Horne, R., Grant, T., Verghese, K. (2009) Life Cycle As- sessment. Principles, Practice and Prospects. CSIRO Publishing. [15] Sanjuan, N., Ubeda, L., Clemente, G., Mulet, A., Girona, F., (2005) LCA of integrated orange production in the comunidad valenciana (spain) International Journal of Agricultural Resources, Governance and Ecology, 4, 163. doi:10.1504/IJARGE.2005.007198. [16] Mila` i Canals, L., Burnip, G.M. and Cowell, S.J.(2006), Evaluation of the environmental impacts of apple produc- tion using Life Cycle Assessment (LCA): Case study in New Zealand Agriculture. Ecosystems and Environment, 114, 226-238. doi:10.1016/j.agee.2005.10.023. [17] Poritosh, R., Daisuke, N., Takairo, O., Qingyi, X., Hiroshi, O., Nobutaka, N. and Takeo, S. (2009) A Review Of Life Cycle Assessment (LCA) On Some Food Products, Journal Of Food Engineering, 90, 1-10. doi:10.1016/j.jfoodeng.2008.06.016. [18] Notarnicola, B., Settanni, E. and Tassielli, G., (2009) Ap- procci all’integrazione dei costi in LCA: life cycle costing, analisi input-output, in Cappellaro, F., Scalbi, S., (Eds.) Atti del Convegno Scientifico della Rete Italiana LCA, Palermo. [19] Gluch, P. and Baumann, H. (2004) The life cycle costing (LCC) approach: a conceptual discussion of its usefulness for environmental decision-making. Building and Envi- ronment, 39, 571-580. doi:10.1016/j.buildenv.2003.10.008. [20] Rebitzer, G. and Hunkeler, D. (2003) Life cycle costing in lcm: ambitions, opportunities and limitations. The Inter- national Journal of Life Cycle Assessment, 8, 253-256. doi:10.1007/BF02978913. [21] Huppes, G., van Rooijen, M., Kleijn, R., Heijungs, R., de Koning, A. and van Oers, L. (2004) Life cycle costing and the environment. Report of a project commissioned by the Ministry of VROM-DGM for the RIVM Expertise Centre LCA. [22] Lichtenvort, K., Rebitzer, G., Huppes, G., Ciroth, A., Seuring, S., Schmidt, W.-P., Günther, E., Hoppe, H., Swarr, T. and Hunkeler, D. (2008) History of life cycle costing, its categorization, and its basic framework, in Hunkeler, D., Lichtenvort, K. and Rebitzer G. (Eds.) En- vironmental life cycle costing, SETAC-CRC. [23] White, A.L., Savage, D. and Shapiro, K., (1996). Life Cycle Costing: concept and applications, in Curran M.A. (Eds.), Environmental Life Cycle Assessment, Mc Graw Hill. [24] ISTAT (2012) 6th Italian Agriculture Census. http://www.istat.it/it/censimento-agricoltura/agricoltura-2 010 (accessed on February 2012). Copyright © 2013 SciRes. Openly accessible at http://www.scirp.org/journal/as/  A. Strano et al. / Agricultural Sciences 4 (2013) 12-2 0 20 [25] Pirilli, M., Falcone, G. and Strano, A. (2012) La formazi- one dell’inventario per l’LCA nei confronti fra processi produttivi agricoli nella clementinicoltura in Calabria, in Scalbi, S., Dominici Loprieno, A., (Eds.) Atti del VI Con- vegno della Rete Italiana LCA - Dall’Analisi del Ciclo di Vita all’impronta Ambientale, Bari. Copyright © 2013 SciRes. Openly accessible at http://www.scirp.org/journal/as/
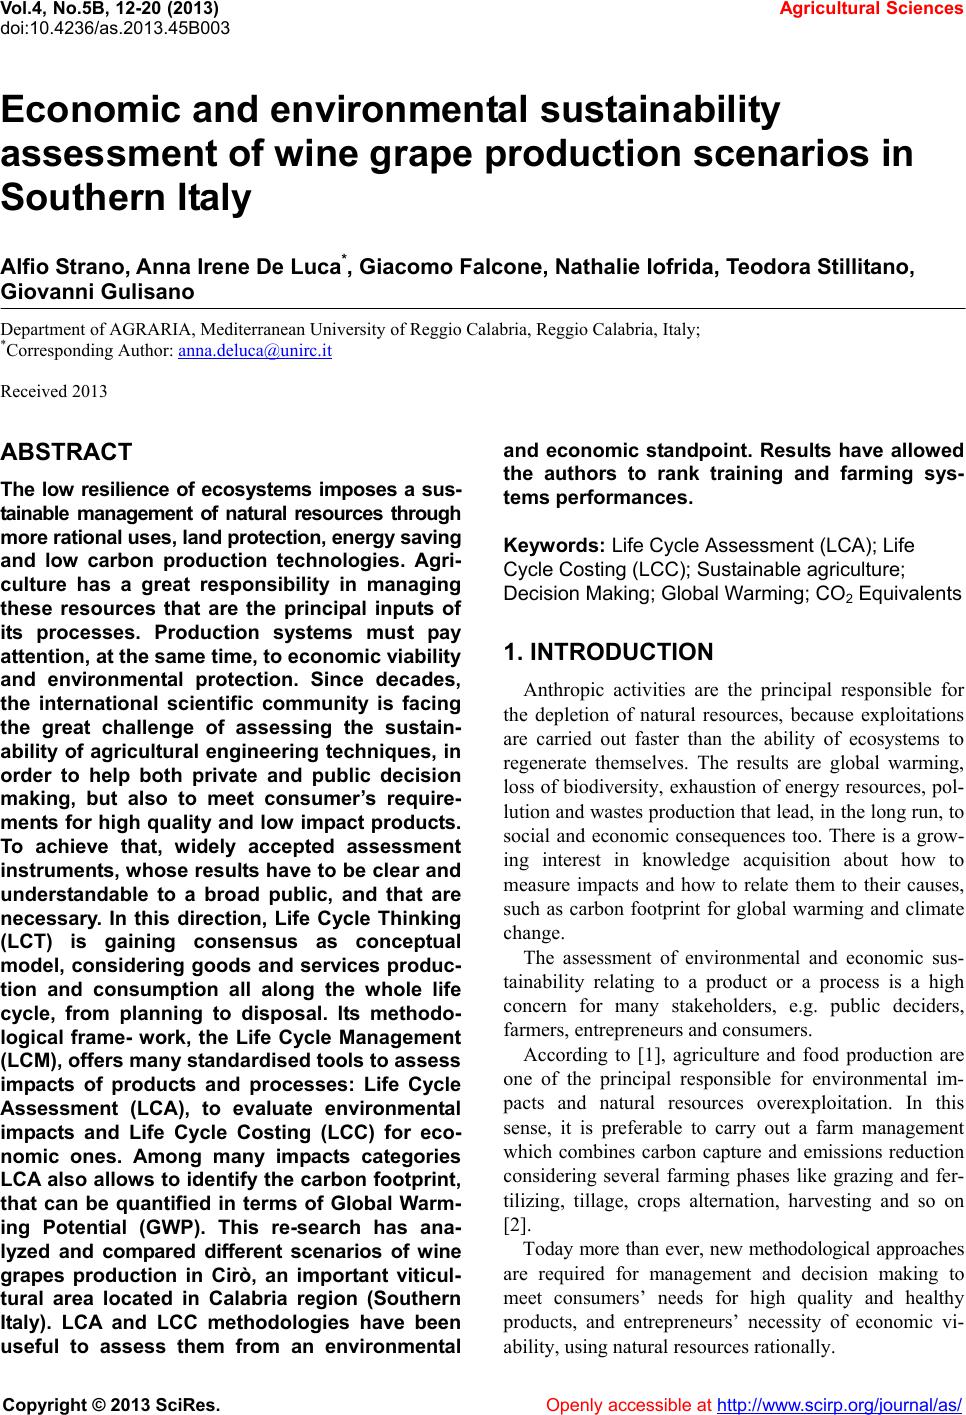
|